![]()
![]()
![]()
![]()
-- Weekly Market Update for the Week Commencing 9th April 2018
Big Picture
View
Here is a summary of our big picture
view of the markets. Note that our short-term views may differ from our
big picture view.
The BULL market in US Treasury Bonds that began in the early 1980s ended in mid-2016, but there will be many years of topping action in bond prices and bottoming action in bond yields before major new trends get underway. A major decline in government bond prices will unfold during the 2020s. (Last update: 11 September 2017)
The stock market, as represented by the S&P500 Index, commenced a secular BEAR market during the first quarter of 2000, where "secular bear market" is defined as a long-term downward trend in valuations (P/E ratios, etc.), gold-denominated prices and inflation-adjusted prices. This secular trend will bottom in 2020 or later. (Last update: 11 September 2017)
A cyclical BEAR market in the US Dollar began in 2016-2017. (Last update: 11 September 2017)
Gold commenced a secular bull market relative to all fiat currencies, the CRB Index, bonds and most stock market indices during 1999-2001. This secular trend will peak in 2020 or later. (Last update: 11 September 2017)
Commodities,
as represented by the CRB Index, commenced a
secular BULL market in 2001 in nominal dollar terms. The first major
upward leg in this bull market ended during the first half of 2008, but
a long-term peak won't occur until 2020 or later.
(Last
update: 11 September 2017)
Copyright
Reminder
The commentaries that appear at TSI
may not be distributed, in full or in part, without our written permission.
In particular, please note that the posting of extracts from TSI commentaries
at other web sites or providing links to TSI commentaries at other web
sites (for example, at discussion boards) without our written permission
is prohibited.
We reserve the right to immediately
terminate the subscription of any TSI subscriber who distributes the TSI
commentaries without our written permission.
True
Fundamentals Summary
[Notes:
1) The date shown next to the current True Fundamentals Model (TFM) signal is
when the most recent change occurred. 2) Charts of the Gold and Equity
TFMs are included in the "Charts and Indicators" section of the TSI web
site]
| Market | True Fundamentals Model (TFM) |
| Gold (US$ Price) | Bearish (12 Jan 2018) |
| US Equity (SPX) | Bearish (23 Mar 2018) |
| Currency (Dollar Index) | Bullish (15 Dec 2017) |
| Commodities (GNX) | Bullish (29 Dec 2017) |
Last week's posts at the TSI Blog
There were no blog posts last week.
Summary of current
thinking/positioning
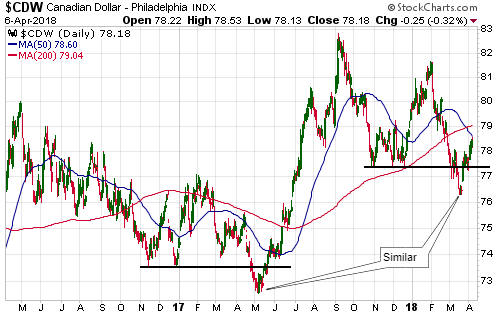
1) A number of markets are set
up for trend reversals or accelerations, with the US$ being the linchpin.
If the DX breaks out to the downside from its recent narrow range, rallies
should begin or accelerate across the commodity world with silver bullion
and gold-mining stocks leading the way higher. However, if the DX breaks
out to the upside from its recent range then the commodity world will be
pressured downward for at least a few weeks thereafter.
2) The SPX
is about to either end its correction by completing a successful test its
early-February low (2530) or escalate the significance of the January-2018
top by breaking to a new low for the year. The former outcome is the more
likely, but we are not betting either way.
3) Downward corrections
in oil and copper will end by May, with the timing dependent upon what
happens in the currency market.
4) Bond yields are in long-term
upward trends and will go much higher before year-end, but a counter-trend
move is underway. The counter-trend move could end at any time.
5)
Holding a cash reserve of around 30%.
US Recession
Watch
The latest iteration of the ISM
New Orders Index (NOI) was reported last week. The NOI is one of the three
leading indicators of US recession that we care about, the others being
Real Gross Private Domestic Investment (RGPDI) and the yield curve.
The NOI has declined each month since making a 13-year high in
December-2017. However, it remains near the top of its 20-year range and
far above the level that it would have to drop below (the red line on the
following chart) to warn of a recession.
RGPDI only gets updated quarterly and won't get its next update until
late this month, but as at Q4-2017 it was still in an upward trend (an
upward trend in RGPDI implies that the start of a recession is at least
two quarters away).
The yield curve, which is updated daily, warns
of a recession when a major flattening trend (short-term rates rising
relative to long-term rates) comes to an end, that is, when evidence
emerges that the major trend has changed from flattening to steepening.
With the spread between the 10-year and 2-year T-Note yields having
recently hit a 10-year low, there is presently no sign of the yield-curve
reversal that almost always precedes a recession.
The upshot is that there has been no change in our expectations
regarding the timing of the next US recession. The probability of a
recession beginning during the first half of this year remains close to
zero (for all intents and purposes, it is zero), but due to the tightening
of monetary conditions there is a realistic chance that a recession will
begin before year-end.
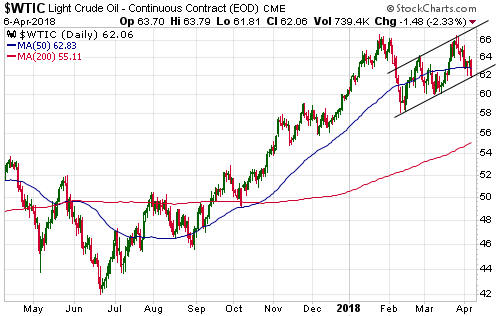
Commodities
Oil's double top
In the 27th March Interim Update we wrote that the oil price had
probably double-topped near $66 as part of a multi-month correction. Our
thinking hasn't changed.
Under the double-top scenario a decline to
well below the early-February low ($58) would complete the correction.
Copper turns around after breaching support
Copper is one of the "EV Metals", that is, one of the metals that will
receive a significant demand boost due to the increasing popularity and
eventual domination of electric vehicles. As explained in previous
commentaries, we think that "EV Metals" is the commodity group that offers
the best risk/reward with regard to the current year and the next five
years. In particular, it offers a better risk/reward than the precious
metals group (gold, silver and platinum) or the traditional energy-fuels
group (oil, natural gas, thermal coal and uranium). However, timing, as
always, will be important, and within the long-term "EV Metals" bull
market there will be many opportunities to scale into and out of
positions.
In late-March the copper price broke below support at
$3.00-$3.05, warning that a decline to as low as $2.50 could be on the
cards. However, a subsequent reversal negated the breakdown. Also worth
mentioning is that the upward reversal has placed more emphasis on the
$2.90-$2.95 support range, as this is the support that acted as a floor.
The recent rebound has muddied the waters as far as the price action
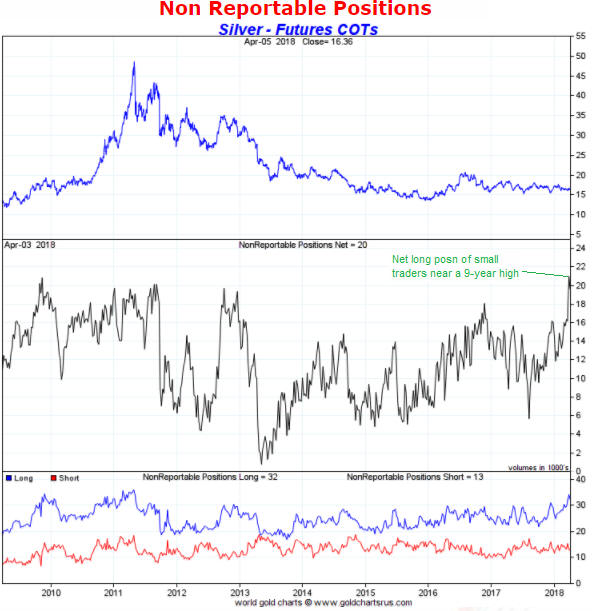
is concerned. At the same time, sentiment (as indicated by the COT data)
is neutral and the current physical supply-demand situation (as primarily
indicated by the futures price curve) is neutral or perhaps even slightly
bearish. Therefore, we don't have a good reason to expect that a
substantial rally is about to begin. Instead, despite the late-March false
breakdown we think the odds favour some additional weakness prior to a
correction low.
Additional short-term weakness in the copper price
should be viewed as an opportunity to add exposure to copper mining stocks
in anticipation of a strong rally from whatever low is made over the next
month or so. One such stock is Freeport McMoran (FCX), the world's largest
publicly-traded copper producer. FCX has been in correction mode for the
past three months and may be close to a correction low in terms of both
price and time.
If we are dealing with a 3-4 month correction
within a longer-term upward trend, which is probably the case, then the
optimum place for new buying would be slightly above the lateral support
line drawn on the following daily chart (that is, near $16.00).
Interestingly, this lateral support now roughly coincides with the 200-day
MA.
Note that speculators who want more bang for the buck and are
prepared to accept the risk of a much greater percentage loss, an
alternative to buying the stock would be to buy FCX call options with an
expiry date of January-2019. The timing would be the same, that is, the
options ideally would be purchased with the stock trading at around
$16.00.
Platinum's correction goes deeper than expected
There was a false downside breakout in the platinum price in
December-2017 that set the stage for a powerful rally that added $150 in
the space of only 6 weeks. By late-January the market was very
'overbought' and, as we noted in these pages at the time, the price was
unlikely to get through resistance at $1025-$1050 without a sizable
intervening correction.
We guessed that the correction would end
near $950, but it has retraced more of the preceding rally than expected
and might not yet be complete.
Platinum is now very 'oversold' in US$ terms and relative to gold. In
fact, relative to gold it ended last week at a new multi-decade low. On
this basis and due to the fact that useful commodities always have
significant monetary value, investors who are prepared to hold for at
least 1-2 years should be buyers of physical platinum or platinum ETFs at
this time.
The Stock Market
The point of recognition
As explained in numerous TSI commentaries, the stock market will
usually view a new downward trend in bond prices and the associated upward
trend in interest rates as a minor issue until a point is reached when
falling bond prices (rising interest rates) are the only issue that
matters. After this 'point of recognition' is reached, the downward trend
in the bond market begins to have a very negative effect on the stock
market.
There was a high risk that the 'point of recognition' this
time around would be the T-Bond breaking below its March-2017 low,
signaling the completion of a major topping pattern for long-dated US
government bonds. However, the bullish equity trend was shaken but not
shattered by the T-Bond's breakdown.
The issue isn't settled, but
we suspect that what occurred over the past 2.5 months is akin to the
initial scare caused by the T-Bond's break below support in April-1987. As
illustrated by the following chart, 1987's 'initial scare' evaporated and
the SPX commenced a new short-term upward trend when the T-Bond rebounded.
It wasn't until August, when the T-Bond breached its May low, that a major
stock market decline began to unfold.
With the benefit of
hindsight it is clear that the August-1987 downside breakout by the T-Bond
was the stock market's 'point of recognition' -- the point when a critical
mass of market participants realised that the rise in interest rates was
inexorable and totally incompatible with current equity valuations.
If the effect on the stock market of the T-Bond's January-2018
downside breakout is equivalent to the 'initial scare' of April-1987, then
this time around the 'point of recognition' for the stock market will
coincide with the T-Bond breaking below its February-2018 low.
Our expectation is that the T-Bond price will continue to fall until
higher interest rates have set in motion a major decline in the stock
market or a major decline in the stock market has begun for some other
reason. To put it another way, we doubt that the rising interest-rate
trend will end in the absence of a large decline in the stock market.
Current Market Situation
Daily volatility in
the US stock market continues to be much greater than usual, with daily
SPX swings in excess of 1% now being more the norm than the exception. We
expect this higher-volatility environment to persist over the remainder of
the year, creating a stark contrast between 2018 and 2017.
Last
Monday the SPX closed below its 200-day MA, but somewhat surprisingly
there was no follow-through to the downside. There also wasn't a rebound
of any substance and at the end of the week the index was hovering only 10
points above this MA.
On Friday 6th April there was a marginal breakdown in the Dow
Transportation Average (TRAN). As illustrated below, TRAN ended the week
slightly below its channel bottom (note that the channel shown on this
chart is well defined and goes all the way back to the January-2016 low).
The message of the above two charts is that the market's current
position is precarious. The next chart amplifies this message. It shows
that, like the TRAN, the NASDAQ100 ETF (QQQ) ended the week slightly below
its channel bottom.
That some of the most important stock indices closed slightly above or
slightly below critical support levels at the end of last week opens up
the possibility of downward acceleration this week.
While daily
closes below last week's lows would elevate the correction from the
short-term to the intermediate-term variety, there is still scant evidence
that a major decline has begun. Of particular relevance, the market is
exhibiting a lot more internal strength than it most likely would be if we
were dealing with the early months of a cyclical bear.
For example,
a week ago we noted the shrinking number of NYSE-traded common stocks
making new 12-month lows. The trend continued last week. As illustrated
below, although the NYSE Composite Index (NYA) ended last Friday near the
bottom of this year's trading range, only 17 stocks made new 12-month lows
on the day. This contrasts with more than 170 new lows on one of the days
during the early-February sell-off.
For another example, the next chart shows that a) there was no bearish
divergence between the NYA and the NYSE Advance-Decline (AD) Line at the
January price peak (the AD Line confirmed the price peak) and b) the AD
Line has held up well during the market turmoil of the past 2.5 months.
The bottom line is that the technical position of the market makes it
vulnerable to another multi-day plunge, but it's still likely that we are
dealing with a bull market correction rather than the start of a bear
market.
What are we doing?
With regard to
the management of our own account, advantage was taken of the sharp
decline that occurred last Monday to exit the remaining short-term bearish
speculations (QQQ put options with an expiry date of 20th April). We then
placed an order to buy QQQ put options with a June expiry date, but the
order wasn't filled because the rebound from Monday's low wasn't quite
strong enough. We are therefore 'on the sidelines' awaiting a better
opportunity.
This week's
significant US economic events
[Notes:
1) The most important events
(to the markets) are shown
in bold. 2) A list of global economic events can be found
HERE]
| Date | Description |
| Monday Apr-09 | No important events scheduled |
| Tuesday Apr-10 | PPI |
| Wednesday Apr-11 |
CPI Treasury Budget FOMC Minutes |
| Thursday Apr-12 | Import and Export Prices |
| Friday Apr-13 | Consumer Sentiment |
Gold and the Dollar