![]()
![]()
![]()
![]()
-- Weekly Market Update for the Week Commencing 9th July 2018
Big Picture
View
Here is a summary of our big picture
view of the markets. Note that our short-term views may differ from our
big picture view.
The BULL market in US Treasury Bonds that began in the early 1980s ended in mid-2016, but there will be many years of topping action in bond prices and bottoming action in bond yields before major new trends get underway. A major decline in government bond prices will unfold during the 2020s. (Last update: 11 September 2017)
The stock market, as represented by the S&P500 Index, commenced a secular BEAR market during the first quarter of 2000, where "secular bear market" is defined as a long-term downward trend in valuations (P/E ratios, etc.), gold-denominated prices and inflation-adjusted prices. This secular trend will bottom in 2020 or later. (Last update: 11 September 2017)
A cyclical BEAR market in the US Dollar began in 2016-2017. (Last update: 11 September 2017)
Gold commenced a secular bull market relative to all fiat currencies, the CRB Index, bonds and most stock market indices during 1999-2001. This secular trend will peak in 2020 or later. (Last update: 11 September 2017)
Commodities,
as represented by the CRB Index, commenced a
secular BULL market in 2001 in nominal dollar terms. The first major
upward leg in this bull market ended during the first half of 2008, but
a long-term peak won't occur until 2020 or later.
(Last
update: 11 September 2017)
Copyright
Reminder
The commentaries that appear at TSI
may not be distributed, in full or in part, without our written permission.
In particular, please note that the posting of extracts from TSI commentaries
at other web sites or providing links to TSI commentaries at other web
sites (for example, at discussion boards) without our written permission
is prohibited.
We reserve the right to immediately
terminate the subscription of any TSI subscriber who distributes the TSI
commentaries without our written permission.
True
Fundamentals Summary
[Notes:
1) The date shown next to the current True Fundamentals Model (TFM) signal is
when the most recent change occurred. 2) Charts of the Gold and Equity
TFMs are included in the "Charts and Indicators" section of the TSI web
site]
| Market | True Fundamentals Model (TFM) |
| Gold (US$ Price) | Bullish (29 Jun 2018) |
| US Equity (SPX) | Bearish (29 Jun 2018) |
| Currency (Dollar Index) | Bullish (27 Apr 2018) |
| Commodities (GNX) | Bearish (01 Jun 2018) |
Last week's posts at the TSI Blog
Gold's true fundamentals turn bullish
Summary of current
thinking/positioning
1) Anticipating a Dollar Index
(DX) decline to 92 and a euro rally to 1.20 within the next 2 months, but
unsure regarding the 6-12 month prospects.
2) Gold and silver
prices may have bottomed in early-July, but the bottoms haven't been
confirmed.
3) Some US stock indices are set to make new all-time
highs in July, but risk is increasing and there are preliminary signs that
the market as a whole is rolling over into what could be a substantial
decline.
4) The industrial metals markets have weakened across the
board and in some cases are now very stretched to the downside. At the
same time the oil market looks stretched to the upside on a short-term
basis. We are anticipating counter-trend rebounds in metal prices and a
downward correction in the oil price.
5) The T-Bond price should
have an upward bias for another 2-3 months.
6) Holding a cash
reserve of around 30% and looking for opportunities to build up this
reserve.
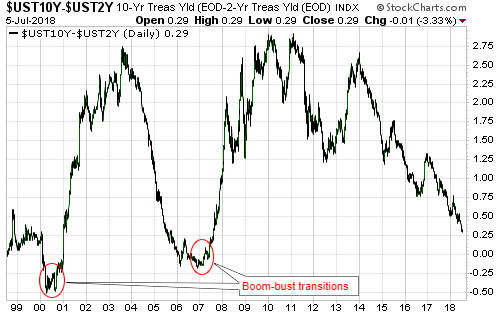
Another look at
the US yield curve
The US yield curve, as indicated
by the spread between the 10-year and 2-year T-Note yields, made a new
10-year extreme last week, meaning that it is now the 'flattest' it has
been in more than 10 years. While this possibly indicates that the boom is
nearing its end, it definitely indicates that the transition from boom to
bust has not yet begun.
As explained numerous times in the past,
the 'flattening' of the yield curve (short-term interest rates rising
relative to long-term interest rates) is a characteristic of a
monetary-inflation-fueled economic boom. It doesn't matter how flat the
yield curve becomes or even if it becomes inverted, the signal that the
boom has ended and that a bust encompassing a recession is about to begin
is the reversal of the curve's major trend from flattening to steepening.
To put it another way, the signal that the proverbial chickens are coming
home to roost is short-term interest rates peaking RELATIVE TO long-term
interest rates and then beginning to decline relative to long-term
interest rates. This generally will happen well before the Fed sees a
problem and begins to cut its targeted short-term interest rate.
The following chart highlights the last two major reversals of the US
yield curve from flattening to steepening. These reversals were confirmed
about 6 months prior to the recessions that began in March-2001 and
December-2007.
The fact that the yield curve is still hitting new
extremes in terms of 'flatness' suggests that the next US recession will
not begin before 2019.
The above is essentially a repeat of what we've written in the past,
but there is a new point we want to cover. The new point is that while it
would be almost impossible for the US economy to transition from boom to
bust without a timely reversal in the yield curve from flattening to
steepening, there is a realistic chance that the next yield-curve trend
reversal from flattening to steepening will not signal the onset of an
economic bust/recession. That's why we do not depend solely on the yield
curve when determining recession probabilities.
The reason that
the next yield-curve trend reversal from flattening to steepening will not
necessarily signal the onset of an economic bust/recession is that there
are two potential drivers of such a reversal. We are referring to the fact
that the reversal could be driven by falling short-term interest rates or
rising long-term interest rates. If it's the former it signals a boom-bust
transition, but if it's the latter it signals rising inflation
expectations.
As an aside, regardless of whether a major
yield-curve reversal from flattening to steepening is driven by the
unravelling of an artificial boom or rising inflation expectations, it is
bullish for gold. By the same token, a major reversal in the yield curve
from steepening to flattening is always bearish for gold.
With the
T-Bond rebound likely to continue for at least 2 more months there is
little chance that rising long-term interest rates will drive a yield
curve reversal during the third quarter of this year, but it's something
that could happen during the fourth quarter.
Commodities
Copper breakdown
Here's how we described the two most plausible copper scenarios in our
18th June commentary:
"...the extremely aggressive speculative
positioning indicated by the latest COT report combined with Friday's
decisive breach of $3.20 suggests that we are dealing with something more
bearish than a routine 1-2 week correction. It suggests that either the
previous week's move up to around $3.30 created an intermediate-term
double top, in which case a decline to as low as the $2.50s could precede
the next substantial rally, or the price will chop around between $2.95
and $3.30 for a few more months before resuming its multi-year upward
trend."
Last week the copper price broke below support at
$2.95, so the second of the above-mentioned scenarios has been ruled out.
This means that a decline to support near $2.50 is now the
highest-probability outcome, although given that the market is stretched
to the downside and that there is support near the current price it is
reasonable to anticipate a multi-week rebound prior to any significant
additional weakness.
Note that former support in the mid-$2.90s is
now resistance and is the most likely place for a near-term rebound to
peak.
We've been mentioning since early this year that the copper price
could revisit support at around $2.50 before resuming its bull market. The
early-June surge to test the December-2017 high was deceptive, but it's
not exactly a shock that the drawn-out period of sideways trading between
the $2.90s and the $3.20s turned out to be a topping pattern.
It's
unlikely, in our opinion, that a major top was put in place by the copper
market late last year. It's far more likely that the December-2017 price
high marked the top of the first leg of a cyclical bull market.
Across-the-board weakness in industrial-metals prices
Over the first 5 months of this year there were widely varying
performances among the base metals. For example, the first of the
following charts shows that zinc has been trending downward since February
while the second chart shows that nickel made a new high for the year as
recently as last month. However, over the past three weeks all the
high-profile base metals experienced sizable price declines.
Copper
and zinc have been the weakest base-metal markets since early-June.
Copper's recent weakness can be explained by the preceding rapid build-up
of speculative long positions, but we don't have an explanation for the
sell-off in the zinc market. Regardless of the reason behind it, the
recent downward acceleration of the zinc price means that we are dealing
with a larger-degree correction than originally envisaged.
In addition to the declines in base-metal prices, there recently has
been a plunge in the platinum price and a rolling-over of the iron-ore
price. It is therefore fair to say that there is currently
across-the-board weakness in the prices of industrial metals. This
weakness is most likely occurring within the context of an on-going
multi-year bullish trend, but it could be a warning sign that the
relatively slow G2 monetary inflation rate is starting to 'bite' and that
the coming few months will involve a shift away from growth-oriented
investments and speculations.
Soybean crash
The following daily chart of the Teucrium Soybean Fund (SOYB) shows
that there was a mini-crash in the soybean price from late-May through to
last Thursday and then a rebound on Friday. This crash was at least partly
a response to the China government's retaliation to tariffs imposed by the
US government.
The weakness in the soybean market seems to be overdone, because China
will not be consuming less soybeans due to the "trade war"; it will be
consuming less soybeans produced in the US and more soybeans produced
elsewhere. Therefore, the soybean price is probably close to a very
important low.
The Stock Market
Leverage continues to
expand
"Investor Credit" is calculated by subtracting
margin debt from the available spending power (cash plus unused credit) in
margin accounts. It is a measure of stock market leverage that tends to
reach a maximum negative value (indicating maximum leverage) PRIOR to
major peaks in the US stock market. For example, the negative value of
Investor Credit hit a cyclical high in February-2000, one month prior to a
major peak in the NASDAQ and six months prior to a major peak in the broad
market, and in June-2007, four months prior to a major peak in the S&P500.
The following chart shows that during the current cycle the expansion
of the negative credit balance in margin accounts has dwarfed anything
that happened in the past. It also shows that the negative credit balance
was still expanding as of May-2018 (the latest month for which data are
available).
It's a short-term positive for the stock market that
leverage was still expanding at the end of May, but the amount of leverage
now built into the market is a major long-term negative.
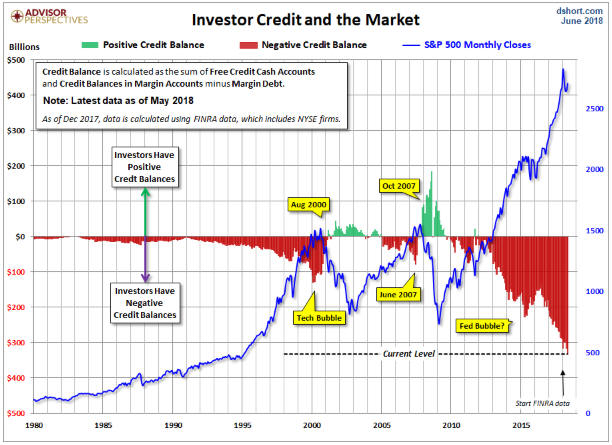
Chart source:
Advisor Perspectives
Current Market Situation
At the January-2018 stock market high, virtually all stock indices
were stretched to the upside. The entire market then began to decline,
which led to a rise in the Volatility Index (VIX) and a spectacular
blow-up of the 'short volatility' trade.
Currently, some US stock
indices are stretched to the upside while others look 'oversold'.
Consequently, if the stock market is close to another top, which it may
well be, it's a far more complex top than the one that occurred in
January. It's a top that's rife with divergences.
The set of four
daily charts displayed below is an example of the performance divergence
mentioned above. The first chart shows that since the January-2018 peak
the NASDAQ100 Index (NDX) has made two higher highs, with the most recent
high occurring in June. The June high was followed by what appears to be a
routine pullback to the 50-day MA, and a new all-time high is now in
reach. The second chart shows that the January-2018 peak for the
Russell2000 SmallCap Index (RUT) was followed by a 3-month consolidation
and then a very strong rally into new-high territory. As is the case with
the NDX, the RUT's June high was followed by what appears to be a routine
pullback to the 50-day MA, with another push into new-high territory now
on the cards. In contrast, the third chart shows that the Bank Index (BKX)
is consolidating near its low for the year. And the fourth chart shows
that although the Dow Transportation Average (TRAN) has begun to rebound
from an 'oversold' level, it has done serious technical damage by breaking
below the bottom of a 2.5-year channel.
The divergences are largely the result of the "trade war" started by
the Trump administration earlier this year. It seems that many 'investors'
are operating under the illusion that the dampening economic effect of
tariffs and quotas can be avoided by purchasing the extremely expensive
shares that populate the NDX and the RUT. It's likely that these investors
will experience a rude awakening within the next few months.
In
addition to the "trade war", there are many reasons to believe that the US
stock market's risk/reward is now bearish with regard to both the
short-term and the intermediate-term. These reasons include:
1.
Monetary conditions are tight by the standards of the past several years.
2. Credit spreads have begun to widen.
3. Bank stocks are
relatively weak.
4. Industrial commodities are breaking down.
5. The put/call ratio remains close to a sell signal, although it
isn't quite there yet.
6. China's currency is weakening.
7.
The Bitcoin price continues to trend downward.
8. Equity indices
are diverging as discussed above.
One positive is that market
internals are yet to signal a problem.
We suspect that both the NDX
and the RUT will soon make new all-time highs, but that the new highs in
these indices will be marginal and will not be confirmed by the rest of
the market. Therefore and as mentioned in last week's Interim Update, it
would be reasonable to start averaging into bearish stock market
speculations or stock market hedges via options or bear funds.
We
aren't going to make any specific suggestions today, although we may add
one or two index put options to the TSI List within the coming week.
This week's
significant US economic events
[Notes:
1) The most important events
(to the markets) are shown
in bold. 2) A list of global economic events can be found
HERE]
| Date | Description |
| Monday Jul-09 | Consumer Credit |
| Tuesday Jul-10 | No important events scheduled |
| Wednesday Jul-11 | PPI |
| Thursday Jul-12 |
CPI Treasury Budget |
| Friday Jul-13 | Consumer Sentiment |
Gold and the Dollar

Finally, the chart displayed below shows gold's performance relative
to the basket of industrial metals represented by GYX. Relative to GYX,
gold has just bounced after making a 7-year low.
Almost regardless
of how gold performs in US$ terms we expect that it will strengthen
relative to industrial metals over the coming 2-4 months. This is due to
the depressed level of the gold/GYX ratio and the recent shift in the
fundamental backdrop in gold's favour.
Silver
The silver price broke below support at
$16.10 early last week and traded as low as $15.80 before rebounding. The
rebound wasn't impressive, though, as it did no more than take the price
back to the breakout level.
A daily close above $16.30 would be a preliminary sign that the price
has turned upward on a sustainable basis, but to signal conclusively that
a meaningful rally is underway the market will have to end the pattern of
declining tops that is now almost 2 years old. To do so the silver price
will have to close above $17.30.
Gold Stocks
Just for a change, today we'll
focus on the Junior Gold Miners ETF (GDXJ).
The following daily
chart shows that GDXJ sprang to life last week, breaking above
moving-average resistance and trading at its highest level since the first
half of May.
The next daily chart covers a longer period and puts last week's
strength into perspective. It indicates that nothing significant happened
last week.
Since 2016, GDXJ's overarching pattern has entailed
declining tops, rising lows, and declining volatility. Furthermore, over
the past few months the ETF's price volatility has shrunk to the point
where additional shrinkage does not seem possible.
To indicate that the period of tedium has ended and that a move of
substance is underway, GDXJ will have to break the post-2016 pattern of
declining tops and rising lows. This means that it will have to close
above $36.08 or below $29.83. An upside breakout is more likely than a
downside breakout, but not decisively so at this time.
From a
bull's perspective, the ideal price action over the days ahead would
involve a 1-2 day consolidation followed by a daily close above Friday's
high ($33.65).
The Currency Market
The
Dollar Index (DX) dropped to its 50-day MA last Friday and then bounced.
This has possibly set the stage for some minor strength during the next
couple of days, but the following excerpt from last week's Interim Update
is still applicable:
"Regardless of whether we are dealing with a
DX bull or bear market, a pullback to near the 200-day MA (around 92) is
likely within the next 1-2 months. This would coincide with the euro
rising to around 1.20."
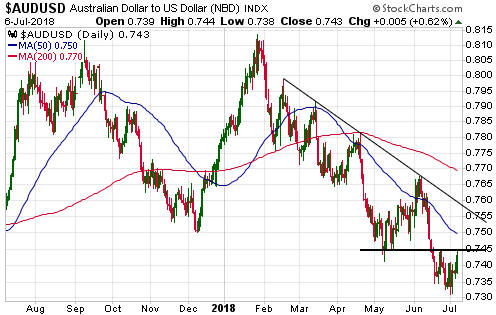
The Australian dollar has rebounded to resistance defined by its May
low (0.745). There is more resistance at 0.75, but the most important
nearby resistance may be defined by the trend-line that connects the highs
of the past 5 months. This trend-line capped the May-June rebound and
currently is at 0.755-0.760.
Of the major currencies, the Swiss franc (SF) has the most bullish COT
situation.
The historical record suggests that the SF could make a
new low for the year before commencing a sizable advance. However, the
historical record also suggests that regardless of whether or not there is
an intervening decline to a new low for the year, the SF will be
significantly higher two months from now.
Updates
on Stock Selections
Notes: 1) To review the complete list of current TSI stock selections, logon at
http://www.speculative-investor.com/new/market_logon.asp
and then click on "Stock Selections" in the menu. When at the Stock
Selections page, click on a stock's symbol to bring-up an archive of
our comments on the stock in question. 2) The Small Stock Watch List is
located at http://www.speculative-investor.com/new/smallstockwatch.html
![]() Company
news/developments for the week ending Friday 6th July 2018:
Company
news/developments for the week ending Friday 6th July 2018:
[Note: AISC = All-In Sustaining Cost, FS = Feasibility Study, FY =
Financial Year, IRR = Internal Rate of Return, ISR = In-Situ Recovery,
MD&A = Management Discussion and Analysis, M&I = Measured and Indicated,
NAV = Net Asset Value, NPV(X%) = Net Present Value using a discount rate
of X%, NSR = Net Smelter Return, P&P = Proven and Probable, PEA =
Preliminary Economic Assessment, PFS = Pre-Feasibility Study]
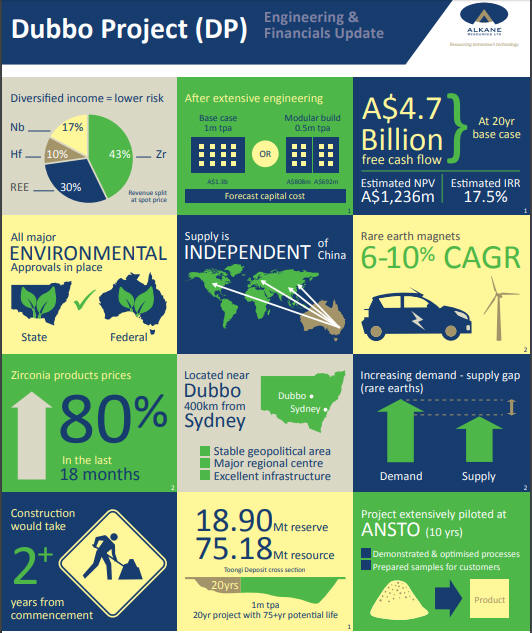
*Alkane Resources (ALK.AX) distributed an infographic
highlighting some of the important aspects of its Dubbo specialty metals
project. We thought that the graphic was a useful summary and include it
below without further comment.
*Alio Gold (ALO) took responsibility for a
$15M project loan from Macquarie Bank when it acquired Rye Patch Gold
(RPM). At the time of the RPM acquisition it was envisaged that repayment
of the loan would be renegotiated to occur via 12 quarterly instalments.
It was announced last week that what was expected has come to pass and the
loan will be repaid via 12 quarterly instalments of $1.25M beginning in
September of this year. This is positive, although, as we said, it was
expected.
*Clean TeQ (CLQ.AX, CLQ.TO)
advised that Robert Friedland, its co-chairman, has increased his stake in
the company to 12.91% through the on-market acquisition of 1,385,830
shares at a price of approximately A$0.92 per share. This is positive.
*Resolute Mining (RSG.AX) was added to the TSI
list last November as a short-to-intermediate-term trading position. This
is part of what we wrote about RSG at that time:
"RSG's most
important assets are the Syama gold mine in Mali (West Africa) and the
Ravenswood gold mine in Queensland, Australia. Syama is currently
producing gold at the rate of 220K-ounces/year and Ravenswood is currently
producing gold at the rate of 80K-ounces/year, but in-progress development
plans are expected to increase the production rates to 240K-ounces/year
and 120K-ounces/year, respectively. RSG also owns the Bibiani gold project
in Ghana. It is expected that Bibiani will be brought into production
within the next year or so and will produce gold at the rate of 100K
ounces/year over an initial 5-year life.
With 741M shares
outstanding and estimated net cash of A$187M, at the current share price
(A$1.025) RSG has an enterprise value of A$573M (US$435M). This is low for
a profitable gold miner with 300K-ounces/year of current production (at an
AISC of US$960/oz), a 12-13 year mine life at its two most important
assets, and built-in growth to a production rate of 460K-ounces/year over
the coming two years. The current valuation suggests the potential for at
least a 50% increase in the stock price with no increase in the gold
price, although it's likely that an upward-trending gold price will be
required to push the share price up to the A$1.50-$2.00 range that we have
in mind as a target for this trade."
Since RSG was added to
the List its stock price has gained 40% in a flat gold market. Due to this
price gain and the company having invested some of its cash, we estimate
that RSG's enterprise value is now about 54% higher at US$670M.
We
think that RSG is now fairly valued based on the current gold price and
the company's current production. However, we also think that RSG's stock
price stands a good chance of rising to near A$2.00 within the next 6
months in response to a higher gold price and the discounting by the
market of growth in the company's production and profitability.
![]() List
of candidates for new buying
List
of candidates for new buying
From within the ranks of TSI
stock selections the best candidates for new buying at this time, listed
in alphabetical order, are:
1) AAU (last Friday's closing price:
US$0.72)
2) CNL.TO (last Friday's closing price: C$3.84)
3)
KBLT.V (last Friday's closing price: C$8.82)
4) PG.TO (last
Friday's closing price: C$2.76)
5) SBB.TO (last Friday's closing
price: C$1.63)
The above list is limited to five stocks. It will
sometimes contain less than five, but it will never contain more than five
regardless of how many stocks are attractively priced for new buying.
Chart Sources
Charts appearing in today's commentary
are courtesy of:
http://stockcharts.com/index.html
http://www.kitco.com/