|
-- Weekly Market Update for the Week Commencing 10th March 2008
Big Picture
View
Here is a summary of our big picture
view of the markets. Note that our short-term views may differ from our
big picture view.
Bonds commenced a secular BEAR market in
June of 2003. (Last
update: 22 August 2005)
The stock market, as represented by the S&P500 Index, commenced
a secular BEAR market during the first quarter of 2000, where "secular
bear market" is defined as a long-term downward trend in valuations
(P/E ratios, etc.) and gold-denominated prices. This secular trend will bottom sometime between 2014 and 2020. (Last update: 22 October 2007)
The Dollar commenced a secular BEAR market during the final quarter of 2000. The
first major downward leg in this bear market ended during the first
quarter of 2005, but a long-term bottom won't occur until 2008-2010. (Last update: 28 March 2005)
Gold commenced a
secular bull market relative to all fiat currencies, the CRB Index,
bonds and most stock market indices during 1999-2001. This secular trend will peak sometime between 2014 and 2020. (Last update: 22 October 2007)
Commodities, as
represented
by the CRB Index, commenced a secular BULL market in 2001. The first
major upward leg in this bull market ended during the second quarter of
2006, but a long-term
peak won't occur until at least 2008-2010. (Last update: 08 January 2007)
Copyright
Reminder
The commentaries that appear at TSI
may not be distributed, in full or in part, without our written permission.
In particular, please note that the posting of extracts from TSI commentaries
at other web sites or providing links to TSI commentaries at other web
sites (for example, at discussion boards) without our written permission
is prohibited.
We reserve the right to immediately
terminate the subscription of any TSI subscriber who distributes the TSI
commentaries without our written permission.
Outlook Summary
Market
|
Short-Term
(0-3 month)
|
Intermediate-Term
(3-12 month)
|
Long-Term
(1-5 Year)
|
Gold
|
Neutral
(04-Feb-08)
|
Bullish
(12-Nov-07)
|
Bullish
|
US$ (Dollar Index)
|
Bullish
(10-Mar-08)
| Bullish
(31-May-04)
|
Neutral
(19-Sep-07)
|
Bonds (US T-Bond)
|
Neutral
(03-Mar-08)
|
Bearish
(23-Jan-08)
|
Bearish
|
Stock Market (S&P500)
|
Neutral
(02-Jan-08)
|
Neutral
(26-Mar-07)
|
Bearish
|
Gold Stocks (HUI)
|
Neutral
(04-Feb-08)
|
Bullish
(14-Jan-08)
|
Bullish
|
| Oil | Bearish
(14-Jan-08)
| Bearish
(22-Oct-07)
| Bullish
|
Industrial Metals (GYX)
| Neutral
(28-Nov-07)
| Bearish
(09-Jul-07)
| Bullish
|
Notes:
1. In those cases where we have been able to identify the commentary in
which the most recent outlook change occurred we've put the date of the
commentary below the current outlook.
2. "Neutral", in the above table, means that we either don't have a
firm opinion or that we think risk and reward are roughly in balance with respect to the timeframe in question.
3. Long-term views are determined almost completely by fundamentals,
intermediate-term views by giving an approximately equal weighting to
fundmental and technical factors, and short-term views almost
completely by technicals.
What's gold worth?
Gold doesn't have any
intrinsic value. Rather, the value of gold, like the value of most
things, is subjective (it's in the eye of the beholder). For example,
if you are stranded on an island by yourself with no hope of ever being
rescued then gold will probably have no value to you whatsoever;
however, if you are living in a city and are concerned that the
government is systematically destroying the purchasing power of your
country's money then you will probably assign a high value to gold.
Although it is not possible to determine an objective value for gold,
by looking at how the metal has performed relative to other things
throughout history we can make some reasonable assumptions about its
future performance. For example, previous long-term bull markets in
gold have never ended until after the Dow/gold ratio has dropped below
5, so it is probably reasonable to assume that gold will trade at more
than one-fifth the price of the Dow before the current gold bull market
comes to an end.
Another way of quantifying gold's potential upside is to review the
monetary metal's performance relative to the supply of US dollars.
Along these lines we include, herewith, a chart of the gold/M2 ratio
(the US$ gold price divided by M2 money supply, with M2 expressed in
billions of US dollars).
Our chart makes the point that there tend to be long periods when gold
lags money-supply growth (inflation). It then catches up to where it
should be based on the growth in the supply of money that has occurred
over preceding decades. And finally, due to widespread
fear/anticipation of further rapid inflation, it moves way above the
price that would be justified solely by changes in the money supply.
Interestingly, relative to M2 the 1971 bottom for gold was roughly the same as the 2001 bottom.
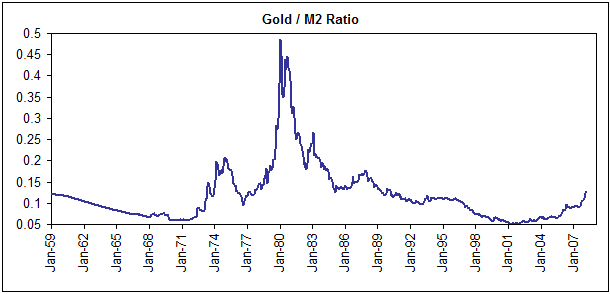
Gold's first
multi-year rally during the 1970s took the gold/M2 ratio up to around
0.2 and our thinking is that this first rally was primarily about
getting the gold price to where it 'should' have been based on
money-supply considerations alone. In other words, we suspect that
multiplying M2 by 0.2 is another way of arriving at a minimum upside
objective for gold's long-term bull market.
M2 is presently $7630B, giving us a minimum long-term upside objective
of around $1500 for gold assuming a static M2. A more realistic
assumption is that M2 will at least double over the coming 10 years,
leading to a minimum expectation of $3000/oz for the US$ gold price.
Of course, gold will likely garner a substantial speculative
(fear-related) premium towards the end of the current bull market.
During the 1970s this speculative premium took the price more than 100%
above the level that would have been justified by changes in the money
supply.
The Stock
Market
Current Market Situation
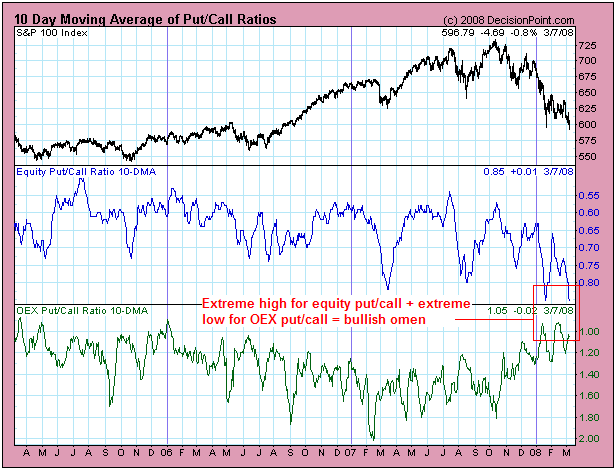
...the January panic pointed to a re-test within three months and the re-test is currently in progress.
The 10-day moving average of the equity put/call ratio has only been
higher than its present level on three occasions over the past 10 years
-- September-2001 (at the finale of the 9/11-related panic),
September-2002 (within three weeks of the 2000-2002 bear market's
ultimate low), and February-2003 (within three weeks of the successful
test of the October-2002 low). Furthermore, the current extreme high in
the 10-day MA of the equity put/call ratio is accompanied by a
relatively low reading in the 10-day MA of the OEX put/call ratio,
which suggests that the public is now very fearful while professional
money managers are relatively complacent. The situation is illustrated
by the following chart (note that put/call highs appear as lows on the
chart due to the inverted scale).
The historical record of the put/call ratio suggests that the US stock
market is close to an important low in terms of time, but doesn't
preclude an additional sharp price decline over the coming few weeks.
The message of other sentiment indicators is similar.
Our view over the
past several weeks has been that the January low would, for all intents
and purposes, prove to be the low for the first half of 2008 even if a
cyclical bear market had begun (we think that a cyclical bear market
commenced last year), but that this low would very likely be tested
before a multi-month rebound got underway. The market is currently in
the process of testing its low for the year and could spike to new lows
as part of this process, but it shouldn't make a sustained move under
the January low. The ideal bullish set-up would involve a drop to new
lows, followed quickly by an upward reversal.
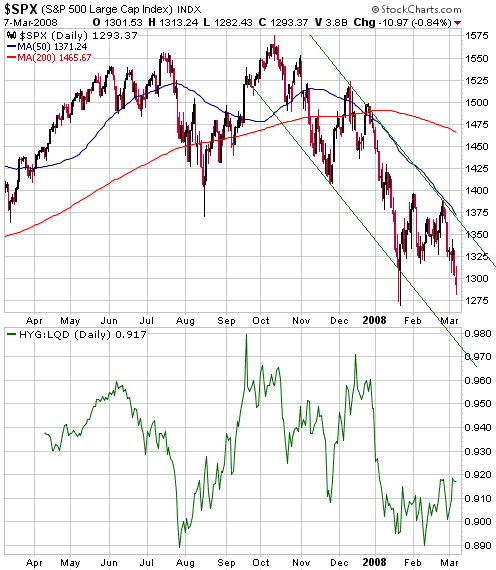
One thing lacking at this time is price-related evidence that a low is
in place. The following chart, for example, shows that the S&P500
Index reversed lower from the vicinity of its channel top late last
month and has since dropped back to near the middle of this channel. It
is near support defined by its January low, but is still about 60
points (5%) above its channel bottom. We think the channel bottom
defines the immediate downside risk.
The following chart also shows the HYG/LQD ratio, which is, in effect,
a credit spread whereby a rising ratio reflects a contraction in
corporate credit spreads (bullish). There is potentially a positive
divergence in the works in that last week's decline in the S&P500
was not confirmed by HYG/LQD, with "potentially" being the operative
word at this stage.
To summarise, the
January panic pointed to a re-test within three months and the re-test
is currently in progress. We think there's a risk of a brief spike to
new lows as part of the testing process, but we do not think that
there's a significant risk of a new downward leg getting underway at
this time.
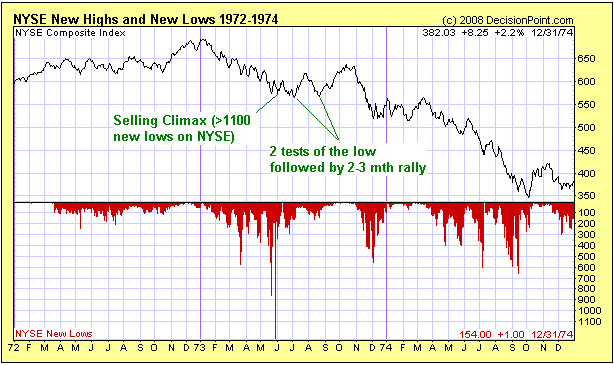
The "1973 Model", which we are applying in our analysis of the gold
sector, could also have relevance to the broad stock market. We have
therefore presented, below, a decisionpoint.com chart showing the US
stock market's performance during 1972-1974 (the top section of the
chart shows the NYSE Composite Index and the bottom section shows the
number of NYSE stocks making new lows).
Our thinking is that the May-1973 day on which there were more than
1100 new lows could be akin to 22nd January-2008 -- a day on which, for
only the fifth time in the past 40 years, there were also 1100+ new
lows. If we take the "1973 Model" literally then the current test of
the January low will be followed by a short rally and a second test of
the low next month, but the main point is that the May-1973 panic low
-- the equivalent of the 22nd January low -- was not decisively
breached for more than 5 months, even though a major bear market was in
progress.
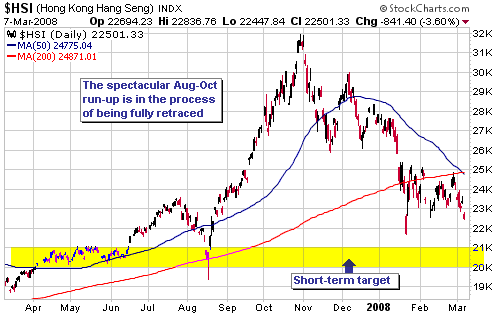
Hong Kong
With reference to the following chart, the rally in Hong Kong's Hang
Seng Index (HSI) during August-October of last year was truly
extraordinary. In fact, it was the fastest 50% rise in a major
developed-world stock index that we can recall ever seeing. Hong Kong's
long-term equity bull market probably remains intact, but this hasn't
prevented the HSI from doing what most markets do following
breathtaking run-ups -- retrace the bulk of its near-vertical ascent.
We are featuring the HSI in today's report because we think it has
reached the point where its intermediate-term upside potential
outweighs its downside risk. The ideal time to buy exposure to the Hong
Kong market -- via EWH in the US -- would be when the HSI trades in the
20000-21000 range, but there is no guarantee it will get that low so
investors could START averaging in immediately.
By the way, it is reasonable to expect that the grain markets will go
the way of the HSI once their parabolic up-moves come to an end.
This week's
important US economic events
| Date |
Description |
Monday Mar 10
| No important events scheduled
|
| Tuesday Mar 11 | Trade Balance
| | Wednesday Mar 12
| No important events scheduled
| | Thursday Mar 13
| Import / Export Prices
Retail Sales
| | Friday Mar 14
| CPI
|
Gold and
the Dollar
The US$
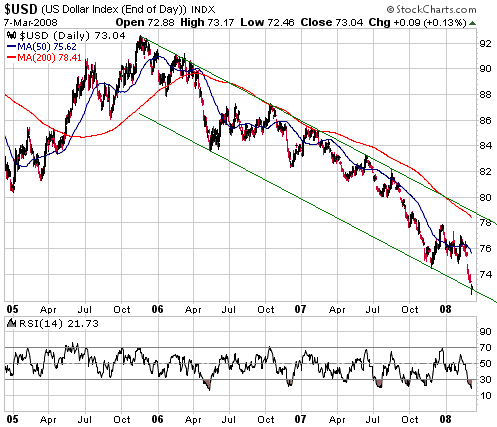
Current Market Situation and Risk/Reward Discussion
...the 'oversold' extreme registered at the end of last week suggests that the short-term risk/reward is skewed toward reward.
A market's reaction to news is only really interesting to us when the
market does the opposite of what conventional wisdom suggests it should
do in response to the news. For example, if the Dollar Index had sold
off in reaction to Friday's dismal US employment data and retained most
of its losses through to the close it would have simply meant that
nothing had changed; but the fact that the Dollar Index sold off in
reaction to the bearish news and then recouped all its losses is
potentially a sign that the trend is changing. This price action
combined with the Dollar Index's position within its well-defined
channel (see chart below) has prompted us to return our short-term US$
outlook to "bullish".
Does this mean we think the Dollar Index has bottomed?
In a word: no. In real time we never know, and never claim to know,
when a market we follow is at a top or a bottom (it will only ever be
possible to confidently identify a market top or bottom some time after
-- usually at least several weeks after -- the event). Instead, we base
our outlooks, including our current short-term bullish outlook on the
US$, on an assessment of risk versus reward.
By way of further explanation, the words "bullish" and "bearish" have
no meaning to us except as ways of describing how we view the
probability and expected magnitude of a market's upside relative to the
probability and expected magnitude of its downside. For example, if we
think a market has a 70% chance of rising 5% and a 30% chance of
falling 20% over the timeframe in question, then we will either be
"bearish" or "neutral" on that market even though we think the odds
favour a rise. The reason is the magnitude of the perceived downside
risk. If you place bets where the risk-reward equation is the same as
in our hypothetical example then you should expect to win 70% of the
time, but your expected outcome over a large number of such bets will
be a loss of 2.5% (0.70*5% + 0.30*(-20%)). In this hypothetical
situation it may be possible for you to manufacture a favourable
expected outcome by using some sort of risk management strategy, such
as a protective stop, but this is beside the point. When we describe
our outlook as being "bullish" or "bearish" we are not presenting a
specific trading recommendation; we are simply expressing an opinion.
The difference between a trading recommendation and an opinion was
discussed in the 24th September 2007 Weekly Update under the heading
"Opinions, Facts, Trading and Investing", and was exemplified by the
recommendation in our 13th and 18th February commentaries that traders
go 'long' GDX (the Gold Miners ETF). At that time our short-term
gold-stock outlook was "neutral", but we thought it made sense to buy
this gold mining ETF for a trade at around $47.70 because downside risk
could effectively be limited to around 5% by placing a sell stop just
below support defined by the early-February low. Our thinking was that
either support would quickly give way, signaling additional downside
and taking a trader out of their position with a small loss, or a rally
yielding a double-digit percentage gain would soon begin. As it turned
out a rally soon began, so the trading idea worked well.
Getting back to the US$, the 'oversold' extreme registered at the end
of last week suggests that the short-term risk/reward is skewed toward
reward. Even a counter-trend rebound back to the channel top over the
coming 1-2 months would result in a meaningful gain of around 7%,
although if we thought that 7% represented the maximum upside potential
we wouldn't be bullish because the short-term downside risk is probably
around 5%. We are bullish because we think the dollar's upside
potential is around 20%.
This doesn't, however, mean that we would buy the Dollar Index for a
short-term trade. In our opinion the odds are in favour of the US$
out-performing the euro over the coming 3 months and over the coming 12
months, so if our only options at this time were to be 'long' the euro
or 'long' the US$ then we would choose the US$. Fortunately, though,
these aren't our only options.
We think the best position at this time is to have NO large bets that
require the financial world to do anything in particular in the
short-term, and to be heavily exposed, on an INTERMEDIATE-TERM basis,
to gold-related investments/speculations. Gold is an
anti-official-currency play more than an anti-US$ play and therefore
stands to benefit from problems in either, or both, of the senior
currencies.
Why is the US$ so weak?
The downward pressure on the dollar stems from what's happening on the
interest rate front, which is, in turn, a ramification of the on-going
debt/credit crisis. Short-term US interest rates have recently gone
into freefall, causing the Fed to fall much further behind the market.
The US central bank now finds itself in the position where it must
slash its Funds Rate target yet again in order to catch up with what
the market has already done. The market, of course, knows this, and has
discounted a fall in the Fed Funds rate from its current level of 3% to
below 2% over the coming three months, with 75 basis points of this
decline expected to occur at the 18th March FOMC Meeting.
But in its efforts to perpetuate inflation the Fed is currently doing,
and will continue to do, more than simply reduce the Fed Funds rate
target. For example, via the Term Auction Facility (TAF) that came into
being last December, an expansion of which was announced on Friday, and
via a new method of conducting its "repo" operations, also announced on
Friday, the Fed is helping US banks by taking relatively illiquid
securities off the banks' balance sheets and replacing them with highly
liquid US Treasuries. A well-written review of the Fed's recent actions
can be found at http://interfluidity.powerblogs.com/posts/1204920896.shtml.
The current interest rate situation and Fed actions are certainly
'dollar bearish' fundamentals, but they are fundamentals that are well
known; and "well known" means fully (or almost fully) discounted in the
current price.
What the market does not appear to have come remotely close to
discounting are the problems within the European Monetary Union, one of
which is discussed HERE. It seems that most traders are fixating on the US dollar's negatives whilst turning a blind eye to the euro's negatives.
Gold
Below is a daily chart of April gold futures.
The gold market is 'overbought', but unlike some other commodities it
has not yet experienced an 'upside blow-off'. As a result, any downward
correction that begins from near the current price has a good chance of
being the routine short-term variety (a downward move within the
context of an on-going intermediate-term advance). A routine short-term
correction beginning from near the current price is one of the two most
likely outcomes. The other is that gold's rally will soon enter
'blow-off mode', leading to a peak of intermediate-term significance
within the coming several weeks.
For an upside blow-off to remain a likely near-term prospect the gold
price should not close below last week's low and must not close below
support defined by the January high.
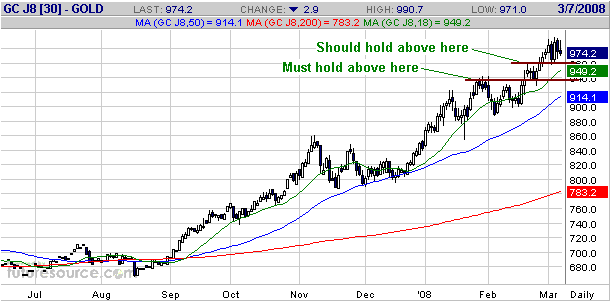
If the gold market
does experience an 'upside blow-off' over the coming several weeks it
will probably be because we have under-estimated the dollar's
short-term downside risk, although a moon-shot in the price of the
monetary metal could also be driven by more widespread recognition of
the euro's problems.
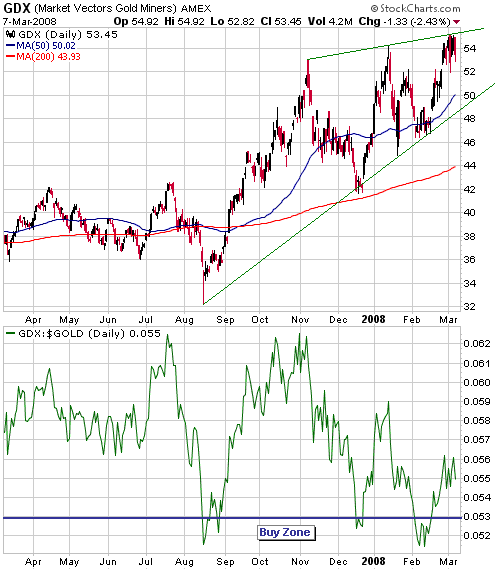
Gold Stocks
Below is a chart showing GDX (the Gold Miners ETF) and the GDX/gold
ratio. Short-term traders who are 'long' GDX should, we think, raise
their sell stops to around $51.50.
As we've shown on the chart, the price pattern over the past several
months could be interpreted as a "rising wedge". Such patterns are
widely considered to be bearish, but based on our experience a "rising
wedge" is just as likely to end in an upside breakout as in a downside
breakout.
We have no opinion on whether GDX is more likely to break upward from
its 'wedge pattern' in the near future and surge to an April-May
intermediate-term peak, or 'correct' for about two months before
resuming is intermediate-term advance. Hence, our short-term neutral
view on the major gold stocks.
We are, however, unequivocally bullish on the junior end of the gold
sector over every timeframe. If the majors and the mid-tiers pull back
over the coming two months then the juniors will certainly follow suit,
but at the junior end of the market the downside risk is low RELATIVE
TO the potential rewards (due to the immensity of the potential
rewards). Many juniors are very under-valued and, as noted in last
week's Interim Update, immersed in lengthy consolidation patterns that
should act as launching pads for quick and substantial gains once
upside breakouts occur.
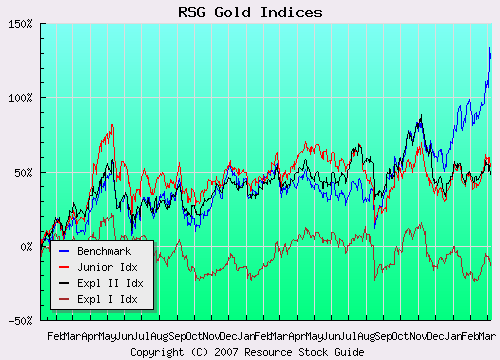
The following chart from the Resource Stock Guide web site
is interesting. It compares the performance of a group of
high-performing mid-tier gold stocks (the "Benchmark Index", shown in
blue) with the performances of junior producers, 2nd-stage explorers
(exploration-stage gold miners with proven resources) and 1st-stage
explorers (exploration-stage gold miners that don't yet have any proven
resources), and illustrates what we know from experience -- that the
small-cap gold stocks have been relatively poor performers over the
past few months. It is partly this recent relative weakness that
creates the additional upside potential amongst the small-caps.
Note that our primary focus is on the junior producers and the
2nd-stage explorers. Once in a while we will make an exception, but we
generally aren't interested in companies that don't yet have proven
in-ground resources.
Update
on Stock Selections
(Note: To review the complete list of current TSI stock selections, logon at http://www.speculative-investor.com/new/market_logon.asp
and then click on "Stock Selections" in the menu. When at the Stock
Selections page, click on a stock's symbol to bring-up an archive of our comments on the stock in question)
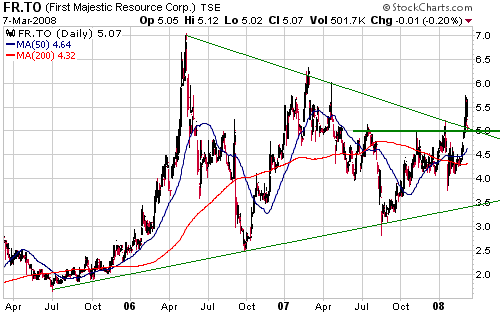
 First Majestic Silver (TSX: FR). Shares: 63M issued, 77M fully diluted. Recent price: C$5.07 First Majestic Silver (TSX: FR). Shares: 63M issued, 77M fully diluted. Recent price: C$5.07
FR announced a sizeable equity financing after the close of trading
last Wednesday, which had the effect of pushing the share price down
from the C$5.60s to support in the low C$5 area.
The timing of this new issue of shares was bad in that the stock had
only just broken out to the upside from a lengthy consolidation and
appeared to be building some upward momentum. However, the bad news for
those of us who already have full positions in the stock is good news
for those looking for opportunities to buy.
FR offers substantial leverage to the silver price, and due to its 4.5M
ounces/year of current production is not as risky as most juniors with
similar market caps. It is suitable for new buying near the current
price.
Chart Sources
Charts appearing in today's commentary
are courtesy of:
http://stockcharts.com/index.html
http://www.futuresource.com/
http://www.decisionpoint.com/

|