![]()
![]()
![]()
![]()
-- Weekly Market Update for the Week Commencing 10th August 2015
Big Picture
View
Here is a summary of our big picture
view of the markets. Note that our short-term views may differ from our
big picture view.
The BULL market in US Treasury Bonds that began in the early 1980s ended in early-2015, but there will be many years of topping action in bond prices and bottoming action in bond yields before major new trends get underway. (Last update: 29 June 2015)
The stock market, as represented by the S&P500 Index, commenced a secular BEAR market during the first quarter of 2000, where "secular bear market" is defined as a long-term downward trend in valuations (P/E ratios, etc.) and gold-denominated prices. This secular trend will bottom sometime between 2018 and 2020. (Last update: 29 June 2015)
A secular BEAR market in the US Dollar began during the final quarter of 2000 and ended in July of 2008. This secular bear market will be followed by a multi-year period of range trading. (Last update: 09 February 2009)
Gold commenced a secular bull market relative to all fiat currencies, the CRB Index, bonds and most stock market indices during 1999-2001. This secular trend will peak sometime between 2018 and 2020. (Last update: 29 June 2015)
Commodities,
as represented by the CRB Index, commenced a
secular BULL market in 2001 in nominal dollar terms. The first major
upward leg in this bull market ended during the first half of 2008, but
a long-term peak won't occur until 2018-2020.
(Last
update: 29 June 2015)
Copyright
Reminder
The commentaries that appear at TSI
may not be distributed, in full or in part, without our written permission.
In particular, please note that the posting of extracts from TSI commentaries
at other web sites or providing links to TSI commentaries at other web
sites (for example, at discussion boards) without our written permission
is prohibited.
We reserve the right to immediately
terminate the subscription of any TSI subscriber who distributes the TSI
commentaries without our written permission.
Outlook Summary
|
Market |
Short-Term (1-3 month) |
Intermediate-Term (6-18 month) |
Long-Term (2-5 Year) |
| Gold | N/A |
Bullish (26-Mar-12) |
Bullish |
| US$ (Dollar Index) | N/A |
Neutral (22-Jun-15) |
Neutral (19-Sep-07) |
| US Treasury Bonds (TLT) | N/A |
Neutral (18-Jan-12) |
Bearish |
| Stock Market (DJW) | N/A |
Bearish (28-Nov-11) |
Bearish |
| Gold Stocks (HUI) | N/A |
Bullish (23-Jun-10) |
Bullish |
| Oil | N/A |
Bullish (17-Dec-14) |
Bullish |
| Industrial Metals (GYX) | N/A |
Bullish (22-Jun-15) |
Bullish (28-Apr-14) |
4. Long-term views are determined almost completely by fundamentals and intermediate-term views
are determined by a combination of fundamentals, sentiment and technicals.
Last week's posts at the TSI Blog
Is the Fed privately owned? Does it matter?
The gold supply-demand nonsense is relentless
The amazing inability to see the Fed�s money creation
Can the US economy survive more of the Fed�s monetary support?
Commodities
Overview
An across-the-board sell-off in commodities began around the middle of last
year. For a while it looked like a sustainable bottom might have been put in
place during the first quarter of this year, but the selling pressure ramped up
in May and the prices of many commodities have made new bear-market lows over
the past three weeks. Is the bear market now almost over?
We can't answer that question other than to say it could be, but there is no
bottom-indicating evidence at this time apart from a rarely-seen 'oversold'
extreme. Our guess is that a strong rebound will soon begin, but with the EEM/SPY
ratio having not yet turned higher it's likely that the Q3-2015 price lows will
have to be tested prior to the start of a new cyclical bull market.
Before we discuss the situations of some individual commodities there are two
points we want to get across, the first being that the plunge in commodity
prices has nothing to do with deflation in the US (or anywhere else, for that
matter). Apart from the facts that the US money supply is still growing at 7%-8%
per year, economy-wide credit is still expanding, commercial bank credit is up
by 7.5% over the past 12 months, the median house price is in a multi-year
upward trend, junk bonds are still at high valuations by historical standards
and the cost of living is obviously still rising, we cite the performance of the
US stock market. An over-valued stock market would be acutely vulnerable to
deflation, but the US stock market has chopped back and forth over the past five
months near its all-time price and valuation high.
Inflation and deflation are, by definition, economy-wide outcomes. This means
that assertions to the effect that there is deflation in some parts of the
economy and inflation in other parts of the economy are always nonsense.
However, individual sectors can experience booms and busts at different times.
What we have seen in the commodity markets over the past year is the bust that
inevitably follows an inflation-fueled boom. More specifically, capacity was
expanded in response to monetary-inflation-generated price signals that tricked
commodity producers into believing that future demand would be much greater than
it was ever going to be.
Now, it is clear that the central bank's manipulation of money and interest
rates has falsified prices throughout the economy, causing mal-investment to
extend well beyond the commodity production/distribution industries. As a
result, it is certainly possible that deflation could occur in the future. The
thing is, when a bust affects the commodity world it is not usually viewed by
central bankers as a problem that requires a monetary response, but it's a very
different story when a bust affects the banking industry and the stock market.
The reality is that another bout of aggressive monetary inflation is likely to
accompany the first obvious signs that deflation is becoming something more than
a longshot, eliminating any genuine deflation threat soon after it emerges.
The other point we want to make before delving into the situations of some
individual commodities is that commodity fundamentals always look great near the
ends of bull markets and terrible near the ends of bear markets. Think back to
how bright the fundamental outlook for commodity producers appeared to be in
late-2010 and early-2011. Consequently, the fact that many commodity-producing
industries are now wallowing in over-capacity does not mean that a major price
bottom is not close at hand. The fundamentals always appear to be lousy at major
price bottoms. The question is: have prices already fallen far enough to fully
discount the lousy fundamentals?
Oil
In early May, soon after the end of a multi-week rebound in the oil price, we
wrote that one of two short-term scenarios was likely. The first was a pullback
to test the March low prior to the start of an intermediate-term rally. The
second was several weeks of sideways consolidation and then the resumption of
the upward trend that began in March. We thought the first scenario had the
higher probability, but the market made the situation as confusing as possible
by first trading sideways for a few weeks and then pulling back to the vicinity
of its March low.
A test of the March low is currently underway. If the test is successful then
oil will have bottomed in 2015 in a similar fashion to how it bottomed in 1986.
There is, of course, no guarantee that the test will be successful. If the oil
price holds above its March low on a weekly closing basis and then manages to
close a week above its 10-week MA, it will indicate that the test was successful
and that oil's bottoming process is complete.
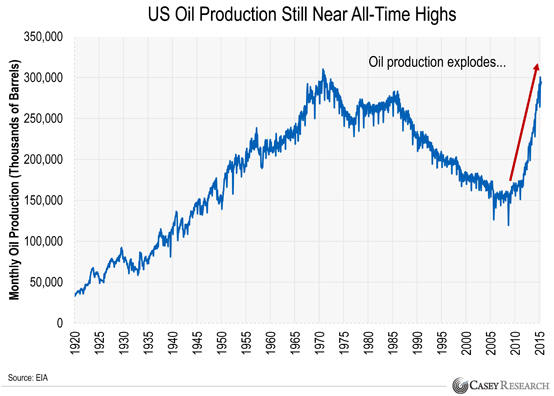
Oil's supply-demand fundamentals are obviously still bearish, partly thanks to
the continuing elevated production from the US shale-oil industry. In
particular, the following chart from a
Casey Research Dispatch shows that US oil production rose sharply over the
past five years from a 60-year low to near an all-time high and hasn't yet
reacted to the lower price. However, as we noted in the above "Overview", the
salient question is whether the price has already fully discounted the bearish
fundamentals, because we can be sure that the price will bottom in parallel with
bearish fundamentals.
Based on articles we've read in the recent past (such as the one posted
HERE), another point worth making (re-making, actually) is that the price of
a commodity futures contract does NOT represent the market's expectation about
where the commodity price will be at the time of contract expiry. For example,
if the price of the December-2016 oil futures contract is $65 it does not imply
that the market expects the price of oil to be $65 in December-2016. Futures
prices are based on CURRENT supply/demand (the urgency of buyers relative to the
urgency of sellers in the cash market) and arbitrage, taking into account the
cost of financing and the cost of storage. That, in a nutshell, is why a decline
in futures prices relative to the spot price is not a bearish sign.
Finally, the happenings of the past few years prove that the level of oil
production is limited more by price than geology. That is, contrary to the
beliefs of some "Peak Oil" alarmists, a large and sustained rise in the oil
price did what large and sustained rises in commodity prices have always done:
caused a large increase in supply.
Iron Ore
Other than checking its price about once per week and reading the occasional
iron-ore-related article, we don't follow the iron-ore market. We are only
mentioning it in today's report because a) its performance over the past 10
years is another classic example of the boom-bust cycle caused by monetary
inflation and interest-rate manipulation, b) it is being held up as the poster
child for everything that's wrong with the commodity-production industry and an
example of what can be expected (on the downside) from other industrial metals
over the months ahead, and c) there are tentative signs in the price action that
it has bottomed.
As illustrated by the following chart, the iron-ore price made a bottom in
early-April, rebounded for about two months and then dropped back to its April
low. It made a marginal new low in early-July, but instead of signaling the
resumption of the bear market the early-July downside breakout was quickly
negated by a sharp rebound.
Failed downside breakouts are reliable bullish signals. At least, they are more
reliably-bullish than upside breakouts. We therefore have tentative evidence
that a 'double bottom' is in place in the iron-ore market. A weekly close above
the early-June rebound peak would shift the evidence from tentative to
definitive.
Copper
Over the past two years the Commitments of Traders (COT) report has been by far
the most useful indicator of copper's likely short-term price performance. Most
recently, in early-May of this year the shift in the speculative position in
COMEX copper futures from net-short to net-long (as indicated by the COT data)
suggested that a short-term top was being put in place in the US$2.90s. We
guessed at the time that a decline to the vicinity of the January low ($2.40)
would happen over the ensuing two months.
The copper price ended up dropping below its January low, but until last week
the COT situation wasn't suggestive of a short-term price bottom. The reason is
that prior to last week the net positions of speculators and commercials hadn't
moved to levels that had been reached at or prior to every previous short-term
bottom over the preceding two years. More specifically, over the past two years
the copper price hasn't reached a short-term bottom until the net-short and the
net-long positions of speculators and commercials moved to the boundaries of the
rectangle drawn on the following chart.
As of the latest report, the COT numbers are now consistent with a short-term
price bottom for the copper market. The caveat is that there was a multi-week
overshoot in December-January that could also occur this time around.
On a longer-term basis copper looks expensive relative to other industrial
commodities, so at this stage we aren't anticipating a major rally -- just
another 2-4 month rebound.
Natural Gas
Natural gas completed its boom and its ensuing bust earlier than most other
commodities. Its bust probably ended during the first half of 2012 and it is
showing signs of having completed a secondary (higher) bottom during the first
half of this year. However, it needs to achieve a weekly close above US$3.10
(the May rebound peak) to confirm that a secondary bottom is, indeed, in place
and that a tradable rally is underway.
From a seasonal perspective, the period between now and early-September is the
most likely time for the start of a rally.
International Ocean-Going Freight Rates
The boom and bust in commodity prices led to a boom and bust in international
shipping rates as represented by the Baltic Dry Index (BDI). As commodity
producers were ramping up supply in response to false signals regarding the
level of future demand, the companies that build and operate the ships that
transport commodities between countries were doing the same. There was a huge
increase in shipping capacity, leading to a major decline in BDI.
Because the BDI's massive decline from a high of about 11800 in early-2008 to a
bottom of around 500 early this year -- a peak to trough decline of more than
95% -- was clearly related far more to shipping supply than the volume of global
trade, we stopped using the BDI as an economic indicator several years ago.
However, the following chart shows that there is a long-term correlation between
the BDI (the blue line on the chart) and the CRB Index (the green line on the
chart). The chart also shows that the BDI has led the CRB Index at important
turning points over the past 10 years.
Due to its tendency to lead at important turning points, the BDI's sharp rebound
from its Q1-2015 bottom is interesting. A sharp rebound in the BDI during 2013
proved to be nothing more than a counter-trend move within a continuing bear
market, but that doesn't mean that the current one won't have longer-term
importance.
We'll be paying closer attention to the BDI over the months ahead.
Commodity-related equities
When it comes to practical speculation we are generally more interested in
commodity-related equities than the commodities themselves.
As followers of and investors in the gold-mining sector would know, gold-mining
stocks have been much weaker than gold bullion and the weakness is persisting
despite the gold-stock indices being very stretched to the downside relative to
gold bullion. However, over the past few months the weakness in gold-mining
equities relative to gold bullion has paled in comparison with the weakness in
natural-gas equities relative to natural gas. Whereas natural gas has done no
worse over the past three months than trade sideways, natural-gas equities, as
represented on the following chart by FCG, have crashed.
FCG's performance is a reflection of "get me out at any price" sentiment.
Short-term traders should either not attempt to catch this falling knife or
should place stops to limit losses if the knife continues to fall, but traders
prepared to take a 6-18 month view could reasonably average-in during this
period of extraordinary relative weakness.
Copper equities, as represented on the following chart by COPX, have also
experienced a spectacular decline over the past three months, although in this
case the underlying commodity fell sharply. COPX is not quite as depressed as
FCG, but the same suggestions apply.
Bonds
The decline in the prices of
long-dated Treasury securities that began in the first quarter of this year
ended in May. The iShares 20+ Year Treasury Bond Fund (TLT) has since rebounded
by enough to break above the top of a well-defined price channel. Refer to the
following daily chart for details.
The market is now slightly 'overbought' on a short-term basis and will possibly
consolidate its recent gains, but additional gains are likely prior to the next
multi-month top.
T-Bonds should benefit from a 'flight to safety' over the coming 2 months IF
there's a significant decline in the stock market, but at this stage we don't
expect the T-Bond or TLT to do more in the short-term than test their respective
Q1-2015 peaks. The reason is that, like the Dollar Index, the T-Bond became
sufficiently extended to the upside during the first quarter of this year to
create either a cyclical peak or a peak that will hold for many months.
The Stock Market
The US
At this time the chance of a 2008-style collapse in the US stock market is
extremely small, to the point of being nonexistent. This is because economic
confidence and the monetary inflation rate are at levels that pretty much
preclude such an outcome. However, there's a good chance of a 10%-20% decline
within the coming 3 months. If such a decline materialises it could be the first
leg of a cyclical bear market or it could be the first significant correction
since 2011 in a continuing cyclical bull market. Based on what we know today our
guess is that it would be the former, but there is no point spending a lot of
time thinking about what such a decline implies about the future until it
actually happens.
At the moment the market is doing its best not to provide clues regarding the
likely short-term price direction. The S&P500 Index (SPX), which is by far the
most important US stock index, remains within the unusually-narrow horizontal
trading range that dates back to February (see chart below). It needs to break
out of this range to generate a meaningful price signal. The NASDAQ100 Index (NDX),
the second most important US stock index, also needs to do more -- in one
direction or the other -- to generate a meaningful price signal.
Some of the lesser indices have generated bearish signals and the weakness over
the past few months in measures of market breadth also points to a short-term
bearish outcome, but these bearish indications won't mean anything until/unless
they are confirmed by the price action of the SPX and the NDX.
This week's
significant US economic events
[Notes:
1) The most important events
(to the markets) are shown
in bold. 2) A list of global economic events can be found
HERE]
| Date | Description |
| Monday Aug 10 | No important events scheduled |
| Tuesday Aug 11 | Q2 Productivity and Costs |
| Wednesday Aug 12 | Treasury Budget |
| Thursday Aug 13 |
Retail Sales Import and Export Prices Business Inventories |
| Friday Aug 14 |
PPI Industrial Production Consumer Sentiment |
Gold and the Dollar
By the way, according to the Fed Funds Futures market last Friday's employment
data and price action slightly increased the probability that the Fed's first
rate hike will happen in September. We are hoping it will happen in September so
that 'everyone' can stop talking about it and acting as if a 0.25% interest-rate
increase means something.
The COT
Gold's COT situation was unequivocally bullish during the week before last and,
according to last week's data, is now even more so by a small amount. The total
speculative net-long position remained unchanged at a 13-year low of 15K
contracts, but over the latest week there was an increase in the long exposure
of large speculators that was offset by an increase in the short exposure of
small traders. The net-short position of small traders (the proverbial dumb
money) in COMEX gold futures is now at its highest level since the early-1990s,
which suggests that small traders in COMEX futures haven't been this bearish on
gold in almost 25 years.
Silver's COT situation is also bullish, but not quite as bullish as gold's.
Gold Stocks
The superficial impression created by the price action is that although the
gold-mining indices are more 'oversold' than they have ever been, they are
incapable of rallying. This impression was supported by last Friday's price
action, when an upward reversal by the gold price failed to result in a
sustained rebound in the gold-mining sector. Instead, the HUI initially rose to
a new 4-day high on Friday and then promptly gave back its gain.
Has the sort of price action witnessed in the gold-mining sector over the past
few weeks ever happened before?
The answer is yes; the recent price action is similar to what happened during
the weeks leading up to the major bottom in November of 2000. As illustrated
below, the final three weeks of the bear market that ended in November of 2000
involved gold bullion trading sideways within a narrow range in parallel with
relentless weakness in the HUI.
There are some important differences between the present situation and
November-2000. In particular, in November-2000 the fundamental backdrop had
recently become unequivocally gold-bullish, thanks in part to clear evidence
that the US stock market's long-term bullish trend had ended. That's not the
case now. Our points are simply that the gold-mining sector can look dismal
right up to the day that a major rally begins and that the price action does not
imply significant additional short-term weakness.
The Currency Market
Based on the price action we have thought that the Dollar Index had a roughly
equal chance of rising to test its March high near 100 or pulling back to the
low-90s (a sustained move outside the 90-100 range is unlikely over the next few
months). It would take a daily close below 96.3 to definitively skew the odds in
favour of the latter outcome, although Friday's performance constitutes a
tentative sign that the next move of significance will be to the downside. The
reason is that Friday was an outside-down reversal day for the Dollar Index,
meaning that the Dollar Index a) reversed direction after first making a
marginal new high for the move, b) ended the day with a loss, and c) traded
outside the range of the preceding day.
Although US$ fundamentals are superficially bullish, the COT data suggest that
the fundamentals are fully discounted in the dollar's current exchange value.
What we mean is that currency speculators are positioned in a big way for
additional US$ gains. This limits the potential for new speculative buying to
boost the dollar and increases the potential for the unwinding of short-term
speculative positions to push the dollar downward.
Updates
on Stock Selections
Notes: 1) To review the complete list of current TSI stock selections, logon at
http://www.speculative-investor.com/new/market_logon.asp
and then click on "Stock Selections" in the menu. When at the Stock
Selections page, click on a stock's symbol to bring-up an archive of
our comments on the stock in question. 2) The Small Stock Watch List is
located at http://www.speculative-investor.com/new/smallstockwatch.html
![]() Company
news/developments for the week ended Friday 7th August 2015:
Company
news/developments for the week ended Friday 7th August 2015:
[Note: AISC = All-In Sustaining Cost, FS = Feasibility Study, IRR = Internal
Rate of Return, MD&A = Management Discussion and Analysis, M&I = Measured and
Indicated, NAV = Net Asset Value, NPV(X%) = Net Present Value using a discount
rate of X%, P&P = Proven and Probable, PEA = Preliminary Economic Assessment,
PFS = Pre-Feasibility Study]
*Almaden Minerals (AAU) will begin trading 'ex' the Almadex
spinout on Monday 10th August. AAU shareholders of record on 7th August are now
also shareholders of Almadex, which should soon begin to trade on the TSXV under
the symbol AMZ.
We own AAU shares and intend to hold our AMZ shares for now. In fact, if they
trade at a low enough price we might even add to our AMZ position. However, AMZ
is too small and will almost certainly be too illiquid to go into the TSI Stocks
List, so for TSI record purposes we will assume that the AMZ shares are sold on
the market and treat the proceeds of the sale as a dividend. Also, we will put
AMZ in the TSI Small Stocks Watch List.
*Energy Fuels (EFR.TO, UUUU) published its financial report for
the quarter ending 30th June. The report shows that EFR's balance sheet remains
healthy, with US$41.5M of working capital. This means that the company added
about $7M to its working capital during the quarter, which is both a
satisfactory and an expected result following the $3M decline in working capital
during the March quarter. However, due to the takeover of Uranerz during the
quarter and the assumption of Uranerz's liabilities, EFR's long-term debt has
risen from $14M to $31M.
EFR offers substantial leverage to the uranium price and should be an
exceptional performer during the next cyclical advance in the uranium market,
but at an operational level the leverage won't start to kick-in until the
uranium price rises above $50/pound. In the meantime the company is in a holding
pattern, generating enough cash by selling into its long-term contracts (at
$59/pound) to maintain a healthy balance sheet.
*McEwen Mining (MUX) published its financial report for the June
quarter. There was nothing new of interest in the report as the important
information was announced in an earlier press release.
MUX's 100%-owned El Gallo gold mine in Mexico is operating very well and is
strongly cash-flow positive at the current gold price, whereas its 49%-owned San
Jose gold-silver mine in Argentina is struggling. The net result is a
gold-mining company that is doing slightly better than holding its financial
ground in today's challenging market environment.
The company has been adding cash to its balance sheet and presently has about
US$32M of working capital and no long-term debt.
*Pretium Resources (PVG) published its financial report for the
June quarter. The report showed that the company spent money rapidly during the
latest quarter, causing its working capital to plunge from C$103M at 31st March
to C$61M at 30th June. There was a $7M equity financing during the period, so
PVG managed to consume almost C$50M of working capital in a single quarter. This
is extraordinary given that mine construction hasn't yet begun.
Most of the spending came under the general category of "Mineral Interests" and
was spread between "Camp and surface activities", "Engineering and permitting"
and "Underground and surface exploration". Some of last quarter's spending
should be part of the Brucejack project's initial capex, but no details were
provided in either the financial statements or the MD&A.
Due to the surprisingly-large amount of money spent by PVG last quarter, the
company will probably have to do a larger equity financing than we were
anticipating (along with the expected debt financing) to fund the >$700M initial
Brucejack capex. We suggest holding off on any new buying of PVG shares until
the construction-financing package is put to bed.
![]() List
of candidates for new buying
List
of candidates for new buying
From within the ranks of TSI stock selections the best candidates for new buying
at this time, listed in alphabetical order, are:
1) DNA.TO (last Friday's closing price: C$0.84)
2) EDV.TO (last Friday's closing price: C$0.53)
3) EVN.AX (last Friday's closing price: A$0.94)
4) MUX (last Friday's closing price: US$0.70)
5) PG.TO at around C$2.00 (last Friday's closing price: C$2.12)
Note that the above list is limited to five stocks. It will sometimes contain
less than five, but it will never contain more than five regardless of how many
stocks are attractively priced for new buying.
Additional notes regarding the above list:
1) As stated at the top, the list is in alphabetical order. This means that the
order in which the stocks are displayed does not reflect priorities for new
buying. For example, we've made it clear in commentaries over the past few weeks
that Premier Gold (PG.TO) should have been the top priority for new buying for
anyone looking to increase their exposure to exploration-stage gold-mining
stocks during the sector-wide price collapse, but due to its symbol if it is on
this list it will usually be closer to the bottom than the top.
2) The list is based on relative appeal at current prices and takes into account
valuation, the price chart (including overbought/oversold indicators), and
potential catalysts. For example, Almaden Minerals (AAU) was in the list last
week because the stock was near the bottom of its price channel and was
scheduled to trade 'ex' the Almadex spinout at the end of the week. It is not in
the list this week because the opportunity to participate in the Almadex spinout
has passed and because the stock price is now close to the top of its price
channel having gained 24% last week.
Chart Sources
Charts appearing in today's commentary
are courtesy of:
http://stockcharts.com/index.html
http://www.sharelynx.com/
http://www.barchart.com/