|
-- Weekly Market Update for the Week Commencing 10th September 2007
Big Picture
View
Here is a summary of our big picture
view of the markets. Note that our short-term views may differ from our
big picture view.
Bonds commenced a secular BEAR market in
June of 2003. (Last
update: 22 August 2005)
The stock market, as represented by the S&P500 Index, commenced a secular BEAR market during the first quarter of 2000. The rally
that
began in October of 2002 will end during the first half of 2007. The ultimate bottom of
the secular bear market won't occur until the next decade. (Last update: 02 October 2006)
The Dollar commenced a secular BEAR market during the final quarter of 2000. The
first major downward leg in this bear market ended during the first
quarter of 2005, but a long-term bottom won't occur until 2008-2010. (Last update: 28 March 2005)
Gold commenced a
secular bull market relative to all fiat currencies, the CRB Index,
bonds and most stock market indices during 1999-2001. The first major
upward leg in this secular bull market ended in December of 2003, but a
long-term peak won't occur until at least 2008-2010. (Last update: 13
February 2006)
Commodities, as
represented
by the CRB Index, commenced a secular BULL market in 2001. The first
major upward leg in this bull market ended during the second quarter of
2006, but a long-term
peak won't occur until at least 2008-2010. (Last update: 08 January 2007)
Copyright
Reminder
The commentaries that appear at TSI
may not be distributed, in full or in part, without our written permission.
In particular, please note that the posting of extracts from TSI commentaries
at other web sites or providing links to TSI commentaries at other web
sites (for example, at discussion boards) without our written permission
is prohibited.
We reserve the right to immediately
terminate the subscription of any TSI subscriber who distributes the TSI
commentaries without our written permission.
Outlook Summary
Market
|
Short-Term
(0-3 month)
|
Intermediate-Term
(3-12 month)
|
Long-Term
(1-5 Year)
|
Gold
|
Bearish
(07-Sep-07)
|
Neutral
(15-Aug-07)
|
Bullish
|
US$ (Dollar Index)
|
Bullish
(11-Jun-07)
| Bullish
(31-May-04)
|
Bearish
|
Bonds (US T-Bond)
|
Neutral
(10-Sep-07)
|
Neutral
(23-Jul-07)
|
Bearish
|
Stock Market (S&P500)
|
Bearish
(27-Aug-07)
|
Neutral
(26-Mar-07)
|
Bearish
|
Gold Stocks (HUI)
|
Bearish
(03-Sep-07)
|
Neutral
(15-Aug-07)
|
Bullish
|
| Oil | Bearish
(23-July-07)
| Neutral
(25-Sep-06)
| Bullish
|
Industrial Metals (GYX)
| Bearish
(11-Jun-07)
| Bearish
(09-July-07)
| Bullish
|
Notes:
1. In those cases where we have been able to identify the commentary in
which the most recent outlook change occurred we've put the date of the
commentary below the current outlook.
2. "Neutral", in the above table, means that we either don't have a
firm opinion on which way the market will move or that we expect the
market to be trendless during the timeframe in question.
3. Long-term views are determined almost completely by fundamentals,
intermediate-term views by giving an approximately equal weighting to
fundmental and technical factors, and short-term views almost
completely by technicals.
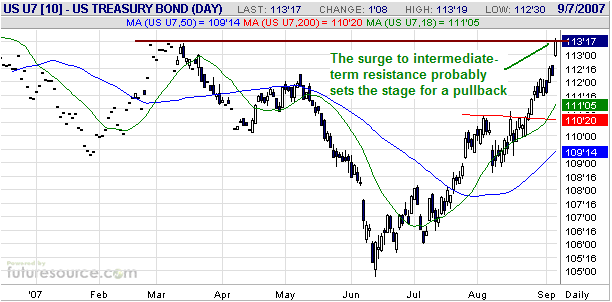
Bonds
In the 27th August Weekly Update we wrote: "With
T-Notes having just experienced a sharp rally and now being poised
precariously at intermediate-term resistance it would be reasonable to
anticipate a pullback, especially taking into account the bearish
Commitments of Traders (COT) data for the combination of T-Note and
T-Bond futures. Our best guess is that the bond market will move to a
new multi-month high during September-October in parallel with a
decline to a new correction low by the stock market, but we now
perceive sufficient short-term downside risk relative to the remaining
upside potential to warrant a further downgrade to our short-term bond
market outlook -- from "neutral" to "bearish"."
The anticipated pullback didn't eventuate and in the mean time the COT
data have actually become slightly less bearish for the bond market
despite the recent price gains. Moreover, if the stock market's
counter-trend rebound has just ended (quite likely, in our opinion)
then the bond market could catch an additional flight-to-safety bid
over the coming weeks.
We certainly wouldn't buy bonds at this time for a long-term investment
or for a short-term trade because the long-term fundamentals could
hardly be more bearish and, as evidenced by the following daily chart
of September T-Bond futures, the market is very 'overbought' on a
short-term basis. However, for the reasons cited above we now think the
short-term upside risk is at least as high as the downside risk and are
therefore shifting to the sidelines (we are now short-term "neutral" on
US T-Bonds/T-Notes).
Just to be clear: our view is that bonds will probably consolidate
their recent gains over the next few weeks, but the risk of sharp
additional gains on the back of a panic towards the perceived safety of
the US Treasury market is high enough to prevent us from maintaining a
short-term bearish stance.
The Stock
Market
Current Market Situation
In the grand scheme of things we think the current market environment
has a lot in common with the late 1960s, but in the short-term the
stock market appears to be following a similar path to the one it
followed in July-October of 1990 and 1998. In both of these historical
cases a mid-July peak was followed by a steep initial decline to an
August low, a rebound into September, and then a drop to the ultimate
correction low during the first half of October.
The following chart compares the S&P500's recent performance with
its performance during 1990. Last week's action suggests that the
rebound from the August low is complete, which, if true and the
similarities to 1990 (and 1998) continue to hold, means that a
multi-week decline to an October bottom is now underway.
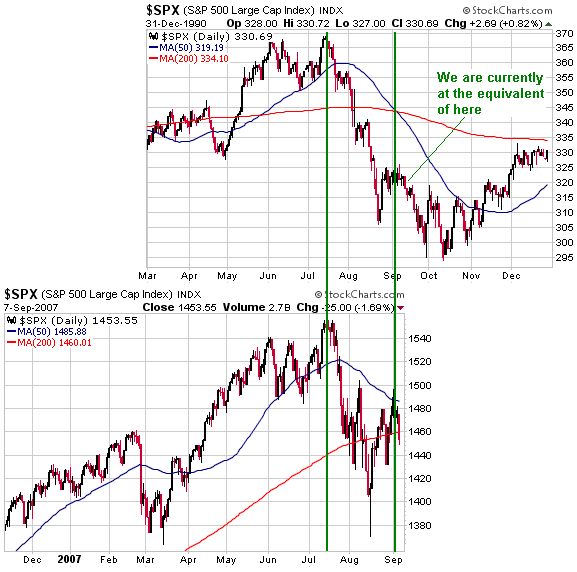
The declines that
occurred during July-October of 1990 and 1998 were corrective moves
within the context of a long-term bull market, whereas the current
decline is occurring within the context of a long-term bear market.
Therefore, even if the 1990/1998 analogy continues to apply in the
short-term we will not assume that the 1-2 years following the
October-2007 bottom will be as bullish as the 1-2 years that followed
the October-1990 and October-1998 bottoms.
In any case, there is no reason to think that far ahead. The thing to
keep in mind is that regardless of what lies in store for the market
during 2008-2009, IF there is a decline to new multi-month lows over
the coming 4-6 weeks THEN there will be a high probability of at least
a 2-4 month rally.
This week's
important US economic events
| Date |
Description |
Monday Sep 10
| Consumer Credit
|
| Tuesday Sep 11 | Trade Balance
| | Wednesday Sep 12
| No important events scheduled
| | Thursday Sep 13
| No important events scheduled | | Friday Sep 14
| Q2 Current Account
Import / Export Prices
Retail Sales
Capacity Utilisation
Industrial Production
|
Gold and
the Dollar
Currency Market Update
The Dollar Index edged below major support at 80 on Friday in response
to worse-than-expected US employment data. Major support extends down
to 78.
Our view has been that a test of 78-80 was likely, but that a decisive
break below this support range at any time over the coming 12 months
was very unlikely. This continues to be our view, despite (partly
because of, actually) the almost universal bearishness towards the US$.
Many of the factors commonly cited for being bearish on the US$ seem
reasonable until you realise that the same bearish factors apply to the
euro. For example:
1. The US money supply has been expanding rapidly, but European money-supply growth has been just as fast.
2. The US central bank is poised to begin a rate-cutting campaign, but
US interest rates remain above those of Europe and if things get bad
enough to warrant Fed rate cuts then ECB rate cuts are sure to follow.
Furthermore, Fed rate cuts totaling 75 basis points by year-end are
already factored into current exchange rates.
3. The US stock market is weak and looks set to become even weaker.
Note, though, that the American S&P500 Index has been trending
UPWARD relative to the French CAC40 Index and the German DAX Index
since the beginning of July. We expect this trend to continue in both
the short-term and the intermediate-term.
4. The US economy looks shaky, but so do many of the economies of Europe.
5. The US will continue to be hurt by the subprime debt crisis and the
unraveling of the boom in structured finance, but bear in mind that the
US managed to export a significant chunk of the toxic debt paper to
Europe when times were good.
The above are reasons to expect the US$ to at least hold its own
against the euro. But we also have to take into account that the euro
is about 20% over-valued relative to the US$ on a purchasing power
parity basis. This euro premium is, in our opinion, unjustifiable and
will be eliminated over the coming year or so.
We therefore perceive a lot more upside potential than downside risk in
the Dollar Index, especially now that the Dollar Index has dropped back
to long-term support at 78-80.
The only major fiat currency against which the US$ stands a good chance of falling sharply over next few months is the Yen.
Gold Stocks
Our attempt to explain the wild gyrations
The following attempt to explain the recent extreme volatility of the major gold stocks was e-mailed to subscribers on Friday:
It seems as if the gold sector is suffering from Bipolar Disorder
because over the past two months it has gone from manic to depressive
and now back to manic. The net change in the gold stock indices over
this period has been small, but the extreme volatility has meant that
the market has ended up going nowhere in an incredibly interesting way.
We aren't sure what to make of Thursday's moon-shot. We anticipated the
rise in the October gold futures contract to around $700 (our view has
been that October gold was headed for $695-$710) and had allowed for
the possibility that the gold stock indices would make some additional
gains during the first half of September before topping out, but we
were surprised by the magnitude of Thursday's gold-stock rally.
This means that short-term moves in the gold sector (as represented by
the HUI) have surprised us on three occasions over the past two months.
Specifically: we were surprised by the amount of strength in both the
HUI and the HUI/gold ratio between late June and mid July (we had been
expecting only a modest rebound); we were surprised by the ferocity of
the July-August decline (we had been expecting a normal pullback from
370 to around 340, but we ended up getting a plunge to the 280s); and,
as noted above, we were surprised by Thursday's phenomenal surge (we
had been expecting the HUI's rebound from its 16th August low to
top-out during the first half of September at no higher than 350).
In a nutshell, while making little progress on a net basis the HUI is
now regularly surprising us with the amplitude and frequency of its
oscillations.
A plausible explanation for the recent extreme volatility is that hedge
funds are quickly moving in herd-like fashion between the long side and
the short side of the market. If this is the case it not only explains
the volatility, it also explains why the action has been concentrated
within the realm of large/liquid gold stocks. For example, there was
frenetic buying on Thursday of Barrick Gold, the largest and most
liquid of all the gold stocks, causing its price to jump 8.4% on more
than double the average daily volume. At the same time, with a few
exceptions the small exploration-stage gold stocks made little headway
on below-average volume.
It was a similar story during the June-July moves by the gold stock
indices to the tops of their 52-week trading ranges in that almost all
the action was in the sorts of stocks that offer sufficient liquidity
to be of interest to hedge funds. The public has largely been absent,
although small-scale retail investors obviously puked-up their gold
stocks when the HUI broke below support in mid August.
The volatility is creating a lot of false signals, especially for those
of us who pay close attention to the way the gold stocks perform
relative to the metal. For example, the HUI/gold ratio broke-out to the
upside and reached a new high for the year during the first three weeks
of July, only to reverse course and plummet to new 52-week lows during
August. In fact, the HUI/gold ratio fell so quickly during the first
three weeks of August that it almost caused our HUI/Gold Oscillator
(HGO) to generate a rare major BUY signal (extreme weakness in the gold
stocks relative to the bullion only ever occurs near intermediate-term
bottoms, which, in turn, usually only occur about once every 12
months). HUI/gold has since rebounded strongly, but based on what has
transpired over the past two months we wonder if this recent strength
means anything or if it will effectively be cancelled-out during the
second half of this month.
In summary, the recent price action has been extraordinary. We aren't
sure what to make of it, so we aren't keen on positions whose success
requires the market to do anything in particular over the next few
weeks (accumulating under-valued gold stocks with the plan to hold for
1-3 years makes sense, but buying for a short-term trade does not).
It's possible that a multi-month rally began at the 16th August low,
but in our view the risk remains high enough to warrant a cautious
stance.
One of the main risks is that the broad stock market will soon return
to its downward path. Over the long-term the gold sector trends
inversely to the broad stock market, but over the short-term it will
usually get taken along for the ride when the stock market experiences
a steep decline. Furthermore, this risk is perhaps more relevant now
than ever if we are right to assume that the switching of positions by
hedge funds is presently the gold sector's dominant short-term driver.
The reason is that if the broad stock market starts to tank then these
funds will probably be forced to liquidate long positions regardless of
whether or not these positions are justified by the fundamentals.
Another risk is that the Dollar Index surprises almost everyone by rallying.
Current Market Situation
If
the US$ surprises us by moving sharply lower over the next few weeks
then the gold stocks will probably continue to advance, almost
regardless of what the broad stock market does...
The following chart shows the AMEX Gold BUGS Index (HUI), the HUI's Relative Strength Index (RSI), and the HUI/gold ratio.
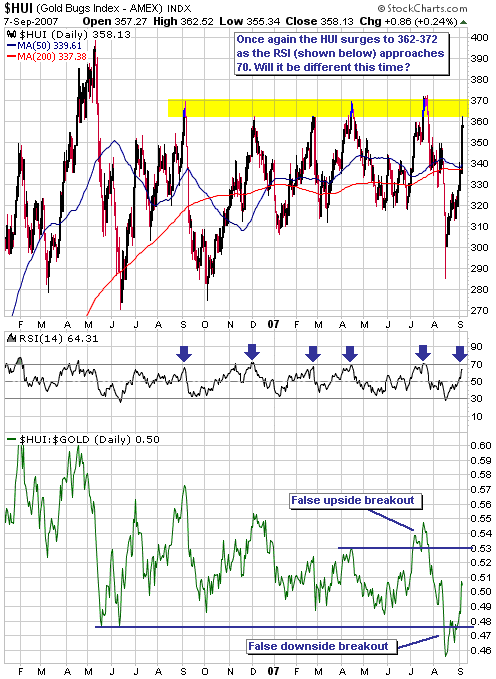
Due to last week's
moon-shot the HUI is now closing in on intermediate-term resistance at
362-372 at the same time as the HUI's RSI closes in on 70. The same set
of circumstances occurred five previous times since September of last
year and each time the HUI dropped back to 320 or lower. Will the
current test of 362-372 lead to a similar short-term outcome?
We don't know. On the positive side of the ledger the gold stocks held
their ground well in the face of general stock market weakness on
Friday, which could be a sign that the gold sector is beginning to
benefit from the liquidity crisis in the short-term in the same way
that it benefits from contracting liquidity in the intermediate- and
long-terms. However, we think it would be inappropriate to read a great
deal into Friday's action because the broad stock market has only just
begun to roll over. If/when the senior stock indices move down to and
then through their 16th August lows the ensuing panic out of equities
could put substantial downward pressure on the gold stocks. We
therefore think that a breakdown in the broad stock market remains a
serious short-term threat to the gold sector, despite the fact that
Friday's action was unequivocally bullish.
Also on the positive side of the ledger, even though the HUI/gold ratio
has rebounded strongly over the past couple of weeks it is still closer
to the bottom than to the top of its 12-month range. This means that
the major gold stocks are a long way from being overbought relative to
the bullion.
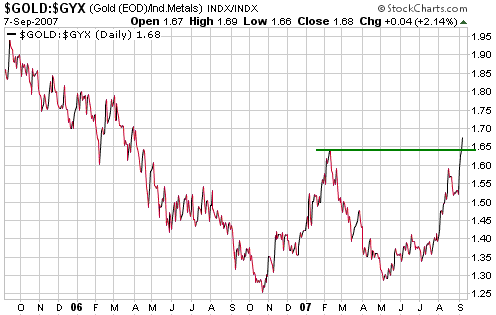
And last but certainly not least, the following chart shows that gold
has just moved to a new 52-week high relative to the Industrial Metals
Index (GYX). The gold/GYX ratio is an indicator of financial market
liquidity -- gold tends to rise relative to the industrial metals when
liquidity contracts -- and also of what's happening to gold mining
profit margins. Gold/GYX's recent performance clearly has bullish
implications for gold mining profit margins, although this is more of
an intermediate-term than a short-term factor.
On the negative side
of the ledger, this week (10th through 14th September) is the most
likely TIME for an important peak IF the gold sector's reliable
October-November cycle is going to produce a low this year. This, when
considered alongside the HUI's close proximity to intermediate-term
resistance and the position of the HUI's RSI, is a reason to be
cautious.
Also, a sharp decline in the broad stock market will potentially be a negative influence over the next several weeks.
In the short-term we always put more emphasis on risk than on potential
reward. This is because the short-term price direction is far more
random (less predictable) than the long-term price direction and
because we'd rather be in the position of having moderate exposure to
the long-term bull market and wishing we had heavy exposure than in the
position of having heavy exposure and wishing we owned a lot less. That
being said, we do see an opportunity for the gold stock indices to rise
an additional 10%-12% over the coming weeks in parallel with a DECLINE
in the broad stock market. This opportunity revolves around the
possibility (not probability) of the US$ breaking below major support
at 78-80 and quickly dropping to the mid-70s on the back of fears that
the on-going debt crisis will prompt a more aggressive monetary/fiscal
response in the US than in other countries. As discussed above under
"Currency Market Update" we don't think that such a market outcome
would be rational, but in the short-term it is not uncommon for markets
to move to unsustainable extremes; particular when emotions are running
high as they are right now.
If the US$ surprises us by moving sharply lower over the next few weeks
then the gold stocks will probably continue to advance, almost
regardless of what the broad stock market does (unless the broad stock
market crashes, but in our opinion the probability of a bona fide crash
is almost zero). If this set of circumstances were to arise it would,
we suspect, lead to the HUI making an intermediate-term high at around
its May-2006 peak (400) within the coming six weeks, but we do not
think it would set in motion a major new upward leg in the gold
sector's long-term bull market.
In our opinion, a breakdown in the US$ over the next few weeks would
simply increase the upward pressure on the US currency and set the
stage for a larger dollar advance than would otherwise have been
possible. This would, in turn, create the backdrop against which the
gold sector would likely experience a major multi-month decline.
Now, we are well aware that the gold sector rallied strongly in
parallel with a US$ advance during September-November of 2005. However,
September-November of 2005 was the FINAL phase of the dollar rally that
began in January of that year. During the first five months of the 2005
dollar rally the gold price drifted lower and the gold sector of the
stock market was crushed. Something similar will, we think, occur
during the first few months of the dollar's next intermediate-term
rally.
Further to the above, our view is that the most likely way for the
scene to be set for the next major upward leg in the gold sector's
long-term bull market would be for the gold-stock indices to drop
sharply from a top during the coming five trading days to an October
bottom. In other words, the short-term bearish alternative creates the
intermediate-term bullish alternative.
The junior gold stocks
Our view is that the small-cap end of the gold sector offers by far the
best long-term risk/reward ratio in the stock market. Our own portfolio
continues to be aligned in accordance with this view, as does the TSI
Stocks List.
The small-cap gold stocks, as a group, haven't rebounded as strongly as
their larger-cap brethren over the past few weeks, but there is nothing
unusual about this. By the time the gold sector reaches the top of a
primary upward leg the average junior gold stock will usually have
achieved a much larger percentage gain than the average major gold
stock, but the juniors generally don't do much during the early stages
of primary upward legs or during the counter-trend rebounds that occur
within downward corrections. Our view is that the current rally in the
gold sector is part of the correction that began in May of 2006, which
means that we aren't expecting a large across-the-board rise in our
junior gold stocks to occur in the near future. Some of them will
probably catch bids over the next few weeks in response to
company-specific developments, especially if our cautious short-term
stance proves to be unwarranted; but the sort of dramatic broad-based
advance that we experienced during the first half of 2006 has a low
probability of occurring anytime soon.
In general, speculators who want stocks that respond quickly to
positive developments in the gold sector should focus on the major and
mid-tier producers, while speculators who are willing to tolerate
short-term under-performance in exchange for the potential to make much
higher long-term returns should focus on the juniors. It would be nice
if we could efficiently switch between the larger-caps and the
smaller-caps based on where we happened to be in the cycle, but there
are two reasons why this is not feasible. First, in real time it is
often not possible to determine, with confidence, exactly where we are
in the cycle. Second, in order to achieve the best gains within the
realm of small-cap gold/silver stocks you must buy the stocks when they
are out of favour.
Gold
...if
the Fed really wanted to it could probably halt the current gold rally
by simply not cutting the Fed Funds rate at its 18th September meeting.
However, we don't think the Fed will be concerned enough about the
rising gold price to make it a top priority when deciding what actions
to take over the next few weeks.
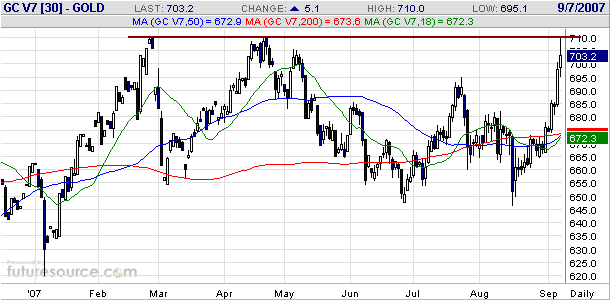
Below is a daily chart of October gold futures. The close proximity to
intermediate-term resistance at $710 and the fact that this resistance
is being tested following a sharp 3-week rise are why we downgraded our
short-term outlook to "bearish" at the end of last week.
If the October contract closes at $715 or higher then our short-term
outlook will change to either "neutral" or "bullish" because a decisive
break above $710 will create a short-term technical objective of $775.
If an upside breakout occurs immediately (within the next few days)
then the risk of a quick breakout failure will be quite high and we
will only move our short-term view to "neutral". However, if gold can
consolidate below $710 for at least a few days (preferably 1-2 weeks)
before breaking above $710 then the upside breakout will have a greater
chance of being sustained and we will move our short-term view to
"bullish" in anticipation of a rise to $775.
Will an upside breakout in the gold market prevent the Fed from cutting its targeted interest rate on 18th September?
The Fed never likes to see substantial strength in the gold market, but
notwithstanding all the entertaining theories to the contrary the
central banks have very little direct control over the gold price. This
is because the amount of gold that the CBs are capable of selling (or
lending) into the market is very small compared to the amount of gold
bullion that gets traded via the London Bullion Market Association
(LBMA), and is of microscopic proportions compared to the amount of
paper money sloshing around the world. Therefore, keeping the gold
price under control involves the management of inflation expectations,
which, in turn, involves such things as influencing short-term interest
rates, controlling currency exchange rates, concocting bogus economic
data, 'jawboning', etc.
The upshot is that if the markets decide that the gold price deserves
to be higher then the gold price will go higher regardless of direct
intervention by the Fed or any other central bank. It also means that
if the Fed wants to halt a gold rally in its tracks it can really only
do so via a significant tightening of monetary policy or by making the
markets believe that monetary conditions are going to tighten.
Given that the financial markets have already discounted a near-term
easing of monetary policy, if the Fed really wanted to it could
probably halt the current gold rally by simply not cutting the Fed
Funds rate at its 18th September meeting. However, we don't think the
Fed will be concerned enough about the rising gold price to make it a
top priority when deciding what actions to take over the next few
weeks. The reason is that the current strength in the gold market is
not occurring in response to rising inflation fears. If it were then
the bond market would not be rallying with the gold market and the
"Expected CPI" (the yield on the 10-year T-Note minus the yield on the
inflation-protected 10-year T-Note) would not be near a 4-year low.
As far as we can tell, the current gold rally is being driven primarily
by fears that the debt crisis will lead to a breakdown in the Dollar
Index and secondarily by the contraction of liquidity. And unlike
surging inflation fears, a breakdown in the Dollar Index would probably
not concern the Fed at this time.
We therefore don't see the Fed as the main threat to the gold market's
short-term upside prospects. The main threat is that the Dollar Index
fails to do what just about everyone is expecting it to do and,
instead, begins to trend upward.
Update
on Stock Selections
(Note: To review the complete list of current TSI stock selections, logon at http://www.speculative-investor.com/new/market_logon.asp
and then click on "Stock Selections" in the menu. When at the Stock
Selections page, click on a stock's symbol to bring-up an archive of our comments on the stock in question)
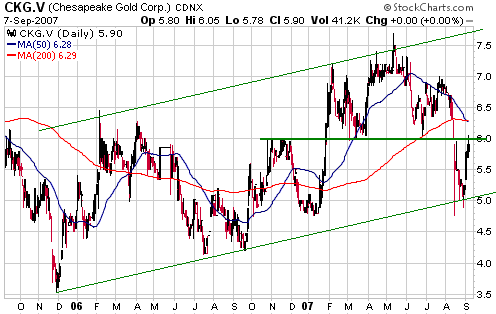
 Chesapeake Gold (TSXV: CKG). Shares: 29M issued, 43.5M fully diluted. Recent price: C$5.90 Chesapeake Gold (TSXV: CKG). Shares: 29M issued, 43.5M fully diluted. Recent price: C$5.90
We highlighted CKG as a buy at around C$5.00 in the 29th August Interim
Update. It has since moved up to resistance at C$5.90-C$6.00 (see chart
below), so anyone who bought near the recent lows has made a quick 20%
or thereabouts. However, CKG is not the sort of stock that should be
bought for a quick trade. For one thing, it is too illiquid to be a
trading vehicle. For another, the short-term fluctuations in a stock
such as this are trivial compared to its long-term multi-bagger
potential.
The enormous potential of just one of CKG's projects -- the Metates
gold project in Mexico -- was reviewed in Claude Cormier's Ormetal
Report (http://www.ormetal.com) on
31st August. The Ormetal Report is a good resource for stock selection
ideas for those who are interested in exploration-stage gold and silver
stocks.
Claude has kindly given us permission to share his recent CKG report with our readers. It can be viewed or downloaded at: http://www.speculative-investor.com/new/CKG_progress_Sep2007.pdf
CKG is a good stock to accumulate on short-term pullbacks with the aim of holding for 1-3 years.
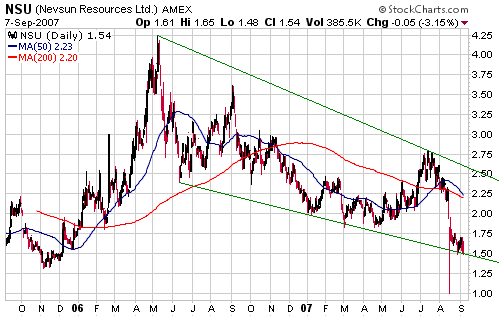
Nevsun Resources (TSX and AMEX: NSU). Shares: 118M issued, 146M fully diluted. Recent price: US$1.54
NSU announced last week that its Tabakoto gold mine in Mali was being
shut down and put on "care and maintenance", a reasonable thing to do
given that the mine was losing money on every ounce of gold it
produced. Tabakoto had previously been written down to zero in NSU's
financial statements.
Tabakoto still has significant value because: a) the in-ground
resource, despite not living up to the estimates contained in the
project's feasibility study, has value as a type of call option on
gold, and b) the mine's plant, equipment and on-site structures are
worth something. Ideally, the Tabakoto project will be sold to another
gold mining company operating in the region -- our Resolute Mining
springs to mind -- thus allowing NSU to focus on the Bisha
poly-metallic project in Eritrea.
The only reason to own NSU at this time is because the Bisha project is
worth a lot more than NSU's current market cap. To be specific, as
noted in the 16th October 2006 Weekly Update we think NSU's stake in
the Bisha project is worth at least US$500M, or more than US$4 per
share. It is this upside potential that keeps us interested in the
stock despite its poor performance.
In the current environment we prefer exploration-stage resource stocks
that are focused on gold (as opposed to the poly-metallic focus of NSU)
and that are relatively low-risk (exploration-stage resource stocks are
inherently risky, but some are less risky than others). CKG.V, GGN.TO,
GOZ.V and KGN.V meet these criteria whereas NSU does not. However, the
likelihood that Bisha's tremendous value will be unlocked, one way or
another, justifies maintaining a small position in NSU.
Northern Orion Resources (TSX: NNO, AMEX: NTO)
We took profits on NNO (the NNO February-2010 C$6.00 warrants (TSX:
NNO.WT.A), to be more precise) in early July following the announcement
of the 3-way merger proposal that entails Yamana Gold (TSX: YRI, NYSE:
AUY) making takeover bids for NNO and Meridian Gold (TSX: MNG, NYSE:
MDG). NNO has consistently traded at a large discount to the implied
value of YRI's bid because the offer for NNO is contingent upon YRI
gaining control of two-thirds of MNG's shares, but MNG's management has
been doing its best to prevent the merger from happening.
MNG's senior managers are still doing their best to prevent the merger
from happening, but their chances of success plummeted last Friday when
a deadline for other companies to make competing bids arrived and there
were no takers. As a result, the market quickly re-evaluated the
situation and came to the conclusion that the 3-way merger will
probably happen despite MNG's on-going protestations. This, in turn,
caused MNG's premium to YRI's implied offer value to completely
disappear (MNG actually ended Friday's session at a small discount to
YRI's offer value) and led to a substantial reduction in NNO's discount
(NNO gained 16% on Friday).
NNO is still trading at a 7% discount to the implied value of YRI's
offer, but the odds are now clearly in favour of the merger going ahead
so the discount will probably disappear altogether over the coming
days. We wouldn't buy NNO in anticipation of the merger going ahead and
the remaining discount being eliminated, though, because something
could still go wrong.
Our reason for re-visiting this takeover situation is that IF the
merger proceeds as currently proposed then the NNO warrants could again
become an interesting speculation because they will become YRI
warrants. YRI doesn't appeal to us as an investment due to its 'growth
at any price' strategy, but it does tend to be a relatively high-beta
play on the overall gold sector. This means that the warrants, which
don't expire until Feburary-2010, would become ultra-high-beta plays on
the gold sector.
Chart Sources
Charts appearing in today's commentary
are courtesy of:
http://stockcharts.com/index.html
http://www.futuresource.com/

|
