|
-- Weekly Market Update for the Week Commencing 10th September 2012
Big Picture
View
Here is a summary of our big picture
view of the markets. Note that our short-term views may differ from our
big picture view.
In nominal dollar terms, the BULL market in US Treasury Bonds
that began in the early 1980s will end by 2013. In real (gold)
terms, bonds commenced a secular BEAR market in 2001 that will continue
until 2014-2020. (Last
update: 23 January 2012)
The stock market, as represented by the S&P500 Index,
commenced
a secular BEAR market during the first quarter of 2000, where "secular
bear market" is defined as a long-term downward trend in valuations
(P/E ratios, etc.) and gold-denominated prices. This secular trend will bottom sometime between 2014 and 2020.
(Last update: 22 October 2007)
A secular BEAR market in the Dollar
began during the final quarter of 2000 and ended in July of 2008. This
secular bear market will be followed by a multi-year period of range
trading.
(Last
update: 09 February 2009)
Gold commenced a
secular bull market relative to all fiat currencies, the CRB Index,
bonds and most stock market indices during 1999-2001.
This secular trend will peak sometime between 2014 and 2020.
(Last update: 22 October 2007)
Commodities,
as represented by the Continuous Commodity Index (CCI), commenced a
secular BULL market in 2001 in nominal dollar terms. The first major
upward leg in this bull market ended during the first half of 2008, but
a long-term peak won't occur until 2014-2020. In real (gold) terms,
commodities commenced a secular BEAR market in 2001 that will continue
until 2014-2020.
(Last
update: 09 February 2009)
Copyright
Reminder
The commentaries that appear at TSI
may not be distributed, in full or in part, without our written permission.
In particular, please note that the posting of extracts from TSI commentaries
at other web sites or providing links to TSI commentaries at other web
sites (for example, at discussion boards) without our written permission
is prohibited.
We reserve the right to immediately
terminate the subscription of any TSI subscriber who distributes the TSI
commentaries without our written permission.
Outlook Summary
Market
|
Short-Term
(1-3 month)
|
Intermediate-Term
(6-12 month)
|
Long-Term
(2-5 Year)
|
|
Gold
|
Neutral
(10-Sep-12)
|
Bullish
(26-Mar-12)
|
Bullish
|
|
US$ (Dollar Index)
|
Bullish
(10-Sep-12)
|
Neutral
(09-Jan-12)
|
Neutral
(19-Sep-07)
|
|
Bonds (US T-Bond)
|
Bearish
(02-Jul-12)
|
Neutral
(18-Jan-12)
|
Bearish |
|
Stock Market
(DJW)
|
Bearish
(30-Jul-12)
|
Bearish
(28-Nov-11)
|
Bearish
|
|
Gold Stocks
(HUI)
|
Bullish
(26-Mar-12)
|
Bullish
(23-Jun-10)
|
Bullish
|
|
Oil |
Neutral
(30-Jul-12)
|
Neutral
(31-Jan-11)
|
Bullish
|
|
Industrial Metals
(GYX)
|
Neutral
(30-Jul-12)
|
Neutral
(29-Aug-11)
|
Neutral
(11-Jan-10)
|
Notes:
1. In those cases where we have been able to identify the commentary in
which the most recent outlook change occurred we've put the date of the
commentary below the current outlook.
2. "Neutral", in the above table, means that we either don't have a
firm opinion or that we think risk and reward are roughly in balance with respect to the timeframe in question.
3. Long-term views are determined almost completely by fundamentals,
intermediate-term views by
fundamentals, sentiment and technicals, and short-term views by sentiment and
technicals.
The greatly anticipated
ECB bond-buying program
Recent comments by ECB chief Draghi had led
to widespread expectations of a new ECB bond-buying program designed to cap the
yields on EZ government bonds. These expectations were largely met on Thursday
6th September when the ECB introduced an open-ended (meaning: unlimited)
government bond purchasing program for short-term (1-3 year) debt securities to
reduce interest rates paid by governments in crisis. It is called the Outright
Monetary Transaction (OMT) program.
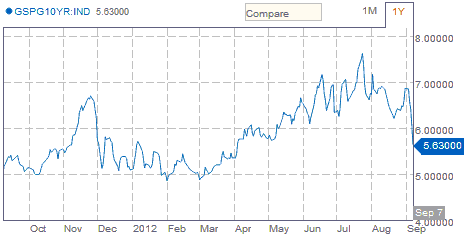
On Thursday and Friday the financial markets celebrated the new bond-buying
program. Of particular relevance, the first of the following charts shows that
the yield on the 10-year Spanish government bond plunged to its lowest level
since April, and the second of the following charts shows that the yield on the
10-year Italian government bond dropped to its lowest level since March. The
10-year Italian government bond yield is actually now close to a 12-month low.
So, no more EZ government debt crisis! Problem solved with just a few words from
the ECB.

Lost in the party-like atmosphere late last week were two important details.
First, although many commentators talked as if the ECB had just committed to
print euros like crazy, the ECB actually stated that it would sterilise all bond
purchases so that these purchases did not result in monetary inflation. To put
it more plainly: the ECB specifically stated that it would NOT be printing money
as part of this new program.
Second, the ECB stated that the bond purchases would be highly conditional.
Importantly, the government in question would have to formally request a
bailout, agree to comply with an economic reform package (commonly called
"austerity program") approved by the EU and the IMF, and then submit to on-going
supervision to ensure compliance. The bond support would end if the government
being supported failed to meet its commitments.
So, according to the ECB the new bond-buying program will not result in a higher
money supply and will only apply to governments that follow the "austerity" path
laid down by supranational organisations. Little wonder there was no push-back
from the German government.
Details that weren't overlooked, perhaps because they support the resurgent
"risk on" theme, are that the ECB will rank equally with private investors who
own the same bonds and that collateral requirements for borrowing from the ECB
will be lowered. The latter gives troubled EZ banks greater ability to borrow.
It seems that the financial world is momentarily in a zone where all news that
isn't overtly negative is treated as positive. That's why the markets were
willing to ignore the word "sterilised" in the ECB's promise to make unlimited
sterilised bond purchases. The amount of bonds that the ECB can purchase in a "sterilised"
way is actually very limited, because for the ECB to sterilise a bond purchase
it must sell an asset of equivalent value (it issues new money to make a bond
purchase and then absorbs the equivalent amount of money by selling one of its
existing assets). The thing is, a lot of the ECB's existing assets are also the
assets it is trying to support via the purchase program. This could mean that
the ECB doesn't intend to buy a lot of bonds in the near future. It could also
mean that the ECB will eventually be forced to make unsterilised bond purchases
(outright bond monetisation, or QE).
The ECB will eventually resort to unsterilised bond purchases, but crisis
conditions will probably have to re-emerge before that becomes politically
feasible.
A weak employment report
leads to more QE speculation
According to data published last Friday, only 96K
jobs were added to the US economy in August (versus expectations of at least
125K) and jobs growth for the previous two months was 41K less than previously
reported. The unemployment rate fell from 8.3% to 8.1%, but this was only
because about 400,000 people dropped out of the workforce during the latest
month. In the US if your employment prospects become so dismal that you give up
looking for a job, you are no longer counted as unemployed.
Absurdly, most discussions about the US economy address the question of whether
or not a recession can be avoided. A more realistic discussion would address the
question of when the current recession was likely to end. Even more absurdly,
most commentators and economists talk in terms of the Fed being able to help the
economy through this 'rough patch' by creating more money. We still doubt that
the Fed will do anything in the near future, but if it does introduce a new
inflation program it won't be helping. Injecting more money into the economy
would boost some prices and would almost certainly enrich the owners of gold
(all twelve of them), but it would do nothing to boost job prospects in the
short-term and would lead to higher unemployment in the long-term.
The one thing the pleaders for an immediate new QE program have in their favour
is the Fed chairman's dearly-held belief that counterfeiting money can help
right the economy. However, as ignorant as Bernanke as shown himself to be it is
still hard for us to imagine that he would initiate a new inflation program with
the stock market having just made a new multi-year high, oil close to
$100/barrel, the gold price less than 10% from an all-time high and a
Presidential election only 2 months away.
Debt and Deflation
Deflation is often linked to debt, which on
the surface seems reasonable given that the higher the debt level the greater
the amount of money that will have to be devoted to debt repayment and the
lesser the abilities of borrowers and lenders to increase their commitments. But
as is regularly the case in the world of economics, looking beneath the surface
leads to a different conclusion. At least, looking deeper suggests the strong
possibility of a different conclusion.
Here's the crux of the matter: When a heavily-indebted government is unable to
print -- either directly or via its central bank -- the money in which its debt
is denominated, the consequences are deflationary. However, when a
heavily-indebted government is able to print -- either directly or via its
central bank -- the money in which its debt is denominated, the consequences are
almost always inflationary. The reason is that inflation (creating money out of
nothing) allows politicians to postpone the tough decisions that must be made in
order to permanently resolve a debt problem. If postponement can continue for
long enough then the debt will become someone else's problem.
With most of today's governments having access (via their central banks) to the
printing press, it's a very good bet that the bigger the government's debt
problem the greater the amount of inflation -- the monetary kind and the price
kind -- there will be, up to the point where more inflation is politically
impossible. And more inflation only becomes politically impossible after the
voting public begins to see "inflation" as the most important economic threat.
To put it another way, in those cases where a government can inflate at will,
which is the case in the US and in most countries today, the government will
almost certainly attempt to use inflation to put off the really tough decisions
for as long as it can get away with doing so.
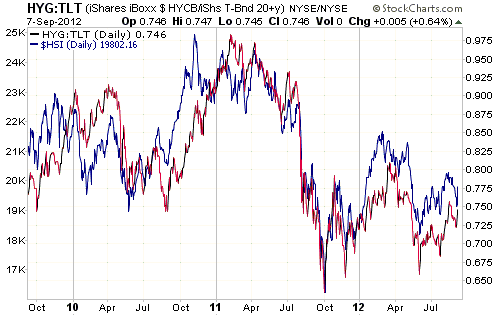
The Stock
Market
The US stock market has decoupled from most
other important stock markets in the opposite way to how the true believers in
the Asian-growth-miracle-commodity-super-cycle theme expected. We doubt that the
US stock market will be a relative strength leader for much longer, but its
strength relative to most other stock markets over the past two years has led to
divergences between stock market performance and reliable measures of risk
aversion. When they are compared to the S&P500 Index these measures of risk
aversion appear to have stopped working, but when they are compared to indices
representing other important markets around the world they still appear to be
valid. Take the HYG/TLT ratio (high-risk bonds relative to low-risk bonds) as an
example. The sequence of declining tops in this indicator since early 2011
suggests increasing risk aversion, which is at odds with the performance of the
S&P500 Index over the same period. However, the following chart shows that it
meshes neatly with the performance of Hong Kong's Hang Seng Index. According to
this chart, nothing of a longer-term nature changed as a result of last week's
celebrations.
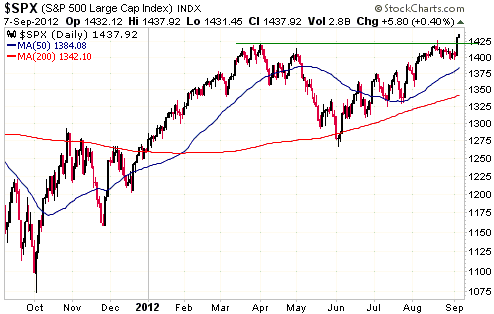
The market action during the final two days of last week proved that the
S&P500's preceding downward drift was a routine consolidation. A new multi-year
high has been achieved, but we don't have a good reason to anticipate meaningful
follow-through to the upside.
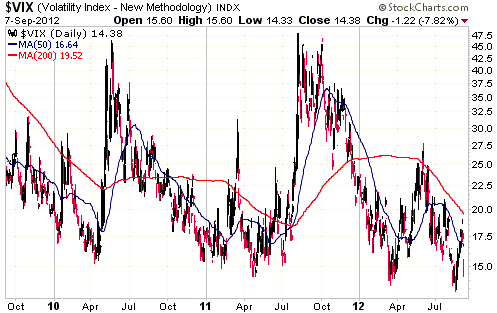
The equity rally over the final two days of last week caused the Volatility
index (VIX) to quickly fall back to near the 3-year low recorded last month (see
chart below). Due to the VIX's unusually low level, a relatively cheap way to
insure against a significant (10% or greater) short-term stock market decline
would be to purchase $20.00 VIX call options expiring in December. As is the
case with most forms of insurance, the premium paid for these options would have
to be written off if the insured-against event didn't happen.
This week's
important US economic events
| Date |
Description |
| Monday Sep 10 |
Consumer Credit
| | Tuesday Sep 11 |
International Trade Balance
| | Wednesday Sep 12 |
Import and Export Prices | | Thursday
Sep 13 |
FOMC Policy Statement followed by Bernanke press conference
PPI
Treasury Budget
|
| Friday Sep 14 |
CPI
Retail Sales
Industrial Production
Consumer Sentiment
|
Gold and
the Dollar
Gold
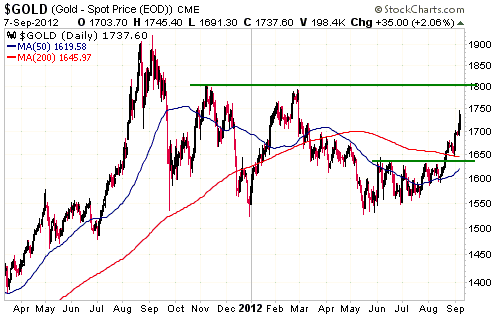
In the 3rd September Weekly Update, with gold trading at around $1690, we wrote:
"On a short-term basis the gold market is not as extended to the upside as
the silver market. Support looks solid at around $1640 (about $50 below the
current price), while significant resistance lies more than $100 above the
current price. The risk/reward equation therefore still warrants a short-term
bullish outlook, but this outlook will almost certainly drop to "neutral" if
gold moves up to the mid-$1700s during the first half of September and there is
no significant change in the monetary backdrop."
The general misinterpretation of the ECB's new bond-buying program to the
contrary, there hasn't been a significant change in the monetary backdrop since
we wrote the above. Therefore, with gold having just risen to the mid-$1700s our
short-term gold market outlook has shifted from "bullish" to "neutral".
Here's how we see the short-term risk/reward equation: In the absence of a new
QE program from the Fed, the best that gold can reasonably be expected to do
over the next few weeks is test resistance at around $1800. At the same time, a
normal correction could take the price back to around $1650. Furthermore, even
if the Fed surprises us and introduces a new QE program this week the gold
market probably won't do more than rally to the $1800-$1850 range before
commencing a significant correction. The reason is that a lot of QE anticipation
has already been built into the market.
As is often the case during the early stages of intermediate-term advances, the
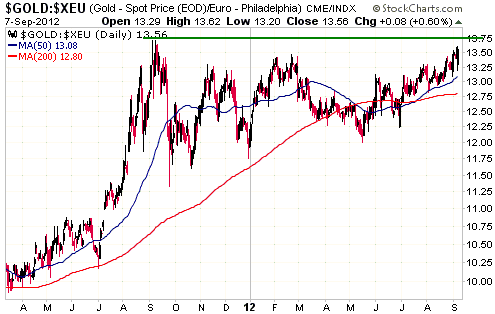
euro-denominated gold price (gold/euro) led the US$-denominated gold price to
the upside over the past few months. Gold/euro will very likely make a new
all-time high within the next three months, but it is now short-term
'overbought' as it approaches resistance defined by last year's high.
Gold Stocks
Current Market Situation
The HUI decisively broke above resistance in the low-460s last week. There's a
good chance that its upward progress will temporarily be halted by resistance in
the 480-500 range, but last week's price action caused the probability of our
"Scenario 3" to plummet (Scenario 3 involved a decline to an October-November
test of the May low and was already considered to have the lowest probability of
our three scenarios) and therefore boosted the probability that the overall
upward trend will continue until at least October-November of this year. 550
remains a reasonable upside target for the final quarter of this year.
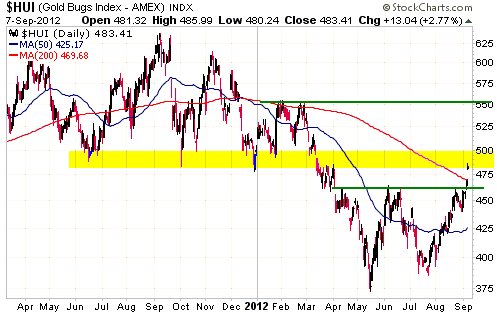
Our short-term HUI outlook will shift from "bullish" to "neutral" if the HUI
moves up to around 500 this week, because at that level there would be about 50
points of short-term downside potential to counteract the 50 points of remaining
short-term upside potential.
Some of the more speculative gold stocks have started to show signs of life.
These stocks could continue to do well, in fits and starts, even if the HUI
experiences a routine multi-week correction.
What are we doing?
When we wrote the 16th May Interim Update the HUI had just bottomed. However, we
didn't know that at the time. What we knew was that the waterfall decline of the
preceding few weeks had created such extremes of under-valuation, downward
momentum and negative sentiment that it was worth devoting most of the report to
the gold sector. After all, it isn't every day that you get the chance to take
advantage of the most extreme conditions in 10 years.
We ended our lengthy 16th May gold-sector discussion with a few paragraphs about
what we were doing. Here's part of what we wrote:
"In...[the 9th May]...Interim Update, we said:
"With regard to our own money management, we have been steadily buying gold
stocks while trying to maintain a substantial cash reserve. This has involved
picking away at stocks for which our conviction is highest and raising cash
where there is reasonable liquidity and where our conviction is not as high."
This is still the case, although over the past two trading days we bought
significantly more than we sold. This has led to a reduction in our cash
percentage from around 30% to around 25%."
We now have substantial profits on many of the buys that were made around the
middle of May. These stocks are generally still well below their highs of the
year, but that's not relevant for anyone following the scale-in/scale-out
approach. Having done a considerable amount of buying when the stocks were
dramatically 'oversold' and trading at much lower prices, we have begun to
re-build our cash reserve. We will still be buying when good opportunities
present themselves, but last week we did more selling than buying and will
continue to do more selling than buying if prices continue to rise.
Our decisions regarding what to sell will in most cases be dictated by money
management considerations. In particular, as a result of the buying we did when
prices were languishing during May-July and the recent large percentage gains,
our positions in some stocks are now too large. For money/risk management
reasons it makes sense for us to trim these positions, regardless of what we
expect to happen in the future.
One tactic that we often use at times like this is to take some money off the
table in the stocks that have rocketed upward and put some additional money into
the ones that haven't yet made meaningful up-moves, with the process involving a
net addition to the cash reserve.
Currency Market Update
As we've noted in previous TSI commentaries, the currency market generally takes
evidence of increased monetary inflation as bullish for the euro and bearish for
the US$. This is regardless of whether the inflation is in the euro supply or
the US$ supply. Therefore, when the odds appeared to shift in favour of more
euro inflation and more US$ inflation late last week, the euro rose sharply and
the Dollar Index fell sharply.
According to the RSI shown at the bottom of the following daily chart and the
Dollar Index's position relative to its 200-day moving average, the Dollar Index
is now short-term 'oversold' for the first time since late-October of last year.
This paves the way for a multi-point Dollar Index rebound to begin immediately
or following a final downward spike in reaction-to/anticipation-of this week's
Fed news.
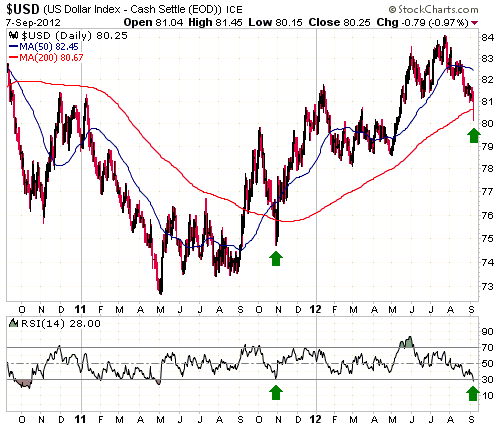
Our short-term US$ outlook has shifted from "neutral" to "bullish". As we see
it, there is rebound potential to around 83 and additional short-term downside
potential to around 79.
Update
on Stock Selections
Notes: 1) To review the complete list of current TSI stock selections, logon at
http://www.speculative-investor.com/new/market_logon.asp
and then click on "Stock Selections" in the menu. When at the Stock
Selections page, click on a stock's symbol to bring-up an archive of
our comments on the stock in question. 2) The Small Stock Watch List is
located at http://www.speculative-investor.com/new/smallstockwatch.html
 Company
news/developments for the week ended Friday 7th September 2012: Company
news/developments for the week ended Friday 7th September 2012:
*Endeavour Mining (EDV.TO, EVR.AX) reported that construction work at its
Agbaou mine in Cote d'Ivoire was on track (production is scheduled
to commence in Q1-2014) and that the results of new exploration
drilling at this project would likely allow for an extension of the
mine life. The current estimate for Agbaou's gold resource comprises
1.2M ounces in the M&I category. A new estimate will be done once
all assays from the current drilling program are received.
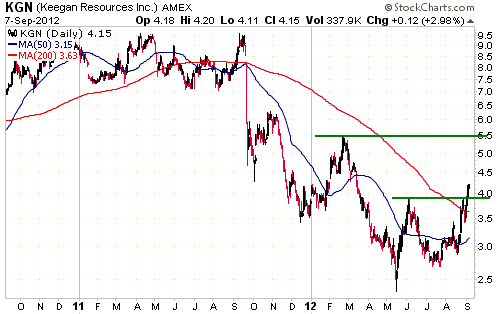
*Keegan Resources (KGN) issued an update on the status and plans for its
Ghana-based Esaase gold project. Much of the information included in
this update was also included in the quarterly MD&A issued last
month, but KGN's management probably figured that many shareholders
and prospective shareholders never get around to reading the
quarterly reports, and therefore that a project update should be
provided as a separate PR.
KGN reiterated that it is going smaller with the goal of improving
the economics and 'financeability' of the Esaase project.
Specifically, by opting for a smaller processing plant and
selectively mining higher-grade ore, KGN expects to be able to
reduce the project's capital cost from above $500M to below $300M
and to significantly reduce per-ounce operating costs.
Here is the most important new information in last week's press
release:
a) A revised resource estimate is scheduled to be complete during
the final quarter of this year. Since the company now plans to
selectively mine rather than bulk mine, we expect the revised
estimate to have a lower quantity of gold and a higher average grade
of gold when compared to the current estimate.
b) Rather than complete a Feasibility Study (FS) during the final
quarter of this year as previously planned, KGN's new plan is to
issue a revised Pre-FS during the first quarter of next year. This
delay to the engineering schedule has obviously been made necessary
by the proposed changes to the mine size and mining method.
KGN has rebounded strongly over the past couple of weeks and is up
by about 70% from its May low. It is now short-term 'overbought' and
is therefore not an ideal candidate for new buying, but the stock is
probably not yet close to an intermediate-term peak.
Pretium
Resources (TSX and NYSE: PVG). Shares: 94M issued, 101M fully diluted. Recent
price: C$13.85
PVG reported the latest in a long line of excellent drilling results last
Friday. An intercept in step-out hole SU-526 graded 4195-g/t gold over 1.16m.
The current drilling program will continue into the final quarter of this year,
so drilling news from PVG should continue to be a weekly or bi-weekly event.
PVG also reported an interim resource update for the Brucejack high-grade
deposit. The new estimate for the "Valley of the Kings" zone comprises 5.1M
ounces of gold in the Indicated category plus 5.1M ounces of Inferred gold. This
amounts to a small increase in the Indicated component (the previous estimate
was 4.9M ounces) and a large decrease in the Inferred component (the previous
estimate was 10.4M ounces). The total estimated resource has therefore declined
by about 5M ounces.
The reason for the lowered estimate is a more stringent interpretation of the
geology by Snowden, the third-party consultant responsible for the calculation.
The result is a smaller overall estimate with a higher confidence level. As
stated in PVG's press release: "The updated Mineral Resource estimate for the
Valley of the Kings is significantly higher in confidence than the previous
April 2012 estimate as a result of the additional drilling and the higher
confidence in the geological interpretation used in the estimation. The
additional drilling confirms the location of the high-grade corridors and has
allowed a better estimate of the boundaries of these corridors. The updated
estimate has tightened the high-grade corridors resulting in a decrease in
tonnes; however the additional confidence has allowed the majority of the
mineralisation above 1200 mRL to be classified as Indicated."
By the time the current drilling program is completed in October there will be
about 50,000m of drilling not included in the current estimate. Snowden will
then update the estimate to account for all the non-included results. This
update will likely lead to a higher estimate that will be used in the
Feasibility Study (FS), which is now scheduled to be completed during the second
quarter of next year.
The updated resource estimate may well be higher in confidence than the previous
estimate, but it still constitutes a big negative surprise. After all, the
previous estimate was also done by Snowden and there was no indication at the
time it was announced that it was a low-confidence assessment that would likely
be revised downward in the future. Considering the drilling results announced
between the April-2012 resource update and the September-2012 re-estimate, most
people would have been expecting a significant increase. We certainly were.
PVG's stock price naturally fell sharply in reaction to Friday's news of a
surprisingly low resource re-estimate, although not as sharply as it would have
fallen if the news had come a few weeks earlier when market participants were
collectively less optimistic. As it was, after trading as low as C$12.70 PVG
recovered to end the day down by only 5.5% at C$13.85. Support at C$13.00
therefore survived another test.
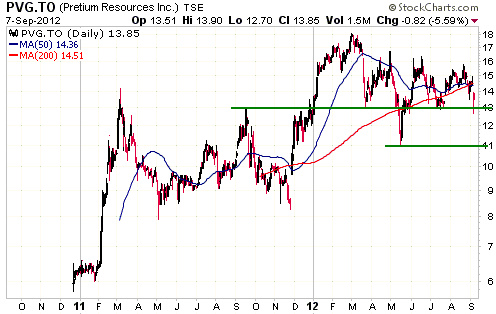
It usually isn't a good idea to buy a stock in the immediate aftermath of
company-specific negative news. Even if the news isn't bad enough to alter an
overall bullish trend (as in PVG's case), the first rebound after the
news-related plunge is usually followed by a decline to successfully test or
breach the initial low. If PVG traces out the typical pattern then Friday's low
(C$12.70) will be tested or breached after a rebound runs its course. That being
said, a lot will obviously depend on what happens on a sector-wide basis. For
example, if the Fed surprises us by introducing a new money-printing program at
this week's FOMC meeting then PVG probably won't re-visit Friday's low.
Our suggestion is to wait for the dust to settle before taking any new action
with regard to PVG shares.
Mansfield
Resources (TSXV: MDR). Shares: 65M issued, 83M fully diluted (including the
Sep-2012 financing). Recent price: C$0.75
We've seen a lot of poorly timed and poorly negotiated equity financings from
junior mining companies in our time, but the one announced by MDR on Friday is
right down there with the worst of them. With the stock price at C$0.75, the
company's management has agreed to sell 14M shares at C$0.40. Furthermore, the
equity sale has actually been priced at less than C$0.30/share when the value of
the 2-year C$0.60 warrant that comes with every new share is accounted for. And
as if to rub salt into the wound, the company is paying a finders fee to whoever
negotiated this "coyote-ugly" deal. In effect, MDR's management has increased
the company's share count by about 50% to raise only $14.3M ($5.75M now and an
additional $8.6M when the warrants are exercised). The financing was obviously
arranged when the stock price was in the mid-C$0.40s, but still...
MDR has its hands on a very good gold deposit in a bad location (Argentina). It
has higher-than-average risk and continues to have a lot of upside potential,
although the upside potential has been materially reduced by the latest
financing.
Due to the dilution caused by and the management incompetence revealed by last
Friday's financing announcement, we are going to remove MDR from the TSI List
and record a loss of almost 50% based on our October-2011 entry price of C$1.37.
We own shares in the company that we don't plan to sell immediately, but we will
be looking for an opportunity to exit over the months ahead.
By the way, MDR's financing wouldn't be a major negative if all existing
shareholders were given the chance to participate. The company needs more money
to continue the development of its gold project and raising the money at a low
price would be fine if all existing shareholders were able to take advantage of
the low price. For example, when Copper Fox (CUU.V) needed more money in 2009 to
ensure its survival, all shareholders were given the opportunity to buy new
shares at the heavily discounted financing price. This meant that any
shareholder who wanted to prevent their stake in the company from being diluted
by the low-priced financing could do so.
GDXJ
Trading Position
For TSI record purposes, we will exit the GDXJ short-term trading position if
GDXJ trades at $23.90 this week.
Chart Sources
Charts appearing in today's commentary
are courtesy of:
http://stockcharts.com/index.html
http://www.bloomberg.com/

|
