


--
Weekly Market Update for the Week Commencing
10th October 2016
Big Picture
View
Here is a summary of our big picture
view of the markets. Note that our short-term views may differ from our
big picture view.
The BULL market in US Treasury Bonds
that began in the early 1980s ended in early-2015, but there will be many years
of topping action in bond prices and bottoming action in bond yields before
major new trends get underway. (Last update: 29 June 2015)
The stock market, as represented by the S&P500 Index,
commenced
a secular BEAR market during the first quarter of 2000, where "secular
bear market" is defined as a long-term downward trend in valuations
(P/E ratios, etc.) and gold-denominated prices. This secular trend will bottom sometime between 2018 and 2020.
(Last update: 29 June 2015)
A secular BEAR market in the
US
Dollar
began during the final quarter of 2000 and ended in July of 2008. This
secular bear market will be followed by a multi-year period of range
trading.
(Last
update: 09 February 2009)
Gold commenced a
secular bull market relative to all fiat currencies, the CRB Index,
bonds and most stock market indices during 1999-2001.
This secular trend will peak sometime between 2018 and 2020.
(Last update: 29 June 2015)
Commodities,
as represented by the CRB Index, commenced a
secular BULL market in 2001 in nominal dollar terms. The first major
upward leg in this bull market ended during the first half of 2008, but
a long-term peak won't occur until 2018-2020.
(Last
update: 29 June 2015)
Copyright
Reminder
The commentaries that appear at TSI
may not be distributed, in full or in part, without our written permission.
In particular, please note that the posting of extracts from TSI commentaries
at other web sites or providing links to TSI commentaries at other web
sites (for example, at discussion boards) without our written permission
is prohibited.
We reserve the right to immediately
terminate the subscription of any TSI subscriber who distributes the TSI
commentaries without our written permission.
Outlook Summary
Market
|
Short-Term
(1-3 month)
|
Intermediate-Term
(6-18 month)
|
Long-Term
(2-5 Year)
|
|
Gold
|
N/A |
Bullish
(10-Oct-16) |
Bullish
|
|
US$ (Dollar Index)
|
N/A |
Neutral
(17-Aug-16) |
Neutral
(19-Sep-07) |
|
US Treasury Bonds (TLT)
|
N/A |
Bearish
(19-Oct-15)
|
Bearish |
|
Stock Market (DJW)
|
N/A |
Bearish
(19-Sep-16)
|
Bearish |
|
Gold Stocks
(HUI)
|
N/A |
Bullish
(10-Oct-16) |
Bullish
|
|
Oil |
N/A |
Neutral
(26-Oct-15) |
Bullish
|
|
Industrial Metals
(GYX)
|
N/A |
Neutral
(10-Oct-16) |
Bullish |
Notes:
1. Our short-term expectations are discussed in the commentaries, but except in
special circumstances we won't attempt to assign a "bullish", "bearish" or
"neutral" label to these expectations.
2. The date shown below the current outlook is when the most recent outlook change occurred.
3. "Neutral" means that we think risk and reward are roughly in balance with respect to the timeframe in question.
4. Long-term views are determined almost completely by fundamentals and intermediate-term views
are determined by a combination of fundamentals, sentiment and technicals.
Last week's posts at the TSI Blog
Inflation has always been about theft
Wearing blinders when analysing China
Summary of current
thinking/positioning
1) No longer hedged via put
options against short-term downside in gold and the associated mining
stocks (due to options having been exited in response to last week's price
plunge), but still hedged via a substantial cash reserve. Expecting large
gains in gold-related investments over the next two years, but not
expecting much with regard to the next 6 months.
2) Gradually
increasing exposure to non-gold commodity-related stocks during periods of
price weakness in anticipation of 2017-2018 being a very bullish period
for commodities. Thinking that the early-2016 lows could be tested prior
to the start of the aforementioned bullish period.
3) Still betting
(via options) on a near-term decline in the US stock market while
continuing to acknowledge that October-2016 could produce a stock-market
high (as per 2007) rather than the short-term low we are positioned for.
The market will almost certainly 'tip its hand' this week.
4)
Thinking that the Yen is topping, that the commodity currencies are still
in consolidation mode with a risk of testing their early-2016 lows, and
that following last week's breakdown the British Pound will soon (within
the next few months) make a low of similar magnitude to the major bottom
of early-1985.
5) Maintaining a large cash reserve in recognition
of the downside risk in almost all equities (current cash percentage is
around 50%), but looking for opportunities to reduce cash and add to gold
plus commodity exposure.
The ECRI's
Leading Indicators
A private organisation called
the Economic Cycle Research
Institute (ECRI) has been making economic growth and "inflation"
forecasts for decades. Its forecasting record is far from perfect, but it
is vastly superior to that of the Federal Reserve.
Here is a chart
from the ECRI's web site showing an index designed to predict the rate of
US GDP growth. The index has just moved to an 8-year high, although in its
commentary the ECRI cautions that this optimistic growth prediction should
not be taken at face value due to the distortions caused by Fed policy.
For example, thanks to the desperate grab for yield prompted by the Fed,
credit spreads are generally much narrower than they should be. According
to the ECRI, when all data are taken into account the expectation is for
continuing lacklustre economic performance.
And here is a chart that we created to compare the ECRI's Future
Inflation Gauge (FIG) with the Fed Funds Rate target. This chart's message
is that "price inflation" will soon begin to pick up and that the Fed is
now so far 'behind the curve' that 'the curve' cannot even be seen from
where the Fed is positioned.
If the FIG is correct then the T-Bond
yield will be a lot higher in a year's time than it is today.

The T-Bond
Whipsaw
In September, the iShares 20+
Year Treasury ETF (TLT) broke below lateral support at 137 and plunged to
around 133. It then rebounded. A counter-trend rebound within an on-going
downward trend 'should' have ended at or below 137, which means that TLT
signaled an end to its downward trend when it rose to around 139 in
late-September. However, it has since dropped sharply and tested its
September low of 133 last Friday.
If 133 gives way in the near
future then the short-term target will be support at 127-128.

We will be surprised if TLT does any worse than test the 127-128
support range over the remainder of this year, but the potential exists
for it to trade a lot lower within the coming 12 months.
The Stock Market
The US
Valuation is the elephant in the room
The absence of earnings growth for almost 2 years and the likelihood
that earnings growth will remain weak over the quarters immediately ahead
would not be a good reason to shun the US stock market if the lack of
growth was factored into current prices. The problem is that according to
the most reliable measures, the current valuation of the US stock market
is near an all-time high.
On a market-wide basis one of the best
valuation measures is the price/sales (or price/revenue) ratio. The
price/sales ratio is much better than the popular price/earnings ratio for
three reasons.
First, earnings can be manipulated by accounting
tricks to a far greater extent than sales.
Second, earnings are
strongly influenced by profit margins, which are mean-reverting. To
further explain, unusually-high profit margins will result in earnings
being unusually-high relative to sales and will therefore make
price/earnings ratios look more attractive than price/sales ratios, but
unusually-high profit margins are NEVER sustainable.
Third, in
extreme situations such as occurred during 1930-1932 and 2008-2009, a
collapse in stock prices can go hand-in-hand with an even greater collapse
in earnings. This causes the average price/earnings ratio to spike upward,
creating the impression that valuations are becoming much higher at the
very time they are actually becoming much lower.
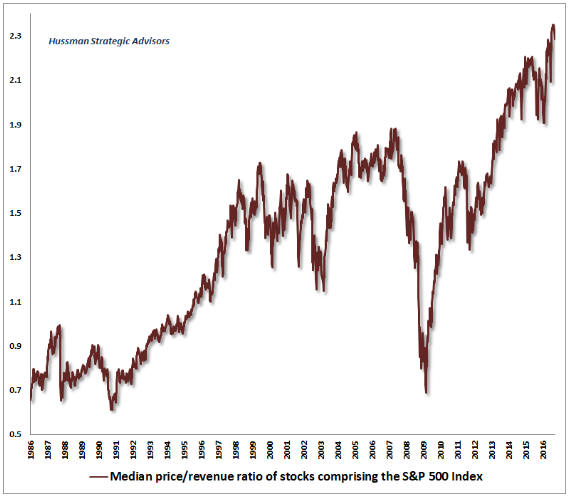
The following
chart from a
recent article by John Hussman shows that the median price/sales ratio
of the stocks that comprise the S&P500 Index (SPX) is at an extreme. In
particular, it shows that the median SPX stock is much more expensive now
than it was at the major stock market peaks of 2000 and 2007.
Current Market Situation
Although the senior US stock indices only had to move by small amounts to
the upside or the downside last week to effect breakouts, they managed to
avoid breaking out. While it is technically possible that they will also
avoid breaking out this week, they will have to trade sideways to do so.
The Dow Industrials Index, for example, will have to remain very close to
its current level of 18240 on a daily closing basis throughout this week
to avoid breaking above the downward-sloping trend-line from the August
high or the upward-sloping trend-line from the September low.
The Dow Transportation Average (TRAN) remains close to important
resistance at 8150. If it can achieve a weekly close above 8150 it will
remove the US stock market's only significant bearish divergence.
Naturally, a downward reversal from near the current level will leave this
divergence intact.
We expect that there will be quick 1-2 week moves in the senior stock
indices in the direction of the eventual breakout. After the breakout
occurs we will consider the implications.
This week's
significant US economic events
[Notes:
1) The most important events
(to the markets) are shown
in bold. 2) A list of global economic events can be found
HERE]
| Date |
Description |
|
Monday October 10 |
No important events scheduled |
| Tuesday
October 11 |
No important events scheduled |
|
Wednesday October 12 |
FOMC Minutes |
|
Thursday October 13 |
Import and Export Prices
Treasury Budget |
|
Friday October 14 |
PPI
Retail Sales
Business Inventories
Consumer Sentiment |
Gold and the Dollar
Gold
Last week's quick decline by the US$ gold price to the vicinity of its 200-day
MA wasn't a surprise. It certainly wasn't a guaranteed outcome (there were other
realistic possibilities), but it was the most likely outcome. Importantly, it
has significantly reduced both the short-term and the intermediate-term risk.
Support in the low-$1200s defines the short-term downside risk, in our
opinion. This is only about 3% below Friday's low of $1243.
Our view is that the gold price either made a short-term bottom at $1243 on
Friday or will make a short-term bottom somewhere in the $1200-$1243 range
within the next two weeks. A 1-2 month rebound will probably then get underway,
but we expect that the overall correction will extend into the first quarter of
next year.
One reason to expect that there will be several more months
of corrective activity is that there has not yet been a meaningful improvement
in the Commitments of Traders (COT) situation. As illustrated below, at this
stage there has been only a modest tapering of the speculative net-long
position.
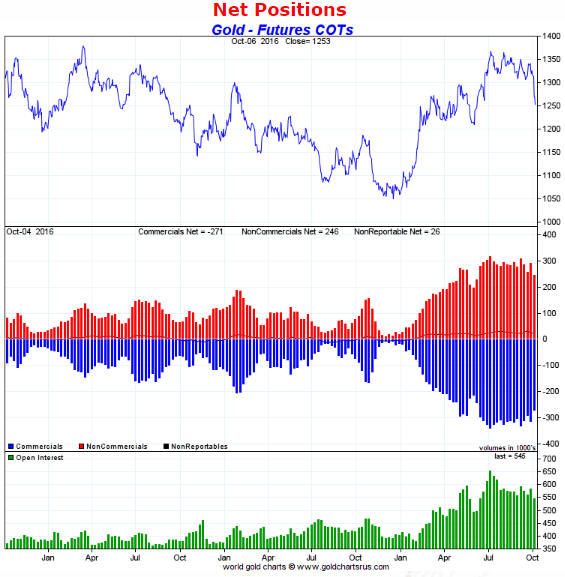
Chart source:
http://www.goldchartsrus.com/
Another reason is discussed in some
detail in the Gold Stocks section below, which is that corrections following
strong intermediate-term advances usually take a certain amount of time in
addition to a certain amount of price weakness. A typical amount of price
weakness (the decline to the 200-day MA) has already occurred, but there has
been insufficient time since the peak for a new intermediate-term advance to
begin.
Silver
Silver is in a similar position to
gold, having broken below critical support last week and plunged to the 200-day
MA. We think that support at $16 defines the short-term downside risk, although
it's possible that a short-term bottom is already in place.
Platinum
The $1200 support level for gold and the $16
support level for silver are equivalent to the $950 support level for platinum.
The following chart shows that platinum has already reached this support.
At current prices platinum is a better investment than either gold or
silver. This is partly because the platinum price has already dropped back to
support defined by its May low, but mainly because the platinum price is near
the bottom of its 30-year range relative to both gold and silver. Here's a
long-term weekly chart of the platinum/silver ratio.
The long-term risk with platinum is lower demand from the automotive
industry as the increasing popularity of electric cars reduces the production of
catalytic converters (platinum's use in autocatalysts accounts from about 40% of
the metal's global consumption), but other sources of demand will potentially
offset reduced demand from the auto industry. For example, if inflation-fear
starts to pick up then increasing speculative demand for platinum as an
inflation play could swamp any decline in the auto industry's use of the metal.
Also worth mentioning is that the platinum market lives hand to mouth
(demand is mostly satisfied by current mine output) and that more than 70% of
the world's platinum supply comes from South Africa. This creates the potential
for something that is impossible in the gold and silver markets: a supply shock.
Gold Stocks
Current Market
Situation
Our view was that a gold-market correction would likely
result in the gold price dropping back to its 200-day MA and that this would
cause the HUI to drop back to support in the 190s. As illustrated by the
following chart, the most likely level for a HUI correction low was touched on
Friday 10th October. Does this mean that a multi-month price bottom is in place
and that the correction is over?
A
multi-month price bottom could be in place, but there are other realistic
possibilities and we don't have a strong opinion on the matter. More
importantly, even if a multi-month price bottom is in place it's unlikely that
the overall correction is complete. We'll now explain what we mean.
First, a strong employment report and a resultant sharp decline in the gold
price last Friday would have greatly increased the probability that the
short-term sell-off was over and that a tradable 1-2 month rally was about to
begin. Instead, there was a 'so-so' employment report and a flat day for gold
bullion and the gold-mining indices. This leaves the door open for the HUI to
spike to a new correction low before making a short-term bottom -- either
immediately or following a multi-day consolidation. That being said, if a
short-term bottom is not already in place then it will probably be put in place
within a few percent of last Friday's low.
Second, while corrections that
follow the sort of gold-sector rally that occurred during January-August of this
year can make their price lows within two months of the top, it usually takes at
least 6 months for the overall period of corrective activity to end. The two
most relevant examples from history are the 2001 and the 2002-2003 corrections.
If this year's rally was the first intermediate-term upward trend in a new
cyclical bull market then the most relevant comparison is with the correction
that began at the May-2001 peak. As illustrated below, for all intents and
purposes the 2001 correction bottomed in price terms within two months of the
peak, but it didn't end until about 6 months after the peak (November-2001).
Furthermore, it was almost 9 months after the May-2001 peak before the bull
market made a new high.
The most relevant comparison may well be with the 2001 correction, but the
price action since the August-2016 peak is more similar to the price action
following the June-2002 peak than the price action following the May-2001 peak.
In particular, whereas it took 6 months for the HUI to reach its 200-day MA
after peaking in May-2001, as has occurred this time around the 200-day MA was
reached during the 2002-2003-correction's initial 2-month decline.
The
following chart shows that the price low of the 2002-2003 correction was put in
place within 2 months of the June-2002 peak, but that corrective activity
continued until March-2013 and that it took almost a year for the bull market to
make a new high.
The lesson from 2001-2003 is that the HUI's next intermediate-term upward
trend won't begin until at least the first quarter of 2017 and that a sustained
break above the August-2016 peak won't happen until at least the second quarter
of 2017. In the meantime there will probably be one or two tradable 1-2 month
rallies followed by pullbacks to the 200-day MA or lower.
That's
assuming we are dealing with a new cyclical bull market, which is the most
likely scenario but far from a certainty.
The case against the
new-bull-market scenario has two supports. First, gold's 'true fundamentals'
have not yet turned definitively bullish. There have been times over the past 12
months when the fundamental scales were tipped in the bullish direction, but the
bullish skew was never decisive and never sustained beyond 2-3 months. Second,
of all the gold-mining rallies from multi-year price lows, in terms of raw price
action the one that began in January of this year continues to most closely
resemble the one that began in 1982. This is a cause for concern because the
1982-1983 rally was a rebound within a bear market.
Here's our updated
chart comparing the HUI from its January-2016 bottom (the blue line) with the
Barrons Gold Mining Index (BGMI) from its 1982 bottom. In percentage terms, this
year's rally didn't quite match the rally from the 1982 bottom, but the timing
of the peaks was nearly identical. If the timing of a multi-month price low is
also identical then the HUI will achieve it lowest weekly close on 21st October.
The best thing about the current situation is that regardless of whether we
are dealing with an intermediate-term bull-market correction or a bear-market
rebound along the lines of 1982-1983, a tradable 1-2 month up-move will probably
soon begin.
What are we doing?
We are hoping for some additional near-term weakness in the gold-mining sector.
The reason is that we had several under-the-market buy orders in place for
gold-mining stocks last week and only one of these orders was filled. However,
we have no intention of being aggressive in our efforts to boost our gold-mining
exposure, because if the prices at which we want to buy aren't reached over the
coming 1-2 weeks then they will probably be reached when the October low is
tested late this year or early next. Furthermore, we have our 'core' exposure to
cover us in the unlikely event that an intermediate-term rally begins without
the expected additional corrective activity.
The Currency Market
Foreign exchange reserves, what are they good for?
Absolutely nothing! Well, that's not entirely true. They can be used to
manipulate exchange rates, but they serve no genuinely-useful purpose.
Many commentators speak of the US dollar's reserve status as if it is bestowed
upon the US currency by governments, central banks and/or supranational
organisations, and as if the so-called reserve status causes the international
demand for the US$ to be much greater than would otherwise be the case. However,
this line of thinking is back-to-front. The cause-effect relationship is
actually the other way around.
The fact is that the US$ is by far the
most popular reserve currency BECAUSE it is by far the most widely used/accepted
currency for international trading and investing. Official institutions have no
say in the matter. In other words, the cause is the US dollar's popularity
within the private sector as an international medium of exchange and the effect
is the US dollar's domination of foreign exchange (FX) reserves in the coffers
of central banks.
The situation is easier to understand if the true
purpose of FX reserves is appreciated.
Under the monetary system in place
for the past few decades, FX reserves are not held for the purpose of backing a
currency (the value of a country's money has nothing to do with the amount of FX
reserves held by the country's central bank). Furthermore, FX reserves will not
automatically accumulate at the central bank of a country running a trade
surplus.
What happens is that FX reserves are bought by central banks as
part of a misguided effort to obtain a trade advantage. Specifically, FX
reserves are purchased using local currency created out of nothing, which puts
downward pressure on the exchange rate of the local currency and supposedly
gives the local economy an advantage by cheapening its products on international
markets. The theory behind this course of action is completely wrong, because
even if there were no detrimental knock-on effects the action would only
transfer wealth to exporters from the rest of the economy. There could not
possibly be an economy-wide benefit. However, the knock-on effects of the action
are more than a little detrimental, with the main issue being that the creation
of local currency out of nothing eventually and inevitably causes mal-investment
and an inflation problem.
At some point the inflation problem stemming
from the earlier efforts to lower the exchange rate via the accumulation of FX
reserves becomes the central bank's top priority. At this point the local
currency's exchange rate will be in a major downward trend and the central bank
will start selling FX reserves (and buying the local currency) as part of an
effort to address the inflation problem.
The process repeats over and
over again, with FX reserves first bought using newly-created local currency in
an attempt to gain a trade advantage and then sold in an effort to support the
local currency after the earlier monetary inflation naturally leads to major
economic problems. For a specific example, refer to Brazil's experiences over
the past 12 years.
As long as they remain guided by wrongheaded Keynesian
and Mercantilist theories, central banks will have no choice other than to
denominate most of their FX reserves in the most commonly-used currency for
international trade. All other considerations, including the composition of the
SDR, will be irrelevant.
The Pound gets pounded
The British Pound broke below the bottom of its 3-month range early last
week, with the catalyst for the breakdown being confirmation that Britain's
formal separation process from the EU would begin at the end of the first
quarter of next year. The selling then fed on itself, especially after German
Chancellor Merkel suggested that the EU would take a hard line in the
negotiations with Britain.
To add insult to injury there was even a
"flash crash" in the Pound during early Asian trading on Friday, with the
currency falling 8 cents in a matter of minutes and momentarily trading below
120 before rebounding. The "flash crash" doesn't appear on the following daily
chart, but it can be seen in a chart included in the article linked
HERE.
The following long-term monthly chart from Moore
Research Centre puts the current situation into perspective. Apart from a
few months during 1984-1985, the Pound is now trading at its lowest level
(relative to the US$) in history.
In early-1985, a waterfall decline in the Pound ended at around 104. Before
the end of 1985 the price had recovered to 140 and by early-1988 the price was
around 190.
Considering the extent to which the Pound has been driven
downward by sentiment, the speed of recovery from the next bottom could be
similar to the speed of recovery from the 1985 bottom. However, a bottom first
has to be found.
A few months ago we accumulated a long-term position in
the Pound (via a currency deposit) in the low-130s. We are interested in
doubling this position, but our plan is to wait for evidence of a turnaround
before doing so.
The way things are going, a major bottom for the Pound
will align with the prediction of a remarkably consistent 8-year cycle that
dates back to the 1976-1977 low. The cycle lows are marked by green arrows on
the above chart. The next cycle low is due in early-2017, but a low anytime
between now and mid-2017 would be a reasonable fit.
The Dollar Index
The Dollar Index broke
above short-term trend-line resistance last week, but the bigger picture is that
the choppy upward trend from the May-2016 low has done no more than take the US$
back to the middle of its 20-month horizontal trading range.
We will
remain intermediate-term neutral on the Dollar Index pending a clue as to the
direction of the eventual breakout from the horizontal range.
Updates
on Stock Selections
Notes: 1) To review the complete list of current TSI stock selections, logon at
http://www.speculative-investor.com/new/market_logon.asp
and then click on "Stock Selections" in the menu. When at the Stock
Selections page, click on a stock's symbol to bring-up an archive of
our comments on the stock in question. 2) The Small Stock Watch List is
located at http://www.speculative-investor.com/new/smallstockwatch.html
 Company
news/developments for the week ending Friday 7th October 2016:
Company
news/developments for the week ending Friday 7th October 2016:
[Note: AISC = All-In Sustaining Cost, FS = Feasibility Study, FY = Financial
Year, IRR = Internal Rate of Return, ISR = In-Situ Recovery, MD&A = Management
Discussion and Analysis, M&I = Measured and Indicated, NAV = Net Asset Value,
NPV(X%) = Net Present Value using a discount rate of X%, P&P = Proven and
Probable, PEA = Preliminary Economic Assessment, PFS = Pre-Feasibility Study]
*Premier Gold (PG.TO) has completed the acquisition
of the Mercedes gold mine (Sonora State, Mexico) from Yamana Gold. We discussed
the details of this acquisition in the 1st August and 8th August Weekly Updates.
The Mercedes mine has a P&P gold reserve of 400K ounces (within a 782K-oz
M&I resource) and is expected to produce 85K-90K ounces of gold per year. With
this mine and its 40% stake in the South Arturo mine operated by Barrick Gold,
PG is now a 140K-oz/year gold producer.
At the current gold price we
roughly estimate that PG's gold-producing assets are worth C$3.50/share. The
rest of PG's value is associated with its undeveloped gold-mining assets, by far
the most important of which is its 50% stake in the Trans-Canada (TC) project in
Ontario.
Based on the PEA completed way back in early-2014 and the amount
that Centerra Gold agreed to pay for the other 50%, we estimate that the TC
project is worth at least C$1 per PG share. However, it could be worth a lot
more than that. The results of the FS for this project should be published
within the next two months, enabling its value to be more accurately quantified.
List
of candidates for new buying
From within the ranks of TSI stock
selections the best candidates for new buying at this time, listed in
alphabetical order, are:
1) AAU near US$1.00 (last Friday's closing
price: US$1.22)
2) ESM.TO near C$1.00 (last Friday's closing price:
C$1.14)
3) EVN.AX near A$2.00 (last Friday's closing price: A$2.23)
3) PG.TO (last Friday's closing price: C$3.41)
4) PRQ.TO (last
Friday's closing price: C$2.05)
Note that the above list is limited to
five stocks. It will sometimes contain less than five, but it will never contain
more than five regardless of how many stocks are attractively priced for new
buying.
Chart Sources
Charts appearing in today's commentary
are courtesy of:
http://stockcharts.com/index.html
