|
-- Weekly Market Update for the Week Commencing 10th November 2003
Big Picture
View
Here is a summary of our big picture
view of the markets. Note that our short-term views may differ from our
big picture view.
Bond yields (long-term interest
rates) reached a major low in June of 2003 and will trend higher until
at least mid 2004.
The US stock market will reach
a major bottom (well below the October-2002 low) during 2004.
The Dollar commenced a bear
market in July 2001 and will continue its decline during 2003 and 2004.
A bull market in gold stocks
commenced in November 2000 and will continue during 2003 and 2004.
Commodity prices, as represented
by the CRB Index, will rally during 2003 and 2004 with most of the upside
occurring in 2004.
Commodities:
Beneficiaries of the inflation
We've included, below, extracts from
commentaries we wrote in October and November of 2001. Bear in mind that
at a time these commentaries were written the CRB Index was near a 20-year
low, the fear of deflation was widespread, and the consensus view was that
strong money-supply growth would have little effect on prices.
From the 8th October 2001 Weekly Update:
"We are confident that the central
banks of the world will be successful in their mission to avoid deflation,
because how could they not be? How could institutions with unlimited power
to create money, including the power to monetise every public and private
sector debt in the land if they chose to do so, not be able to depreciate
their currencies via inflation if they really set their collective minds
to the task? The US Fed has certainly set its mind to the task. No doubt
aware that the supply of money is more important than the cost of money,
the Fed is working hand-in-glove with the private banks and the GSEs (Government
Sponsored Enterprises) to rapidly expand the US money supply. This money
supply expansion is inflation. One of the effects of this inflation will
be higher prices somewhere within the economy (unless this turns out to
be the first time in the history of the world that a large and sustained
increase in the supply of money does not lead to higher prices).
The investment landscape has undergone
a change over the past 2 years and the major beneficiaries of the inflation
of the late 1990s will not be the major beneficiaries of the inflation
of 2001 and beyond. Of all the changes that have occurred we think the
one with the greatest long-term significance is the downward reversal in
the US Dollar's exchange rate. The US Dollar's rising trend over the past
several years made dollar-denominated financial assets irresistible to
investors outside the US and has helped suppress commodity prices in US$
terms. As long as the Dollar was strengthening there was little incentive
to hoard commodities because it was perceived that commodity prices (in
US Dollars) were not going to be any dearer in the future than they were
in the present. With the US$ having probably embarked on at least an
intermediate-term downtrend, we think the greatest effect of this current
bout of inflation will be seen in the prices of commodities."
From the 5th November 2001 Weekly Update:
"Our forecast for the next 12-18
months is that the high rate of inflation (money supply growth) over the
past 12 months will boost prices and that commodities will be the major
beneficiaries of the inflation. As is usually the case when commodity prices
are pushed higher by inflation, bonds will not fare well.
The above may seem like strange
things to say with the CRB Index close to its lowest level of the past
20 years and the T-Bond price approaching its 1998 peak. However, last
week's Treasury-engineered bond market rally actually solidifies our belief
that large gains in commodity prices will be seen during 2002-2003."
From the 19th November 2001 Weekly
Update:
"Substantial and sustained increases
in the supply of money always cause prices to rise. The only question is
which prices will eventually benefit from the money supply growth. If a
large proportion of the excess money is exchanged for imported goods then
the trade deficit will grow and there will be downward pressure on the
Dollar. Unless the rising trade deficit is offset by an increase in the
demand for dollars from foreign investors, the dollar will fall. If the
dollar falls then imports will become more expensive, thus allowing US-based
manufacturers to also increase their prices. If the foreign investment
demand for the dollar increases at a fast enough pace to offset the downward
pressure on the dollar exerted by the trade deficit then US asset prices
will rise. If most of the excess money is spent on domestically-produced
goods and services then the prices of those goods and services will rise.
Whatever happens, a price rise will occur somewhere as a result
of the money supply growth. Our view is that the effect of this year's
rampant money supply growth will be most evident in the prices of commodities
over the next 2 years and that bonds will continue to 'take it on the
chin'."
The above might seem like a shameless
attempt at self promotion on our part, but with commodity-related investments
having recently become the 'flavour of the month' we wanted to show that
what is happening now was foreseeable during the darkest days of 2001.
The commodity bull market is most likely
still in its infancy. In fact, all the CRB Index has done over the past
2 years is complete the right side of a long-term basing pattern (see chart
below). The CRB has strong resistance in the 250-265 range, but once above
265 we expect that a move up to the 1980 high (around 340) will occur rather
quickly (within 12 months of a breakout from the base).
Apart from the price action in the
CRB Index and many individual commodities, another reason to suspect that
the commodity bull is still young is that almost all gains to date have
come about as a result of US$ weakness. For example, the following chart
of the CRB Index divided by the euro-US$ exchange rate shows that commodity
prices have been drifting lower over the past two years when measured
in terms of a strong currency. However, all the major fiat currencies
are now being devalued through inflation at a rapid rate so commodity prices
should soon start moving sharply higher against them all.
As an aside, although CRB/euro has
been moving lower over the past 2 years the price action illustrated on
the below chart appears to be a consolidation within a continuing long-term
upward trend. This type of price action usually ends via an upside breakout.
Further to the above, we can only assume
that those who were long- or intermediate-term bearish on commodities during
the final quarter of 2001 either weren't sufficiently bearish on the US$
or didn't appreciate what a weakening dollar would do for dollar-denominated
commodity prices. And that those who are currently long- or intermediate-term
bearish on commodities don't appreciate what effect the worldwide race
to inflate is going to have on prices over the next few years.
As far as the commodity markets are
concerned, the two biggest downside risks over the coming year are that
the rate of US money-supply growth will continue to slow and that China's
growth rate, much of which is credit-induced, will slow. These are legitimate
concerns that could lead to substantial bull-market corrections in commodity
prices at some point, but aren't likely to come into play until at least
the second quarter of next year. In the short-term there is a good possibility
of moderate pullbacks based on technical factors because the prices of
some important commodities -- copper and soybeans being two examples --
have recently hit resistance.
The US
Stock Market
The market and the latest economic
news
There's been a lot of good economic
news of late, topped off by last Friday's better-than-expected Employment
Report. This news did not manage to push the stock indices sharply higher,
but then again there is no reason why it should have. The stock market
is always trying to discount the future, so while backward-looking economic
data might seem important to the public and to many financial journalists
it is of little relevance to the market.
The way the market reacts to data can,
however, provide some useful information. For one thing, a failure to react
to data would suggest that the data had not significantly altered the market's
expectations. For example, if the market had already moved prices sharply
higher in anticipation of good news then the actual announcement of good
news would be unlikely to have much effect. Currently, the market is priced
as if rapid growth over the next few years were all but guaranteed, so
there is little scope for any positive surprises. There is obviously some
scope for negative surprises, although the normal pattern is for the stock
market to turn lower months before the economic news starts to deteriorate.
In fact, at stock market peaks the economic news tends to be universally
bullish, which is why backward-looking analysts such as Alan Greenspan
are always extremely bullish at major stock market peaks.
Of more significance than the stock
market's recent failure to surge on the back of positive economic news
was its inability to capitalise on a reasonably bullish technical position
(the S&P500 appeared to be poised for an upward thrust last week, but
closed with a weekly gain of only 2 points). Furthermore, when last Friday's
impressive downward reversal in the US Dollar is considered alongside the
stock market's indecisive price action we are left thinking that a few
more weeks of consolidation might be required before the final surge (in
the stock market) gets underway.
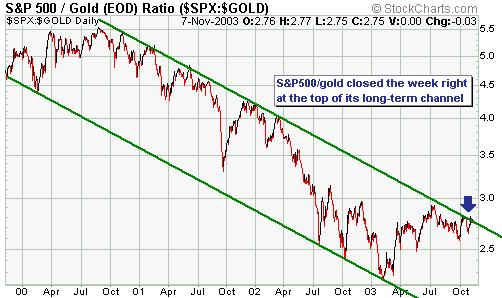
Current Market Situation
The S&P500 Index in terms of gold
has once again moved up to the very top of its long-term channel (see chart
below). Therefore, either we are about to see a major breakout or gold
is going to out-perform the S&P500 over the next few weeks. We expect
the latter.
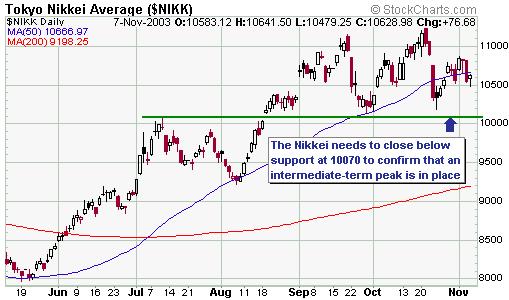
Below is a 6-month chart of Japan's
Nikkei225 Index. The Nikkei is showing signs of having made an intermediate-term
peak during the second half of September.
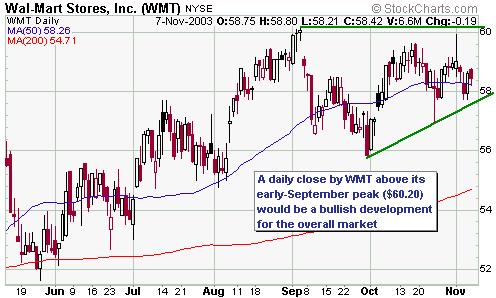
The senior US stock indices made new
highs for the year last week, but the year-to-date high in the Walmart
(WMT) stock price occurred back in early September. This is a significant
divergence because WMT has tended to lead the overall market over the past
18 months. A daily close by WMT above $60.20 would remove this divergence
and project at least 1-2 months of additional upside in the overall market.
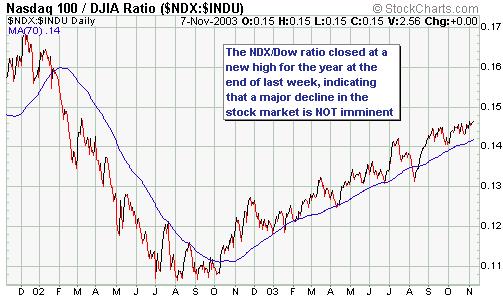
As yet, none of the bearish early warning
indicators discussed in the 29th September Weekly Update have been triggered.
Of particular importance, the NDX/Dow ratio has remained in an upward trend
and closed at a new high at the end of last week (see chart below). Just
as there is no reason to be worried about an imminent major decline in
the gold market as long as the HUI is out-performing the gold price there
is no reason to be worried about an imminent major decline in the stock
market as long as the NDX is out-performing the Dow.
By the way, we will update our list
of bearish early warning indicators over the coming week to take into account
recent price action.
This week's important economic events
| Date |
Description |
| Monday Nov 10 |
No significant events |
| Tuesday Nov 11 |
No significant events |
| Wednesday Nov 12 |
No significant events |
| Thursday Nov 13 |
Trade Balance
Import / Export Prices |
| Friday Nov 14 |
Industrial Production
PPI
Retail Sales |
 Click
here to read the rest of today's commentary Click
here to read the rest of today's commentary

|
