|
-- Weekly Market Update for the Week Commencing 10th December 2007
Big Picture
View
Here is a summary of our big picture
view of the markets. Note that our short-term views may differ from our
big picture view.
Bonds commenced a secular BEAR market in
June of 2003. (Last
update: 22 August 2005)
The stock market, as represented by the S&P500 Index, commenced
a secular BEAR market during the first quarter of 2000, where "secular
bear market" is defined as a long-term downward trend in valuations
(P/E ratios, etc.) and gold-denominated prices. This secular trend will bottom sometime between 2014 and 2020. (Last update: 22 October 2007)
The Dollar commenced a secular BEAR market during the final quarter of 2000. The
first major downward leg in this bear market ended during the first
quarter of 2005, but a long-term bottom won't occur until 2008-2010. (Last update: 28 March 2005)
Gold commenced a
secular bull market relative to all fiat currencies, the CRB Index,
bonds and most stock market indices during 1999-2001. This secular trend will peak sometime between 2014 and 2020. (Last update: 22 October 2007)
Commodities, as
represented
by the CRB Index, commenced a secular BULL market in 2001. The first
major upward leg in this bull market ended during the second quarter of
2006, but a long-term
peak won't occur until at least 2008-2010. (Last update: 08 January 2007)
Copyright
Reminder
The commentaries that appear at TSI
may not be distributed, in full or in part, without our written permission.
In particular, please note that the posting of extracts from TSI commentaries
at other web sites or providing links to TSI commentaries at other web
sites (for example, at discussion boards) without our written permission
is prohibited.
We reserve the right to immediately
terminate the subscription of any TSI subscriber who distributes the TSI
commentaries without our written permission.
Outlook Summary
Market
|
Short-Term
(0-3 month)
|
Intermediate-Term
(3-12 month)
|
Long-Term
(1-5 Year)
|
Gold
|
Bullish
(19-Nov-07)
|
Bullish
(12-Nov-07)
|
Bullish
|
US$ (Dollar Index)
|
Bullish
(11-Jun-07)
| Bullish
(31-May-04)
|
Neutral
(19-Sep-07)
|
Bonds (US T-Bond)
|
Bearish
(05-Dec-07)
|
Neutral
(23-Jul-07)
|
Bearish
|
Stock Market (S&P500)
|
Bullish
(28-Nov-07)
|
Neutral
(26-Mar-07)
|
Bearish
|
Gold Stocks (HUI)
|
Bullish
(19-Nov-07)
|
Bullish
(12-Nov-07)
|
Bullish
|
| Oil | Bearish
(23-July-07)
| Bearish
(22-Oct-07)
| Bullish
|
Industrial Metals (GYX)
| Neutral
(28-Nov-07)
| Bearish
(09-July-07)
| Bullish
|
Notes:
1. In those cases where we have been able to identify the commentary in
which the most recent outlook change occurred we've put the date of the
commentary below the current outlook.
2. "Neutral", in the above table, means that we either don't have a
firm opinion or that we think risk and reward are roughly in balance with respect to the timeframe in question.
3. Long-term views are determined almost completely by fundamentals,
intermediate-term views by giving an approximately equal weighting to
fundmental and technical factors, and short-term views almost
completely by technicals.
Making the price action fit the news
A lot of the explanations in
the financial media for why the markets did what they did on a
particular day are based on the false premise that if price move B
followed news event A, then A must have caused B. The reality, however,
is that the vast majority of price moves have nothing to do with the
news of the day because the financial markets are always attempting to
discount the future whereas news events are, by definition, things that
have already happened. Furthermore, a price change in a major
international market is the net result of millions of individual
buy/sell decisions made for a myriad of reasons, so attempting to come
up with an explanation for a daily price move -- whether the
explanation be news-related or not -- is generally a waste of time.
We were prompted to re-visit this topic by a Forbes.com article
headlined: "Oil Slides On Solid Jobs Report". We normally wouldn't
bother reading an article in the mainstream press that attempted to
explain the daily market action because such articles almost always
apply the ridiculous formula cited above (if B followed A then A must
have caused B), but we were curious to see what reasons the reporter
had come up with for why the price of an economically sensitive
commodity had fallen in response to better-than-expected economic data.
Here's what we found out: According to the writer of the aforementioned
article, the evidence of economic strength implied by the jobs report
made it less likely that the Fed would cut rates by 50 basis-points at
the upcoming FOMC meeting, which, in turn, would mean that the economy
would get less monetary stimulation, which, in turn, would lead to a
WEAKER economy and reduced demand for oil. Hmmm...low marks for logic
but high marks for imagination.
Of course, if the oil price had risen on Friday the headline would have
read: "Oil Rallies On Solid Jobs Report". And if this had been the case
then linking the news and the price action would have required less
imagination.
A bull market in bad ideas
Every government attempt to assist a special interest group involves
bad economics because the help given to the targeted group can only
come at the expense of other groups and the economy as a whole. These
attempts to 'help' continue to happen, though, because the benefits to
the targeted group are usually obvious to all and can be touted by
politicians as evidence of government benevolence, whereas the
insidious effects on the overall economy will usually be apparent only
to those with some understanding of economics who take the trouble to
think deeper than the political rhetoric.
However, the rescue plan for subprime borrowers being cobbled together
by the Bush Administration differs from the standard government
assistance scheme in that the bad economics at the heart of the Bush
plan are as subtle as a two-by-four to the head. In this case the
scheme is so inane, so unethical, and so riddled with blatantly
negative implications that even shallow thinkers with minimal
understanding of economics should be shaking their heads in disbelief.
In last week's Interim Update we briefly noted a couple of the obvious
problems that would stem from the plan to help some borrowers by
forcing lenders to keep mortgage rates at artificially low levels, but
a more in-depth analysis can be found in Peter Schiff's article at http://www.321gold.com/editorials/schiff/schiff120707.html.
Did the odds of a 50bp rate cut just become longer?
In last week's Interim Update we wrote: "Due
to the close proximity of such a finely balanced Fed policy decision,
the US monthly Employment Report due to be released on Friday morning
takes on greater importance than would normally be the case. The reason
is that even though the numbers in this report tend to bear little
resemblance to reality and will end up being revised -- perhaps
dramatically so -- in the future, they will be fresh in the minds of
the Fed representatives who attend next week's policy meeting. The
markets are therefore well aware that Friday's employment numbers have
the potential to tip the balance one way or the other. Specifically, a
very weak Employment Report would shift the odds decisively in favour
of a 50bp cut whereas an unexpectedly strong report would do the
opposite."
As it turned out, the employment numbers were a bit stronger than
expected and, in response, the Fed Funds futures market quickly
adjusted to reflect a lower probability of a 50 basis-point rate cut on
Tuesday (the market is still saying that a rate cut is a 'done deal',
but that the odds now favour it being the 25 basis-point variety).
In our opinion a 50bp cut is still close to an even-money bet because
the Bernanke Fed has demonstrated by its actions over the past 4 months
that it does not mind erring on the side of monetary laxity. However,
due to the shift in the market's expectations the reaction to a 50bp
cut will now be more pronounced than it would have been if expectations
had remained where they were last Wednesday.
The Stock
Market
Risk Aversion
Increased risk aversion has been one of the main characteristics of the
financial market environment of the past six months. Increased risk
aversion is evidenced by the widening of credit spreads, the strength
of short-term Treasuries relative to longer-term Treasuries, the
strength of large-cap stocks relative to small-cap stocks, and the
strength of gold relative to industrial metals. There are, however,
signs that at least a temporary shift back towards riskier investments
is presently underway. For example, the recent sharp rise in the
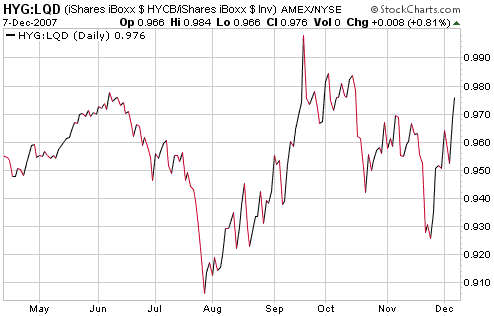
HYG/LQD ratio illustrated by the following chart tells us that
high-yield corporate debt has recently rebounded strongly relative to
investment-grade corporate debt.
The recent performance of the HYG/LQD ratio is evidence that a short-term bottom is in place for the US stock market.
Current Market Situation
There are huge problems in the financial system that have been around
for years, but have only quite recently come to light thanks to the
downturn in the US housing market and the associated collapse of the
subprime mortgage market. These problems are going to take years to
work through, especially because governments can be relied upon to come
up with more harebrained schemes to help that will actually have the
effect of prolonging the corrective process. The key to the stock
market, however, is the extent to which the problems have been
discounted, and one of the few things we have to go on when attempting
to ascertain how far the market has gone towards discounting the
problems is sentiment.
As we've noted in previous commentaries, over the past few months some
gauges of the public's sentiment have indicated extremes of negativity.
As an example, when the stock market was bottoming in August the number
of shares sold short by the public was much higher than it had EVER
been. Furthermore, when the S&P500 Index dropped back to a higher
low in mid November the level of public short-selling was even greater
than it had been at the August low.
Another noteworthy item regarding sentiment was covered in last week's
Interim Update. In that commentary we used a chart of the 10-day moving
average of the OEX put/call ratio to make the point that the "smart
money" now seemed to be less concerned than the general public (the
"dumb money") about downside risk in the stock market. This viewpoint,
by the way, is also supported by the Commitments of Traders (COT) data
in that the latest COT report shows the Commercials (the "smart money")
to be net-long S&P500 futures to the tune of 46000 contracts while
small traders (the public) are collectively net-short by 19000
contracts.
Our conclusion is that at last month's low the stock market had fully
discounted the short-term effects of the on-going debt crisis. We
suspect that the longer-term effects of the problems are still being
under-estimated, but this won't prevent the stock market from
maintaining an upward bias over the coming few months.
Our guess regarding the market's path over the coming 1-2 months is: a
peak this week (during the first two days of the week if the Fed cuts
by 25bp or during the second half of the week if the Fed cuts by 50bp),
followed by a pullback into year-end, followed by another tradable
rally.
Airlines Update
We think an intermediate-term peak is in place in the oil market and we
are bullish on the airline sector of the stock market as a result.
However, the market is not yet convinced that oil has peaked so most
airline stocks have not yet rebounded to a significant degree. The
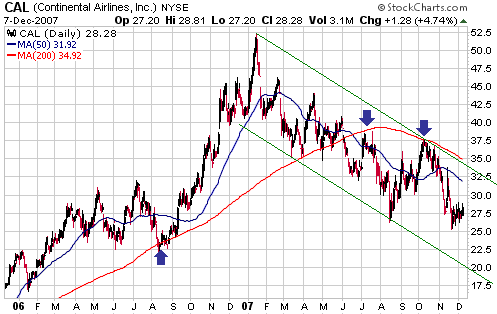
following chart of Continental Airlines (CAL), for instance, shows that
the stock is still within about 10% of its lows of the past year.
We won't be able to confidently claim that a genuine rally has begun
until CAL breaks decisively above its 200-day moving average and the
top of its downward-sloping channel.
In order for the
airlines to really 'take off' the market will have to come around to
the view that an intermediate-term downward trend is underway in the
oil market. There's no telling how far the oil price will have to drop
in order for this view to gain traction, but our guess is that it will
have to drop to the 70s.
Once the market reaches a consensus that oil is in a correction of
intermediate-term significance then daily up-moves in the oil price
will start being perceived as counter-trend moves and will stop having
such a negative effect on airline shares. In other words, it's the
perceived trend in the oil market that really matters as far as the
airline sector is concerned.
Although our primary basis for being 'long' the airline sector is our
bearish outlook for oil, our airline-related optimism is also given a
boost by valuations within the sector. For example, this Forbes.com article
notes that both Continental Airlines (CAL) and Northwest Airlines (NWA)
have single-digit P/E ratios based on what "smart" analysts expect the
companies to earn over the coming 12 months.
On a side note, we are short- and intermediate-term bearish on oil but
we are not bearish on oil-related equities. Oil stocks are influenced
as much, or more, by the trend in the broad stock market as by the
trend in the oil price. Furthermore, most oil stocks ignored the final
$20 rise in the oil price. Our expectation, therefore, is that if the
broad stock market's rally continues for a few months and the oil price
doesn't totally collapse then the oil sector of the stock market will
make new highs during the first half of next year.
Japan
Everyone knows that the Japanese economy is in a never-ending funk and
that the banks of the world are in dire straits, so it's noteworthy
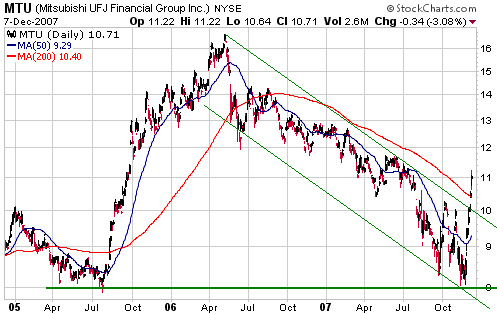
that the share price of Mitsubishi UFJ Financial Group (NYSE: MTU),
Japan's largest bank, has just broken a 19-month downward trend in
spectacular fashion (refer to the following chart for details).
MTU's performance over the past couple of week's supports our bullish
intermediate-term outlook for the Japanese stock market. We would be
buyers of MTU for an intermediate-term trade -- a trade with an
expected duration of 3-12 months -- following a pullback to the
US$9.50-$10.00 range.
This week's
important US economic events
| Date |
Description |
Monday Dec 10
| No important events scheduled
|
| Tuesday Dec 11 | FOMC Policy Statement
| | Wednesday Dec 12
| Trade Balance
Import and Export Prices
Treasury Budget
| | Thursday Dec 13
| Retail Sales
PPI
| | Friday Dec 14
| CPI
Industrial Production
Capacity Utilisation
|
Gold and
the Dollar
Gold
With reference to the following daily chart of December gold futures,
it continues to look like the gold price is tracing out a fairly
routine mid-trend corrective pattern. There still hasn't been a
material reduction in the speculative net-long position in COMEX gold
futures, however, so it won't surprise us if the price drops to around
$760 before the correction comes to an end.
Whether or not a correction low is already in place could be determined
by the outcome of Tuesday's Fed meeting. If the Fed cuts by only 25
basis-points then gold will probably drop to new correction lows before
the next upward trend gets underway, whereas a 50bp cut will probably
'kick-start' the next rally.

Gold Stocks
The gold sector of the stock market continues to behave in a way that
can best be described as bizarre. While it was underway we mentioned
repeatedly that the sector's August-November rally was extraordinarily
narrow and was generally being led by gold stocks that did not offer
high leverage to the gold price. And now we have the almost surreal
situation of many exploration-stage gold stocks trading near their
August lows even though the US$ gold price has experienced nothing more
serious than a routine pullback from its early-November peak.
It could be argued that the exploration-stage stocks are being hurt by
the market-wide shift away from risk and reduction in liquidity; but
then why has Royal Gold (RGLD), a pure play on gold with no liquidity,
cost control or political risk issues, performed in such a lacklustre
manner? And why has Gold Fields Ltd (GFI), a major gold stock that
offers plenty of liquidity as well as substantial leverage to the
Rand-denominated gold price, fared so poorly against such a positive
gold-price backdrop?
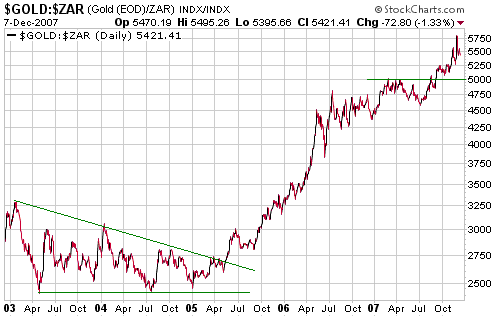
The second of these questions stems from a comparison of the following
6-year charts of GFI and the Rand-denominated gold price. Notice that
GFI's price is roughly the same now as it was when the Rand gold price
was about 50% lower.

Increases in
production costs are partially to blame for the performance of GFI's
stock price, as are events such as last week's single-day strike by
South African mineworkers. However, if this is a gold bull market then
investors should be looking beyond short-term profitability issues and
assigning values to gold producers that are based largely on their
economically-feasible gold resources. That this is not currently
happening suggests either that October's upside breakout by the HUI was
a giant 'head fake' within a cyclical bear market (a 1-2 year
correction to a primary bull market) OR that at some point over the
next few weeks stocks such as GFI will begin powerful multi-month
rallies that will take them to new all-time highs.
The current combination of rampant global inflation (money-supply
growth), rising credit and yield spreads, falling real interest rates
and abundant government stupidity clearly points to the latter outcome.
The only concern we have -- and have had for some time -- with respect
to the gold sector's short- and intermediate-term prospects is the
potential for a US$ rebound against the euro to prompt speculators to
exit their 'long of gold' positions. It must be said, however, that the
Bush-Paulson team is working feverishly to eliminate this concern of
ours by implementing policies that are virtually guaranteed to have
disastrous consequences for the US economy; and that Bernanke will
quite possibly do his part to mitigate the risk of a large US$ rally by
opting for a 0.50% rate cut this week.
From a technical perspective, one of the good things about the current
situation is that the AMEX Gold BUGS Index (HUI) remains fairly close
to important support at 400 and this support represents a clear
demarcation line between bullish and bearish. The HUI has recently had
a few opportunities to break below this support, but it has continued
to hold fast. As a result, the short-term situation is unchanged: the
downside risk and the upside potential are both substantial, but the
odds favour an upside resolution.
Currency Market Update
The US$
The ECB decided to leave its interest rate target unchanged at last
Thursday's meeting, but at a post-meeting interview the ECB's president
suggested that it had been a 'toss up' between maintaining the status
quo and opting for an interest rate HIKE. In other words, the ECB is
still taking a 'hawkish' line, at least in its public utterances. In
one important respect the ECB's on-going concerns about inflation risk
are warranted in that the total supply of euros has risen by 12.2% over
the past year.
Does the ECB's decision to maintain a tightening bias while the Fed
proceeds with its rate-cutting campaign mean that the euro will
continue to trend upward against the US dollar?
Not necessarily. The key is what happens on the interest rate front
relative to what has already been factored into current exchange rates.
For example, we know by looking at futures prices that the market is
anticipating about 75 basis-points of Fed rate CUTS and about 50
basis-points of ECB rate HIKES over the coming four months. In other
words, current exchange rates appear to be based on the expectation
that there will be an interest rate shift in the euro's favour of
around 125 basis-points over the coming 4 months. This means that if
the Fed continues to cut rates as expected while things in Europe
worsen to the point where the ECB decides not to hike rates any
further, the dollar will probably strengthen against the euro.
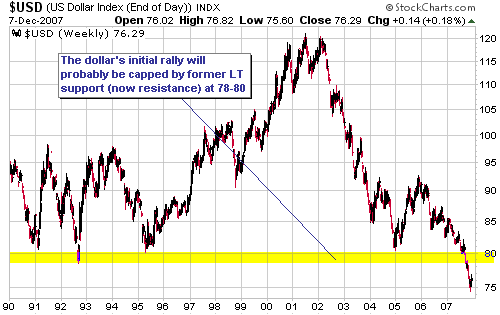
The following weekly chart of the Dollar Index highlights the former
long-term support in the 78-80 range. This former support will now act
as strong resistance.
We think the Dollar Index has commenced a bottoming process that will
take a few months to play out, with rallies capped by the
aforementioned resistance and declines taking the price back to near
the November-2007 bottom. Despite the best efforts of US monetary and
political bosses, a substantial advance should follow this bottoming
process in response to the general realisation that the European
situation does not justify a hefty euro premium.
The Commodity Currencies
The two most important commodity currencies (the currencies of
countries that rely heavily on commodity production) are the Australian
Dollar and the Canadian Dollar.
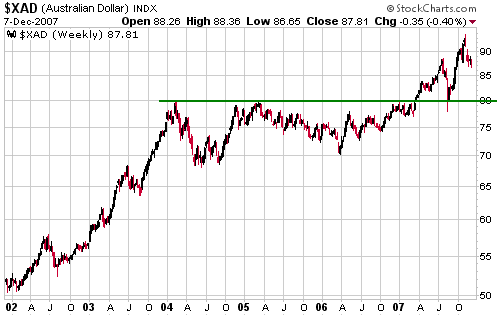
If we didn't consider anything about the A$ apart from the following
weekly chart then we would conclude that downside risk was limited to a
test of long-term support in the low-80s. But while a drop to the
low-80s at some point over the next couple of months might constitute a
good opportunity to 'go long' the currency for a short-term trade,
fundamental factors suggest that the longer-term downside risk is much
greater.
Australia recently reported a record monthly trade deficit, which is
not, in itself, a reason to be bearish on the A$ because a trade
deficit could have positive or negative causes. It could, for instance,
stem from Australia being an uncommonly attractive place for foreigners
to invest (a good thing). Alternatively, it could be a symptom of an
inflation problem (a bad thing). We found it strange, though, that a
major commodity-exporter such as Australia would be reporting a record
trade deficit in the midst of a commodity boom.
Australia has a large trade deficit because its imports are rising even
faster than its commodity-related exports, and this is happening
because the rate of domestic credit expansion is extremely high and
continuing to rise. Symptomatic of this rampant expansion of credit is
the 20.7% year-over-year growth in Australia's money supply. This is
Third-World-style monetary inflation and why we do not believe that
long-term support in the low-80s defines the downside risk.
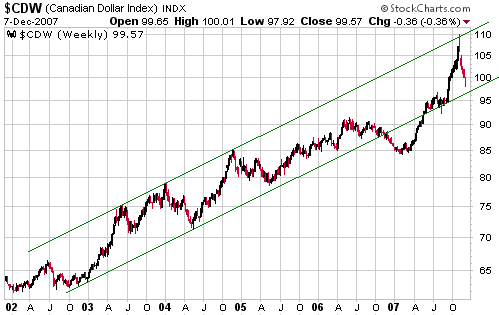
Over the past two
years, and especially over the past 12 months, the Canadian Dollar has
moved up and down with the oil price. For example, the decline in the
oil price from its July-2006 peak through to its January-2007 trough
pushed the C$ well below the bottom of the long-term channel drawn on
the following weekly chart, while the subsequent powerful upward trend
in the oil price was accompanied by a C$ rally that took the currency
all the way back to its channel top. Not surprisingly, the recent
downward reversal in the oil market has coincided with a sharp downward
reversal in the C$.
If our outlook for the oil market is correct then the C$ should trend
lower over the next several months, but we think it has a lot less
downside risk than the A$ because the supply of Canadian dollars is
rising at an annual rate of 'only' 12% (it's an indictment of what
central banks and governments around the world are doing to money that
a 12% monetary inflation rate now seems relatively tame).
Update
on Stock Selections
(Note: To review the complete list of current TSI stock selections, logon at http://www.speculative-investor.com/new/market_logon.asp
and then click on "Stock Selections" in the menu. When at the Stock
Selections page, click on a stock's symbol to bring-up an archive of our comments on the stock in question)
 Gold Fields Ltd (NYSE: GFI). Shares: 650M. Recent price: US$15.62 Gold Fields Ltd (NYSE: GFI). Shares: 650M. Recent price: US$15.62
At Friday's closing price of US$15.62 GFI's proven-and-probable gold
reserves were being valued by the stock market at only US$116 per
ounce. This is half the valuation currently being assigned to the gold
reserves of Kinross Gold, a major gold producer with a similar
political risk profile to GFI. We think this discrepancy results from
the gross under-valuation of GFI rather than the over-valuation of
Kinross.
It is, of course, possible that GFI will become available at an even
lower valuation before the market comes to its senses, but we don't
think long-term investors can go wrong accumulating the stock near its
current level. Furthermore, the potential is there for a large upward
re-rating in the short term.
 The Semis The Semis
We recently added the Semiconductor HOLDRS Trust (SMH) to the TSI List to reflect our bullish outlook on this sector.
Below is a chart of Intel (INTC), the world's largest semiconductor company. INTC shares comprise 20% of SMH's holdings.
INTC is currently testing major resistance at $27.50-$28.00. If the Fed
cuts by 50bp on Tuesday then INTC should break decisively above this
resistance this week, but if the Fed opts for a smaller rate cut then
INTC will probably spend a few weeks consolidating below $28 before
breaking out to the upside.
Chart Sources
Charts appearing in today's commentary
are courtesy of:
http://stockcharts.com/index.html
http://www.futuresource.com/

|

