|
-- Weekly Market Update for the Week Commencing 10th December 2012
Big Picture
View
Here is a summary of our big picture
view of the markets. Note that our short-term views may differ from our
big picture view.
In nominal dollar terms, the BULL market in US Treasury Bonds
that began in the early 1980s will end by 2013. In real (gold)
terms, bonds commenced a secular BEAR market in 2001 that will continue
until 2014-2020. (Last
update: 23 January 2012)
The stock market, as represented by the S&P500 Index,
commenced
a secular BEAR market during the first quarter of 2000, where "secular
bear market" is defined as a long-term downward trend in valuations
(P/E ratios, etc.) and gold-denominated prices. This secular trend will bottom sometime between 2014 and 2020.
(Last update: 22 October 2007)
A secular BEAR market in the Dollar
began during the final quarter of 2000 and ended in July of 2008. This
secular bear market will be followed by a multi-year period of range
trading.
(Last
update: 09 February 2009)
Gold commenced a
secular bull market relative to all fiat currencies, the CRB Index,
bonds and most stock market indices during 1999-2001.
This secular trend will peak sometime between 2014 and 2020.
(Last update: 22 October 2007)
Commodities,
as represented by the Continuous Commodity Index (CCI), commenced a
secular BULL market in 2001 in nominal dollar terms. The first major
upward leg in this bull market ended during the first half of 2008, but
a long-term peak won't occur until 2014-2020. In real (gold) terms,
commodities commenced a secular BEAR market in 2001 that will continue
until 2014-2020.
(Last
update: 09 February 2009)
Copyright
Reminder
The commentaries that appear at TSI
may not be distributed, in full or in part, without our written permission.
In particular, please note that the posting of extracts from TSI commentaries
at other web sites or providing links to TSI commentaries at other web
sites (for example, at discussion boards) without our written permission
is prohibited.
We reserve the right to immediately
terminate the subscription of any TSI subscriber who distributes the TSI
commentaries without our written permission.
Outlook Summary
Market
|
Short-Term
(1-3 month)
|
Intermediate-Term
(6-12 month)
|
Long-Term
(2-5 Year)
|
|
Gold
|
Bullish
(17-Oct-12)
|
Bullish
(26-Mar-12)
|
Bullish
|
|
US$ (Dollar Index)
|
Bearish
(29-Oct-12)
|
Neutral
(09-Jan-12)
|
Neutral
(19-Sep-07)
|
|
Bonds (US T-Bond)
|
Neutral
(12-Nov-12)
|
Neutral
(18-Jan-12)
|
Bearish |
|
Stock Market
(DJW)
|
Bearish
(30-Jul-12)
|
Bearish
(28-Nov-11)
|
Bearish
|
|
Gold Stocks
(HUI)
|
Neutral
(05-Dec-12)
|
Bullish
(23-Jun-10)
|
Bullish
|
|
Oil |
Neutral
(30-Jul-12)
|
Neutral
(31-Jan-11)
|
Bullish
|
|
Industrial Metals
(GYX)
|
Neutral
(30-Jul-12)
|
Neutral
(29-Aug-11)
|
Neutral
(11-Jan-10)
|
Notes:
1. In those cases where we have been able to identify the commentary in
which the most recent outlook change occurred we've put the date of the
commentary below the current outlook.
2. "Neutral", in the above table, means that we either don't have a
firm opinion or that we think risk and reward are roughly in balance with respect to the timeframe in question.
3. Long-term views are determined almost completely by fundamentals,
intermediate-term views by
fundamentals, sentiment and technicals, and short-term views by sentiment and
technicals.
Economic Numbers Update
The only two regular sets of US economic
data that we pay close attention to were published last week: the monthly ISM
data on Monday and the monthly employment data on Friday. The ISM report is a
useful coincident indicator of the US economy. The employment report is a
lagging indicator that is primarily of interest to us because the financial
markets and the Federal Reserve assign great importance to it.
The Headline ISM Index dropped to slightly below 50 (suggesting contraction)
after spending a couple of months slightly above 50. This is neither here nor
there, although it is consistent with our view that the US economy is in
recession.
The New Orders component of the ISM report tends to lead the Headline index. As
a result, we pay closer attention to the New Orders index than to the Headline
index. The following chart shows the performance of the New Orders Index since
2000, with the shaded areas marking the periods when the US economy was
officially in recession. Note that a recession is usually only officially
acknowledged 6-12 months after it begins. For example, the "great recession" of
2007-2009 began in December of 2007, but it wasn't officially acknowledged by
the NBER (National Bureau of Economic Research) until late-2008. Note also that
during the first several months of a recession it is common for the vast
majority of economists and financial-market commentators to be blissfully
unaware of the recession's existence.
It turned out that the initial plunge below 50 by the New Orders index marked
the official start of the 2007-2009 recession. However, over the ensuing 6
months the New Orders index had a slight upward bias and had recovered to around
50 by June of 2008, after which it collapsed. If this pattern is repeating then
the plunge below 50 by the New Orders index in June of this year will eventually
mark the official start of a recession.
The following chart showing Real Gross Private Domestic Investment (the blue
line) and Total Non-Farm Employees (the red line) contains the most significant
evidence AGAINST our view that a recession is in progress. Notice that the blue
line made a pronounced downward reversal prior to the start of every US
recession of the past 40 years, but that the upward trend dating back to the
2009 trough was intact as at November of 2012 (the most recent point on the
chart).
An argument could be made that it is different this time, because it really is
different this time. The decline in private investment that occurred during
2007-2009 was clearly far greater than any of the earlier recession-related
declines, and 3.5 years after the official end of the 2007-2009 recession the
amount of private investment is still a long way below where it was 6 years
prior. This is different.
The bottom line is that the US economy is weak and has been weak for many
months, but the jury is still out as to whether 2012 will officially be
acknowledged as a recession year.
Looking ahead, there's no reason to expect a genuine economic recovery to begin
in the US any time soon. A genuine recovery can't begin until the Fed stops
distorting prices via its monetary machinations, but the Fed has promised that
it won't stop distorting prices until it sees evidence that a genuine recovery
has begun. A classic "Catch 22".
The outcome of this week's
FOMC meeting will be interesting
In the 29th October Weekly Update, we wrote:
"Whereas last week's FOMC statement was almost an exact copy of the preceding
one, there's a good chance that the next statement, which will be published on
12th December, will contain some significant changes. This is because the Fed's
"Operation Twist" (selling short-dated Treasury securities and using the
proceeds to purchase long-dated securities) is scheduled to conclude at the end
of this year and probably can't be extended due to a lack of short-dated
securities. That is, one string of the Fed's 'policy accommodation bow' will
soon be no more. The question is: will the Fed find a new string to replace the
one that can no longer be used? The answer is: probably, but we should know for
sure on 12th December."
When the Fed introduced a new inflation program in mid-September the main
inflation plays (gold, silver and gold-mining stocks) were 'overbought'. This
paved the way for a post-news decline, even though the bulls got what they
wanted from the Fed. The current situation is different, in that gold and silver
are neutral (neither 'overbought' nor 'oversold') and the gold-mining sector is
very 'oversold'. This means that there is likely to be a strong upward reaction
in these markets IF the Fed announces a new inflation program or the expansion
of its existing program at the conclusion of this week's FOMC meeting.
We wish we knew what the Fed was going to do. The only thing we can be certain
of is that Bernanke and Co. will not take any steps to tighten monetary policy.
Money Supply Instability
According to a recent comment by a
well-respected analyst, one of the problems with using gold as money is that the
supply of gold could experience large swings due to changes in mine production.
The ignorance reflected by this comment is simply breathtaking. The usual
complaint about using gold as money is that the supply of gold doesn't increase
fast enough to facilitate strong economic growth, as if producing more stuff
requires more of the general medium of exchange. To know why the 'insufficient
rate of supply growth' complaint is bogus you must have a basic understanding of
good economic theory, which most people don't have. However, to know why the
'large swings in gold supply' complaint is bogus you only have to take a cursory
glance at some charts. It seems that the analyst mentioned above didn't even
bother to take a cursory glance at some charts before spreading what is, to put
it politely, misinformation.
The charts of relevance show what tends to happen to money supply under the
current global monetary system, that is, under a system where the money supply
is primarily determined by a central bank. But before we get to these charts,
let's briefly consider the global supply of gold.
Over the past 100 years the total aboveground supply of gold increased at
1.5%-2.0% per year, year in year out*. On the occasions when the growth rate
moved out of this range, it was only ever by a small amount. There were periods
of larger increases in gold production during the 1800s and early-1900s due to
major high-grade gold discoveries and the invention of the cyanide leaching
process, but the current trend is towards marginally lower global gold
production. In any case, even if we make the unrealistic assumption that an
amazing new technological advance will allow the global gold mining industry to
double its annual output, the result would only be an increase in the gold
inflation rate from around 1.5%/year to around 3%/year.
So, the global gold supply will probably continue to increase at around
1.5%/year, but under an absurd scenario could possibly increase as rapidly as
3%/year. It will never decline, because for the same reason that gold can't be
created out of thin air it can't disappear into thin air. How does this compare
with our fiat money?
Here are a bunch of charts that show how it compares, beginning with a chart
prepared by
Mike
Pollaro that reveals the year-over-year (YOY) rates of growth in the
supplies of the US$ (identified as TMS2 on the chart), the euro, the British
Pound and the Yen. The chart shows that with the exception of the Yen, the
annual rate of supply growth in the world's major currencies has, since 2000,
oscillated between -3% to 2% at the low end and at least 18% at the high end.
The Yen has been more stable in that its growth rate has oscillated between -1%
and 5%.
Turning to some other currencies, the following charts show that:
1) Since the beginning of 2000 the YOY rate of growth in the Australian True
Money Supply (TMS) has gone from 15% down to 0% up to 26% down to 7% up to 26%
down to -3% (a brief period of monetary deflation) and finally up to the 5%-10%
range where it remains today. And the Reserve Bank of Australia is generally
considered to be one of the most prudent central banks!
2) The YOY rate of growth in the Brazilian TMS has swung wildly between 0%-7% at
the low end and 20%-30% at the high end.
3) The YOY rate of growth in China's M1 money supply spent the first seven years
of the last decade oscillating between 10% and 20%. The swings then became even
larger, with a decline to 6% in late-2008 and then a moonshot to almost 40% in
early-2010 followed by a decline to 3% in early-2012.
4) The YOY rate of growth in South African TMS has been all over the place. The
South African economy has been careening between monetary deflation and rapid
monetary inflation.
And some people have the nerve to claim that money-supply instability is a risk
posed by a gold standard!
Large changes in the money supply get in the way of economic progress and always
end up occurring when central banks and/or governments have the power to
determine the money supply.
*As we've explained in many previous commentaries, this is
why changes in mine production can safely be ignored when attempting to predict
the future performance of the gold price.
The Stock
Market
Germany's stock market broke above its
September-2012 high last week and is now slightly below resistance defined by
its 2011 high. It is short-term 'overbought', having risen in almost a straight
line from its mid-November low.
France's stock market also broke above its September-2012 high last week, but
remains well below last year's high.
In the US, the period of uncommonly-low volatility that began in August shows no
sign of ending. As illustrated by the following chart, the VIX remains near the
bottom of its 4-year range.
Periods of low volatility are followed by large increases in volatility, so we
can be sure that a volatility surge is coming. The timing is the big unknown.
Based on what had happened during 2010 and 2011 we thought that the next
volatility surge would have commenced by now. That it hasn't commenced yet
doesn't mean that the danger has passed. It means that the danger still lies
ahead.
This week's
important US economic events
| Date |
Description |
| Monday Dec 10 |
No important events scheduled
| | Tuesday Dec 11 |
International Trade Balance | | Wednesday
Dec 12 |
FOMC Statement and Bernanke Press
Conference
Import and Export Prices
Treasury Budget | | Thursday
Dec 13 |
PPI
Retail Sales
Business Inventories
|
| Friday Dec 14 |
CPI
Industrial Production
|
Gold and
the Dollar
Gold and Silver
By late November the silver market had become 'overbought' on a short-term
basis. It has since been working off this 'overbought' condition via what looks
like a routine correction.
It's a similar story with the silver/gold ratio. Silver/gold had become
short-term 'overbought' by late November and is now in the process of
'correcting'. There is nothing in the price action to indicate a trend reversal.
To put it another way, the decline of the past two weeks looks more like a
counter-trend move within a continuing short-term upward trend than the first
leg of a new downward trend.
Silver and gold have 'corrected' in normal fashion up until now. Unfortunately,
the same cannot be said for the gold-mining sector.
Gold Stocks
The difficult market for junior gold miners
From Canaccord's latest "Junior Mining Weekly" letter:
"We track a group of 40 non-producing junior gold companies with NI 43-101
compliant resource bases to estimate an average in situ market value per ounce
of gold resource. Today, the average in situ value per ounce is US$67.12/oz. In
late 2010, the average in situ market value per ounce was US$161.98/oz. So from
December 31, 2010 to November 30, 2012, the average in situ value per ounce has
dropped 58.6%, despite a 19.0% increase in the price of gold over the same
period of time. This is an average in situ value; however, every deposit is
different and not all discoveries are created equal. In December 2010, the in
situ market value per ounce ranged from a low of US$6.75/oz to a high of
US$399.56/oz with 16 out of 38 companies trading above US$100/oz. Today, the in
situ value per ounce ranges from a low of US$5.52/oz to a high of $226.64/oz
with only seven out of 40 companies trading at an in situ value of more than
US$100/oz. We are simply not seeing the same level of market response to drill
results and resource expansion in the current risk averse environment. This
year, it has been more common for positive drill results to be met with a ho hum
response in the market."
Displayed below is Canaccord's chart illustrating what was described above.
Notice the divergence between the gold price (the orange line) and the average
per-ounce market value of in-ground gold (the vertical bars) that commenced in
early-2011.
What caused this divergence and when is it likely to end?
There are many answers to the first part of this question, including rising
production and capex costs. For exploration/development-stage juniors, the large
increase in the cost of building a new mine, as exemplified by the massive
increase in the cost budgeted by Barrick Gold to build the Pascua Lama mine, has
become a major issue. That's why a number of juniors with large low-grade
deposits are changing tack. Two years ago they were focused on maximising the
deposit size and the scope of the proposed mining operation. Now they are
focused on maximising profit per ounce and minimising initial capex. Keegan
Resources (KGN) is a good example. Keegan's Esaase project would only have a
small chance of progressing to the construction phase based on the mine plan
that was envisaged at the time of the 2011 PFS, but based on the new plan
involving a smaller-scale higher-margin operation there's a high probability of
a mine being built within the next few years. However, not all projects are
amenable to such a change. The Donlin Creek project of NovaGold/Barrick and the
Caspiche project of Exeter Resources, for example, have little hope of entering
the mine-construction phase in the foreseeable future. Other projects, such as
those controlled by International Tower Hill Mines and Volta Resources, could
still be viable under the challenging market environment of today, but more
engineering work will be required to determine if this is the case.
Another answer is that most of the senior producers haven't been able to
translate the higher gold price into meaningfully better financial performance.
This is related to the increase in production and capex costs mentioned above.
In particular, due to the sharply higher cost of building a new mine the senior
producers now have to invest a lot more money to replace previous production (as
mines get depleted, new mines must be built to prevent a decline in production).
It is also related to management errors, such as drastically overpaying for new
assets.
A third answer is that there are too many junior gold miners vying for investor
attention. Many of these companies don't have genuinely valuable assets, but
they all have good stories to tell.
A fourth answer is that there hasn't been a spectacular discovery to excite the
market. A few months ago it looked like GoldQuest had made such a discovery, but
subsequent drilling indicated that the deposit was nowhere near as impressive as
it initially seemed.
The overarching answer to the first part of the question, however, isn't
specifically related to gold mining. The reality is that although there have
been a few shifts towards risk during the period in question, the dominant theme
since early-2011 has been "risk off". This is evidenced by a series of declining
tops in the RUT/SPX ratio (small-cap US stocks relative to large-cap US stocks)
and a general widening of credit spreads.
The answer to the second part of the question is unknowable. As mentioned below
under "Current Market Situation", a 'seasonal' rally in the juniors is due to
begin during the second half of this month. It's a good bet that we'll get the
seasonal rally, but the price action of the past week has introduced a lot more
uncertainty as to what's likely to happen thereafter. Economically robust gold
deposits WILL eventually get priced closer to their true values, but
'irrational' valuations could persist for longer than expected. They already
have persisted for longer than expected.
It is said that the market can remain irrational for longer than you can remain
solvent, but this is only true if you are over-extended. If you are 'unmargined'
with a comfortable cash cushion then the limitation is probably your patience,
not your ability to remain solvent.
Current Market Situation
As discussed in last week's Interim Update, the HUI's 5th December break below
its mid-November low was a significant deviation from our favoured scenario. We
must now seriously consider the possibility that there will be a re-test of the
May-2012 low prior to the start of the next major upward leg.
A counter-trend rebound in the HUI would likely end at or below resistance in
the 460s (the horizontal green line drawn on the following daily chart).
Consecutive daily closes above this resistance could therefore be interpreted as
a signal that something more substantial than a counter-trend rebound was in
progress.
The following daily chart of the TSX Venture Exchange Composite Index (CDNX)
reflects the dismal state of affairs in the world of junior resource stocks. The
recent decline has taken the CDNX back to near its 2012 low, which was also its
low of the past three years.
A period of seasonal strength for the juniors begins during the second half of
December. This seasonal strength can last until April or May when "risk on" is
dominating, but even when the markets are in "risk off" mode the strength
usually lasts until February.
Currency Market Update
There was more than the usual amount of volatility in the currency market on
Friday. The Dollar Index initially surged in reaction to a bearish assessment of
the euro-zone economy and better-than-expected US employment data, then gave
back all of its gains and finally strengthened a little to end the day slightly
higher than where it had been 24 hours earlier.
Sentiment indicators suggest the potential for the Dollar Index to move to a new
multi-month low and the euro to move to a new multi-month high before we get the
next meaningful shift in relative strength. Of particular relevance: although
the speculative net-short position in euro futures has fallen a long way from
its early-June high, speculators are still betting against the euro.
The Dollar Index has nearby support at 79.5. A daily close below this support
would suggest that it was on its way to 77-78.
Update
on Stock Selections
Notes: 1) To review the complete list of current TSI stock selections, logon at
http://www.speculative-investor.com/new/market_logon.asp
and then click on "Stock Selections" in the menu. When at the Stock
Selections page, click on a stock's symbol to bring-up an archive of
our comments on the stock in question. 2) The Small Stock Watch List is
located at http://www.speculative-investor.com/new/smallstockwatch.html
 Company
news/developments for the week ended Friday 7th December 2012: Company
news/developments for the week ended Friday 7th December 2012:
[Note: FS = Feasibility Study, IRR = Internal Rate of Return, MD&A =
Management Discussion and Analysis, M&I = Measured and Indicated,
NAV = Net Asset Value, NPV(X%) = Net Present Value using a discount
rate of X%, P&P = Proven and Probable, PEA = Preliminary Economic
Assessment, PFS = Pre-Feasibility Study]
*Clifton Star Resources (CFO.V) reported drilling results from its
Duparquet project in Quebec. The results were generally good. They
suggested the potential to expand the pits in the current mine plan
and to add resources between the currently-proposed pits. Of
particular note were an exploration hole that intersected 3.51-g/t
gold over 18.9m and an in-pit hole that intersected 4.77-g-t gold
over 14.1m. Two drills continue to operate at Duparquet with the
primary objective to convert Inferred resources to M&I resources.
The first indication of the economics of the Duparquet project will
come by way of a PEA early next year.
*Dragon Mining (DRA.AX) advised that it had received the revised
environmental permit for its Svartliden gold mine in Sweden.
According to the company's press release, this means that
underground mining can commence as scheduled this month.
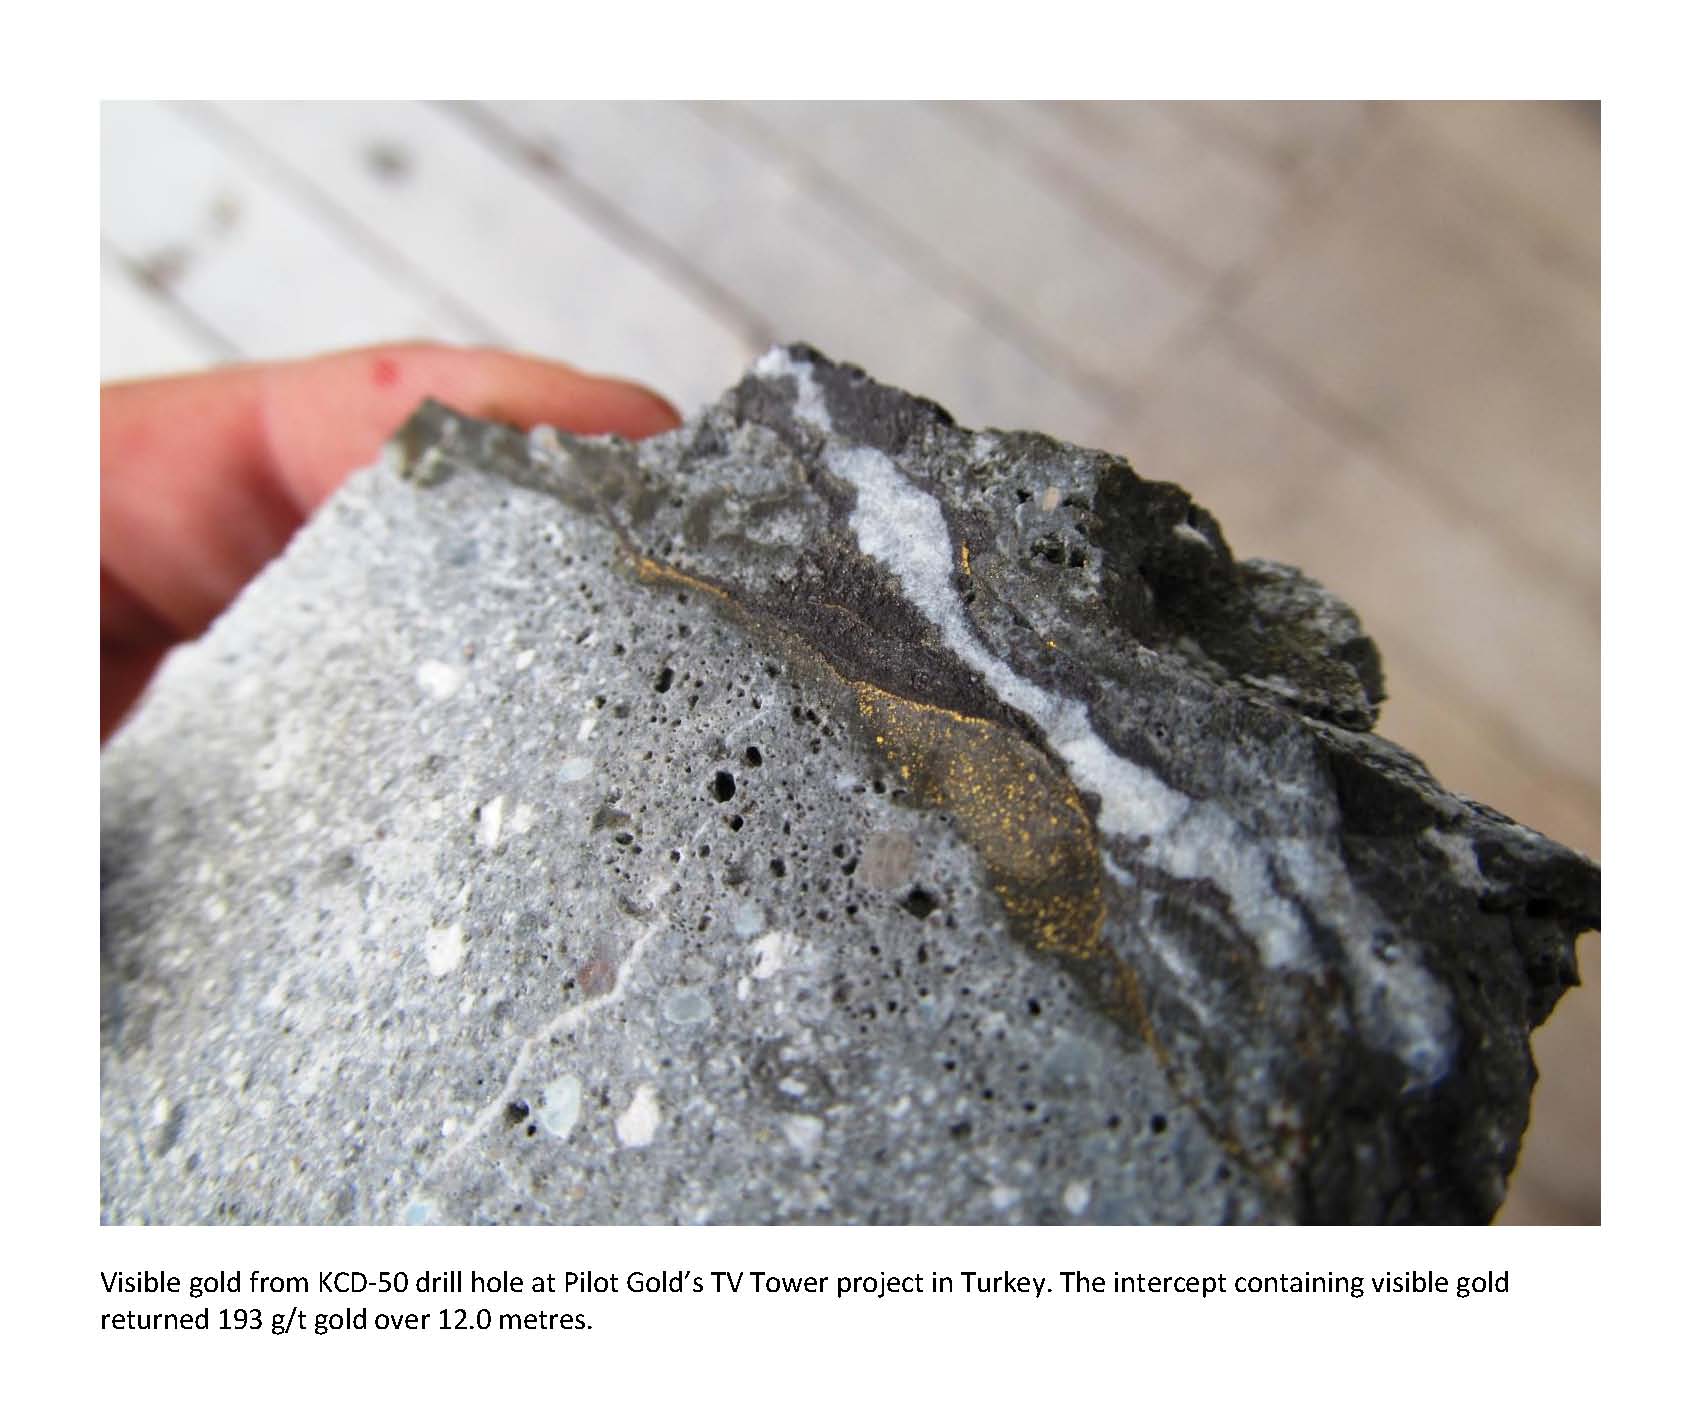
*Pilot Gold (PLG.TO) reported more drilling results from its TV
Tower gold project in Turkey. Included in these results was an
extraordinary gold intercept grading
193-g/t
over 12m in hole KCD-50. Hole KCD-50 was collared 70m to the
northwest of hole KCD-39, which also contained an extraordinary gold
intercept (5.94 g/t gold over 137m, reported in September). Other
notable intercepts in the latest batch of results were 2.11 g/t gold
over 43.1m and 2.69 g/t gold over 22.5m in hole KCD-58.
The TV Tower project is shaping up to be something special.
Drilling is on-going at TV Tower and assay results are currently
pending for 24 holes, so there will be a steady stream of drilling
news from PLG over the weeks and months ahead.
The TSI Stocks List has exposure to PLG via the $2.20 warrants that
expire in 2014, but at current prices (C$1.88 for the stock, C$0.53
for the warrants) the stock offers the better value. The value
difference isn't enough to justify selling the warrants and buying
the stock, but for new buying at this time the shares would be
better than the warrants.
More
on the proposed merger between Keegan Resources (KGN) and PMI Gold (PMV.TO)
Last week's most important event involving a TSI stock was the announcement that
KGN, a long-time member of the TSI Stocks List, has agreed to merge with PMV.
Last week's Interim Update contained our initial discussion of this news.
Most of our readers should be familiar with what KGN brings to the table, so
we'll now take a look at PMV's contribution to the combined company. Aside from
its $130M of cash, PMV's contribution is the Obotan project. This project's
salient details are included in a Feasibility Study completed in August-2012 and
summarised in the following table.
|
Project Name |
Obotan |
|
Location |
Ghana, West Africa |
|
Planned Mine Type |
Open Pit |
|
M&I Resource (oz) |
3.11M |
|
Avg Resource Grade |
2.16 g/t |
|
P&P Reserve (oz) |
2.4M |
|
Metallurgical Recovery |
93% |
|
Strip Ratio |
5.6:1 |
|
Avg Annual Production (oz) |
200K |
|
Cash Cost (per oz) |
$626 |
|
Mine Life |
11 years |
|
Initial Capital Cost ($M) |
300 |
|
Assumed Gold Price (US$) |
1600 |
|
NPV ($M) |
686 |
|
IRR |
43% |
|
Project Ownership Percent |
90% |
|
NPV of Company Stake ($M) |
617 |
|
Current Stock Price (US$) |
0.85 |
|
Share Count (M) |
412 |
|
Current Market Cap ($M) |
350 |
|
Net Cash ($M) |
130 |
|
Current Enterprise Value ($M) |
220 |
|
EV/NPV |
36% |
|
Current Discount to NPV |
64% |
|
EV + Capital Cost (COM) |
520 |
|
COM/NPV |
0.84 |
From a valuation perspective the
final three rows of the above table are the most important. The third row from
the bottom shows the discount to the project's NPV at which the stock is
currently trading. The discount should be substantial (at least 50%), but in
today's ultra-challenging market it is not enough to trade at a large discount
to NPV. Dozens of juniors are now trading at large discounts to their NPVs.
That's why we've added the last two rows.
The second row from the bottom shows the stock's enterprise value plus the
estimated initial capital cost of its flagship project. This, in effect, would
be the total cost to an acquiring company of developing a new mine, because the
acquirer would first have to buy the current owner of the project and then pay
for a mine to be built. We refer to this as Cost of Mine (COM).
The last row compares the COM to the project's NPV. The lower this figure the
better the value and the more attractive the company will appear to potential
acquirers. If a company has a COM/NPV ratio of less than 1 at a conservative
gold price, then on a purely quantitative basis it is very attractively priced.
Note that a company could be trading at a huge discount to its NPV, but due to a
relatively high initial capex estimate its COM/NPV ratio could be well above 1.
Another company could be trading at a smaller discount to its NPV, but due to a
relatively low initial capex estimate its COM/NPV ratio could be less than 1.
All else being equal, in today's market the second company would be the better
investment.
At Friday's closing price of C$0.85/share, PMV's COM/NPV ratio was 0.84 at a
gold price of $1600/oz. This suggests that the Obotan project is attractively
valued, which is good from a KGN shareholder's perspective (our perspective). We
won't be able to do the same calculation for KGN's flagship project until the
revised PFS is issued in Q1-2013.
One final point worth mentioning is that the announcement of the KGN-PMV merger
effectively put both companies into play. A third company could enter the fray
with a bid for KGN or PMV.
Chart Sources
Charts appearing in today's commentary
are courtesy of:
http://stockcharts.com/index.html
http://www.economagic.com/
http://research.stlouisfed.org/

|
