


--
Weekly Market Update for the Week Commencing
11th June 2018
Big Picture
View
Here is a summary of our big picture
view of the markets. Note that our short-term views may differ from our
big picture view.
The BULL market in US Treasury Bonds
that began in the early 1980s ended in mid-2016, but there will be many years
of topping action in bond prices and bottoming action in bond yields before
major new trends get underway. A major decline in government bond prices will
unfold during the 2020s. (Last update: 11 September 2017)
The stock market, as represented by the S&P500 Index,
commenced
a secular BEAR market during the first quarter of 2000, where "secular
bear market" is defined as a long-term downward trend in valuations
(P/E ratios, etc.), gold-denominated prices and inflation-adjusted prices. This secular trend will bottom
in 2020 or later.
(Last update: 11 September 2017)
A cyclical BEAR market in the
US
Dollar
began in 2016-2017.
(Last
update: 11 September 2017)
Gold commenced a
secular bull market relative to all fiat currencies, the CRB Index,
bonds and most stock market indices during 1999-2001.
This secular trend will peak in 2020
or later.
(Last update: 11 September 2017)
Commodities,
as represented by the CRB Index, commenced a
secular BULL market in 2001 in nominal dollar terms. The first major
upward leg in this bull market ended during the first half of 2008, but
a long-term peak won't occur until 2020 or later.
(Last
update: 11 September 2017)
Copyright
Reminder
The commentaries that appear at TSI
may not be distributed, in full or in part, without our written permission.
In particular, please note that the posting of extracts from TSI commentaries
at other web sites or providing links to TSI commentaries at other web
sites (for example, at discussion boards) without our written permission
is prohibited.
We reserve the right to immediately
terminate the subscription of any TSI subscriber who distributes the TSI
commentaries without our written permission.
True
Fundamentals Summary
[Notes:
1) The date shown next to the current True Fundamentals Model (TFM) signal is
when the most recent change occurred. 2) Charts of the Gold and Equity
TFMs are included in the "Charts and Indicators" section of the TSI web
site]
|
Market |
True Fundamentals Model (TFM) |
|
Gold (US$ Price) |
Bearish (12 Jan 2018) |
|
US Equity (SPX) |
Bearish (25 May 2018) |
|
Currency (Dollar Index) |
Bullish (27 Apr 2018) |
|
Commodities (GNX) |
Bearish (01 Jun 2018) |
Last week's posts at the TSI Blog
The useless and dangerous "money velocity" concept
Summary of current
thinking/positioning
1) The Dollar Index and the euro
may have competed multi-month counter-trend moves (up for the DX, down for
the euro), but more evidence is required to confirm this. In any case,
it's likely that the euro's rebound from its late-May low will continue
over the coming 1-2 months.
2) Gold's short-term outlook is 'up in
the air', with a close above $1310 or below $1280 needed to signal the
direction of the next significant move.
3) The SPX likely will make
a new all-time high by July. The risk/reward is not bullish, though,
because a move to well above the January high is unlikely and because
there is a realistic chance of a large decline during the second half of
2018.
4) There is no evidence that the Swiss Franc has bottomed
against the US$, but taking a 3-6 month view this currency's risk/reward
looks very attractive. The senior commodity currencies (the A$ and the C$)
also have attractive risk/reward ratios over this time period.
5)
New lows in bond prices (new highs in bond yields) are likely before
year-end, but the T-Bond price should have an upward bias over the coming
2-3 months.
6) Holding a cash reserve of around 30%.
Commodities
Copper at US$4 by
September?
Last week the copper price broke out to the
upside. If it now performs similarly to how it performed after previous
breakouts over the past 2.5 years, it could reach the top of the channel
drawn on the following chart by September. That implies a 3-month target
of $3.80-$4.00.
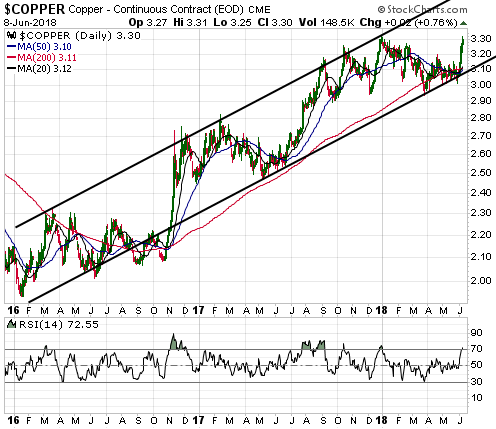
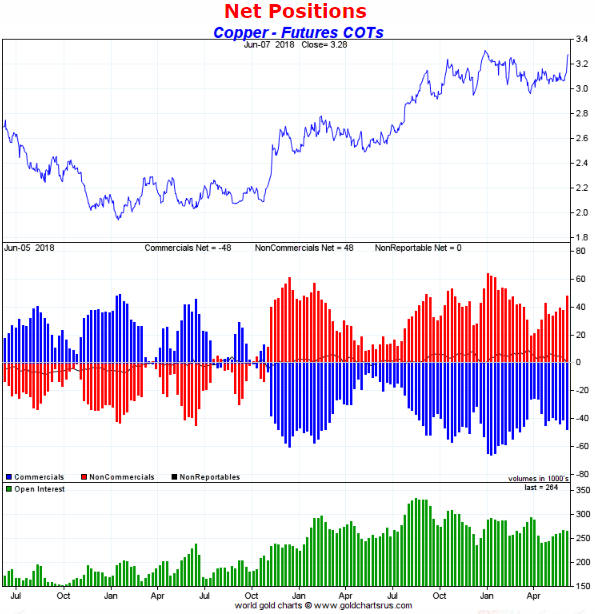
However, the current COT situation constitutes a yellow warning flag.
As illustrated by the following chart, the total speculative net-long
position in Comex copper futures is almost as big as it was when the price
was hitting a short-term top last September. If the total speculative
net-long position gains another 10K contracts or so then the COT situation
will constitute a red warning flag.
We think it makes sense to be short-term bullish on copper, but to be
aware of the risk posed by a large speculative long position.
Note
that a daily close below $3.20 would call into question the validity of
last week's breakout, whereas 1-2 weeks of consolidation in the
$3.20-$3.30 range would reduce the downside risk and potentially set the
stage for another sharp rise.
Platinum nearing a breakout,
most likely to the upside
From its December-2017 low of
around $875/oz the platinum price surged to around $1030/oz within 6
weeks. It then spent about 15 weeks retracing the bulk of the $155 gain
achieved by this 6-week rally.
It's a sign of strength that it
took the platinum market 2.5-times longer to fall than to rise by the same
amount. This suggests that the rise was in the direction of the trend and
the fall was a correction. The choppiness of the decline from the January
top supports this interpretation.
The idea that the decline from
the January top was/is a correction obviously would be invalidated by a
solid break below the December-2017 low, so the risk on a trading position
bought near the current price could be managed by placing a daily closing
stop at, say, $870.
A daily close above $930 would break the
'declining tops' pattern of the past 4 months and constitute evidence that
a short-term bottom is in place.
It's also worth mentioning that based solely on net positioning,
platinum's COT situation is now more bullish than it has been at any time
over the past 9 years.
A new battery metals ETF
Prior to last week, investors wanting to obtain diversified exposure
to battery-metals-related stocks via an ETF had only one option: the
Global X Lithium & Battery Tech ETF (LIT). Although LIT has performed very
well since bottoming in early-2016 (see chart below), its composition
leaves a lot to be desired. For example, two of its top ten holdings are
Panasonic Corp. (PCRFY), a general consumer electronics company, and Tesla
(TSLA), a car manufacturer on the road to bankruptcy. However, investors
now have a second ETF option.
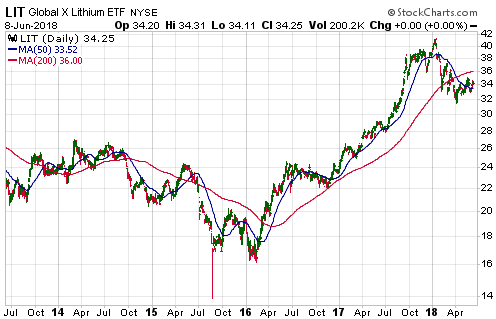
The second option is the Amplify Advanced Battery Metals and Materials
ETF (BATT). In terms of providing the sort of exposure we want to the EV
'megatrend', BATT's holdings are much better than LIT's holdings. In fact,
the list of BATT's top-ten holdings includes two current TSI stock
selections (CLQ.AX and KBLT.V).
Another difference between LIT and
BATT is that LIT is a passive fund that tracks an index whereas BATT is
actively managed. This could be a pro or a con for BATT, depending on the
ability of its managers.
At this time BATT's main problem is its
tiny size (its net asset value is only about $2M). This could result in
the ETF being illiquid and difficult to trade, although with only three
days of trading history to go on it is far too soon to draw any
conclusions. In any case, we expect that BATT will grow quickly so
liquidity shouldn't be an issue for long.
A
good article about BATT, LIT and the EV trend was posted recently at
Seeking Alpha. A comparison of BATT and LIT begins on
page 5.
No surprises from
the Fed
It's a virtual certainty that
the Fed will hike its targeted interest rates by another 0.25% on
Wednesday of this week. The new target range will be 1.75%-2.00%.
'Everyone' knows that the rate hike is coming, so there shouldn't be a
significant market impact when it is announced. Everyone also knows that
there won't be another Fed rate hike after this week until at least 26th
September, because after this week the next FOMC meeting with a scheduled
press conference will be held on 25-26 September.
Therefore, in
terms of changes to official interest rates the Fed will be out of the
picture for almost 3.5 months after this Wednesday. The Fed's quantitative
tightening (QT) will continue in the background, though, and it's the QT
that really matters.
The ramp-up of the QT program over the next
few months is a good reason to be concerned that the Q1-2018 stock market
plunge was just a 'shot across the bow'.
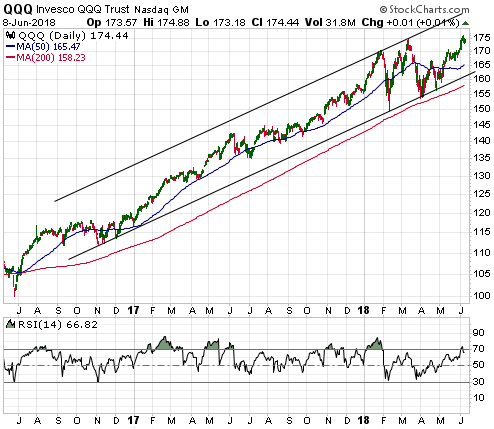
The Stock Market
QQQ, the ETF that tracks the
NASDAQ100 Index, pulled back a little after making a new all-time high
last Wednesday. It could experience more of a pullback, but there are no
bearish divergences to suggest that a substantial decline is imminent.
Note that once QQQ makes a decisive break above the March-2018 high it
won't encounter significant resistance until it reaches the top of the
channel drawn on the following chart. A month from now the channel top
will be at $185-$190.
We may well be interested in buying QQQ put
options with about 6 months to expiry IF there is a surge to around $185
within the next few weeks.
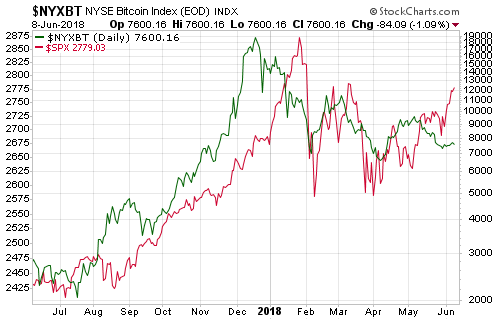
There is a possible relationship between the US stock market and the
Bitcoin price that we certainly aren't alone in noticing. We haven't
mentioned it in TSI commentaries prior to now because it wasn't providing
any clues about the future, but it could be worth paying attention to over
the next few weeks. This is due to a divergence having developed that is
similar to the divergence that developed prior to the January-2018 stock
market peak.
The following chart compares the S&P500 Index (the red
line) with the NYSE Bitcoin Index (the green line). The lines have very
different scales (the Bitcoin price went up a lot more and then down a lot
more), but they have generally moved in the same direction.
What's
particularly interesting is the divergence that occurred during
December-January, with Bitcoin turning downward in mid-December and the
SPX not following suit until about 6 weeks later. A similar divergence has
occurred over the past month, with Bitcoin trending downward since
early-May and the SPX remaining in a short-term upward trend.
If
the Bitcoin price were to take out its early-April low it would be a
warning that a new short-term downward trend was about to get underway in
the stock market.
This week's
significant US economic events
[Notes:
1) The most important events
(to the markets) are shown
in bold. 2) A list of global economic events can be found
HERE]
| Date |
Description |
|
Monday Jun-11 |
No important events scheduled |
|
Tuesday Jun-12 |
CPI
Treasury Budget |
|
Wednesday Jun-13 |
PPI
FOMC
Announcement |
|
Thursday Jun-14 |
Retail Sales
Import and Export Prices
Business Inventories |
|
Friday Jun-15 |
Industrial Production
Consumer Sentiment
TIC Report |
Gold and the Dollar
Gold
Gold Sentiment
In the article posted
HERE, Adrian Ash of bullionvault.com mentions several sentiment indicators
that, taken together, suggest that the interest in owning gold is at a
multi-year low.
Boredom is cited as a reason for this lack of interest.
As stated in the article: "On a 3-month basis, gold prices this spring have
moved in a narrower range than any time since the doldrums of the mid-1990s, a
mere 3.6% high-to-low. Only the early 1990s and 1986 saw less action in gold
since early 1971, back before the US abandoned the Gold Standard and its $35 per
ounce peg per ounce."
Our primary indicator of gold sentiment is the
Commitments of Traders (COT) report. Gold's COT situation became a little more
constructive last week and remains slightly bullish.
Gold's COT situation
improved last week due to a decline in open interest (OI) to around 450K
contracts. OI is indicated by the green bars in the bottom section of the
following chart. As is also the case with silver, important lows in the gold
price tend to coincide with relatively low levels of OI in Comex futures.
The current level of OI and the total speculative net-position in Comex
futures are now roughly the same as they were at the start of the 6-week rally
that got underway in December-2017. Also, the OI is now similar to what it was
near the start of a 2-month rally last July, although the total speculative net
position is significantly larger now (meaning: less bullish) than it was then.
However, the strongest rallies of the past four years (the ones that began in
December-2015 and December-2016) didn't begin until the OI had dropped to around
400K contracts.
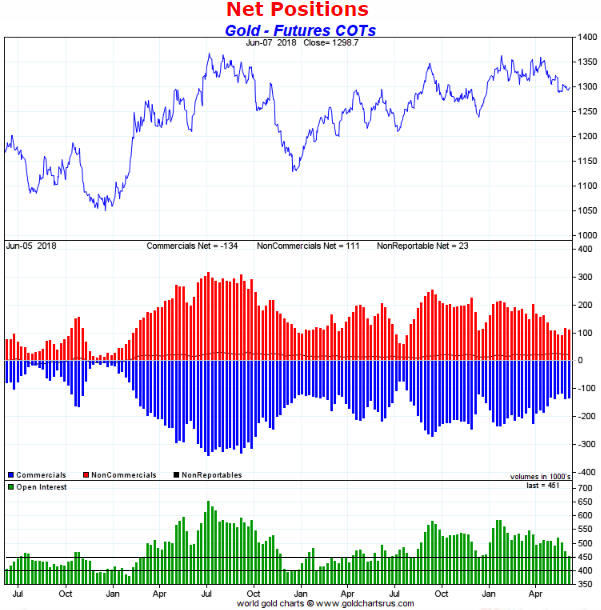
Sentiment is just one piece of the puzzle. Currently, sentiment taken in
isolation suggests that we could be about to get a 1-2 month gold price rally,
but not an intermediate-term rally. To set the sentiment scene for an
intermediate-term rally there likely would have to be a price decline of
sufficient magnitude to simultaneously reduce the total speculative net-long
position to 50K contracts or less and push the OI down to around 400K contracts.
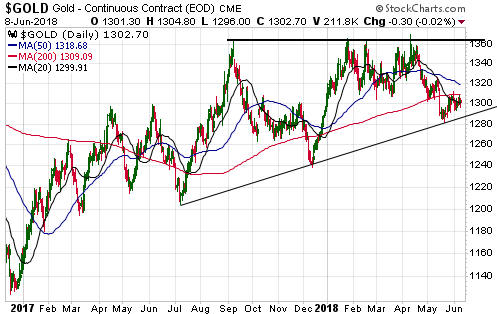
Current Market Situation
On 15th May
the US$ gold price broke below lateral support at $1309 and its 200-day MA. It
made some sort of bottom within a few days of this downside breakout and then
quickly rebounded, but it hasn't been able to close back above $1309 or its
200-day MA. This differentiates the current situation from the short-lived
breaks below the 200-day MA that occurred in July and December of last year.
Gold price volatility has reduced to almost nothing, with the daily closes
staying within a $2 range over the past four days. This has undoubtedly added to
the general lack of interest in gold discussed in the Adrian Ash article linked
above.
Sentiment is supportive, but not in a decisive way, and the
fundamental backdrop remains bearish, but likely to shift in gold's favour
within the next two months if there is a sizable rebound in the T-Bond market.
That leaves us with very little to go on aside from the price action.
The
gold price must get back above its 200-day MA on a daily closing basis to warn
that a short-term rally has begun, whereas a daily close below $1280 would warn
of a decline to the $1240s or lower.
Silver
The US$ silver price showed tentative signs of
strength last week and tested the top of its $16.10-$16.90 range on Thursday.
If the silver price manages to break above $16.90 in the near future then it
will almost immediately encounter resistance in the form of an intermediate-term
channel top at $17.20-$17.30, but if it breaks out from this channel then a
quick move up to important lateral resistance near $18.50 probably will occur.
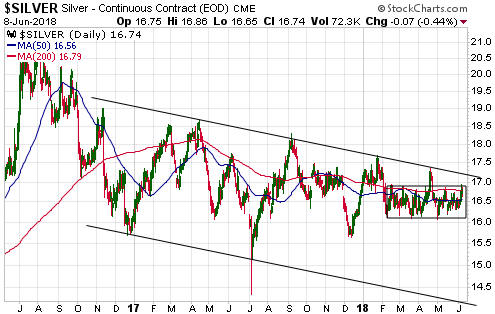
Sentiment in the silver market is not supportive at this time. At best, it
is neutral. This suggests that a large silver rally is not about to begin.
However, the potential exists for a $1-$2 surge to the mid-$18s. We will base
any decision on the facts in real time, but if the silver price rises to the
mid-$18s within the coming few weeks we likely will view it as a short-term
selling opportunity.
Gold Stocks
On a daily
closing basis, the HUI spent the past 34 trading days between 176.9 and 182.4
and the past 4 trading days between 178.64 and 178.88. Therefore, in effect it
didn't move at all during the past 4 trading days and barely moved over the past
1.5 months.
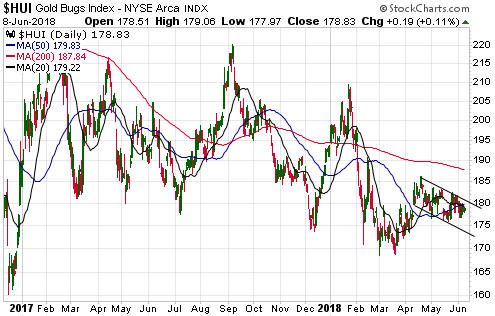
Due
to the near total lack of movement, nothing changed during the final two trading
days of last week and the following comments from the latest Interim Update
remain applicable:
"The [HUI's] 8-week downward drift looks like a
consolidation within a short-term upward trend. If this is the correct
interpretation then within the next few weeks the HUI should break out to the
upside and quickly move up to 190-200.
A quick move up to 190-200 by the
HUI obviously would be good for our gold-mining shares for a short time.
However, a rally that gets underway prior to a wash-out decline would have a
high risk of being just another rebound within the 17-months-and-counting
downward drift ..."
The Currency Market
Relative Currency Valuation
Below is a
visual representation of Deutsche Bank's Cap-PPP currency valuation model. It
comes from the article linked
HERE.
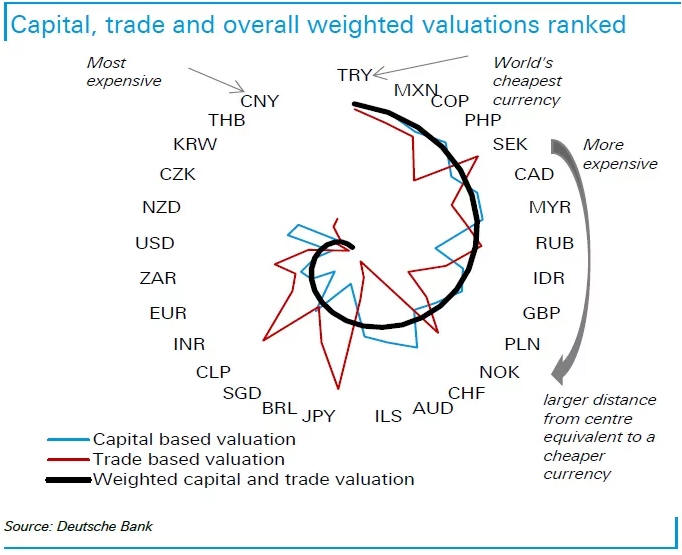
According to the above-linked article:
"By combining its
capital-based valuation and trade-based PPP (purchasing power parity) models
together, Deutsche says it provides a more complete picture of valuations, using
weights that reflect the relative importance of capital and trade flows for each
currency.
It believes the model has "significant predictive power for FX,
both in terms of directional accuracy and the magnitude of moves, especially
over longer-term horizons"."
And:
"Based on the latest
valuation snapshot in May, the Chinese yuan is deemed to be the most expensive
currency of all those tracked by Deutsche, edging out the Thai Baht, South
Korean won and Czech Republic koruna.
At the other end of the spectrum,
the Turkish lira, Mexican peso and Colombian peso were deemed to be the cheapest
currencies last month.
Of the majors, the New Zealand dollar is the clear
standout in terms of overvaluation at present. The US dollar, euro and Singapore
dollar are also seen to be on the expensive side of the ledger.
In
contrast, the Swedish krona, Canadian dollar, British pound, Norwegian krone,
Swiss franc and Australian dollar are all deemed to be cheap based on current
ranking order."
Coincidentally, DB's model is consistent with our
current views, in that we happen to be bullish on three of the most under-valued
currencies (the Australian dollar, the Canadian dollar and the Swiss franc).
However, our bullish outlooks for these currencies are based on inter-market
relationships and/or sentiment rather than relative valuation.
Current Market Situation
Over the past
two weeks the yield on Italy's 2-year government bond has gone from 0.3% up to
2.9% down to 0.7% up to 1.8% and back down to last Friday's close at 1.45%.
Refer to the following chart for details. This constitutes extraordinary
volatility for a bond issued by the government of the euro zone's 3rd largest
economy. Moreover, as recently as 15th May the yield-to-maturity on this bond
was negative, meaning that 'investors' at that time were acting as if Italian
government debt was safer and better than gold.

The panicked selling of Italian government bonds late last month prompted a
flight from the euro to other currencies, most notably the Swiss franc, the Yen
and the US$. This pushed the euro/US$ rate below critical support at 1.156, but
the short-lived breach of this critical support marked at least a multi-week
bottom. The euro has since rebounded.
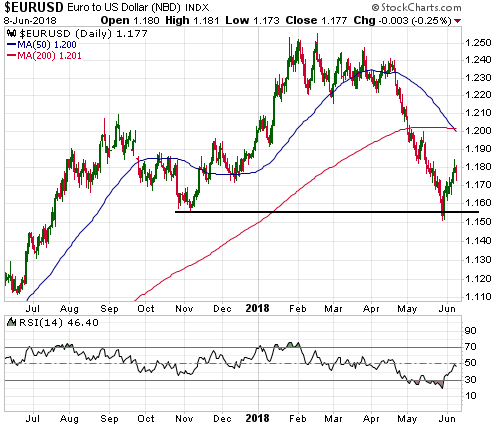
Fundamental factors and sentiment suggest that the euro's current rebound will
be followed by a decline to below the May-2018 low, which would imply that the
euro's 2017 rally happened within the context of an on-going bear market and
that an eventual decline to a new 10-year low is on the cards. However,
inter-market considerations, chief among them being the bullish outlook for
commodities, suggest that the euro's recent sharp pullback was a correction
within a cyclical advance.
The euro won't encounter significant
resistance until it hits 1.20. Regardless of the longer-term prospects, we
expect the euro to make it back to around 1.20 within the next couple of months.
Updates
on Stock Selections
Notes: 1) To review the complete list of current TSI stock selections, logon at
http://www.speculative-investor.com/new/market_logon.asp
and then click on "Stock Selections" in the menu. When at the Stock
Selections page, click on a stock's symbol to bring-up an archive of
our comments on the stock in question. 2) The Small Stock Watch List is
located at http://www.speculative-investor.com/new/smallstockwatch.html
 Company
news/developments for the week ending Friday 8th June 2018:
Company
news/developments for the week ending Friday 8th June 2018:
[Note: AISC = All-In Sustaining Cost, FS = Feasibility Study, FY = Financial
Year, IRR = Internal Rate of Return, ISR = In-Situ Recovery, MD&A = Management
Discussion and Analysis, M&I = Measured and Indicated, NAV = Net Asset Value,
NPV(X%) = Net Present Value using a discount rate of X%, NSR = Net Smelter
Return, P&P = Proven and Probable, PEA = Preliminary Economic Assessment, PFS =
Pre-Feasibility Study]
*Alkane Resources (ALK.AX)
owns the Dubbo 'specialty metals' Project and the Tomingley Gold Operation
(TGO). Last Monday, the same day that the results of the Dubbo Project's updated
engineering and financial study were released (refer to last week's Interim
Update for the related discussion), the company released the results of a
preliminary study on the TGO's underground potential (current production is from
an open pit).
According to the engineering work completed to date, there
is the potential to recover about 100K ounces of gold via underground
development over a 40-month period. This means that underground mining could
contribute about 30K ounces/year for a little more than three years. This is
significant given that current production is about 70K ounces/year, but it is
expected to cost A$16M to access the underground ore and the cash costs of
extracting the ore are estimated to be quite high at A$1150-A$1250/oz. This
suggests to us that the underground development as presently envisaged has a low
NPV and IRR.
It's certainly possible that additional exploration and
engineering work will enable the development of a profitable underground mine at
the TGO, but at this time the TGO's underground potential doesn't move the
needle on our ALK valuation.
*Clean TeQ Holdings (CLQ.AX,
CLQ.TO) advised that it received a cash payment of approximately A$4.8M
from the Australian Tax Office (ATO), representing the refundable tax offset
available under the Research and Development (R&D) Tax Incentive for FY17.
This is obviously good news, but for a company with a market cap of A$770M
and cash of A$160M it isn't significant.
*Nevsun Resources
(NSU) has received a revised takeover bid from the LUN-ESM partnership.
The total bid price is the same (C$5.00/share), but the Euro Sun Mining (ESM.TO)
portion of the bid has changed from being 100% stock to being 50% cash plus 50%
stock. This increases the attractiveness of the overall bid, but the bid still
has little chance of being successful.
In any case, the initial resource
estimate for the Timok Lower Zone (TLZ) is due to be released within the next
three weeks and it will make no sense for NSU's management to do any deal for
the sale of the company until the details of this estimate are known. In
particular, Lundin's portion of the overall bid will look woefully inadequate if
the initial TLZ resource estimate adds a few billion pounds of copper to NSU's
below-ground inventory.
List
of candidates for new buying
From within the ranks of TSI stock
selections the best candidates for new buying at this time, listed in
alphabetical order, are:
1) AAU (last Friday's closing price: US$0.75)
2) CLQ.AX or CLQ.TO (last Friday's closing price: A$1.04)
3) EGD.V
(last Friday's closing price: C$0.38)
4) GRG.V (last Friday's closing
price: C$0.43)
5) KBLT.V (last Friday's closing price: C$11.62)
The above list is limited to five stocks. It will sometimes contain less than
five, but it will never contain more than five regardless of how many stocks are
attractively priced for new buying.
New
TSI Stock Selection: Tinka Resources (TSXV: TK). Shares: 260M issued, 307M fully
diluted. Recent price: C$0.42
TK is an exploration-stage zinc
miner operating in central Peru. Its flagship asset is the 100%-owned Ayawilca
project.
The Ayawilca project has both size and grade going for it. The
current Inferred resource estimate, which was completed in November-2017, is
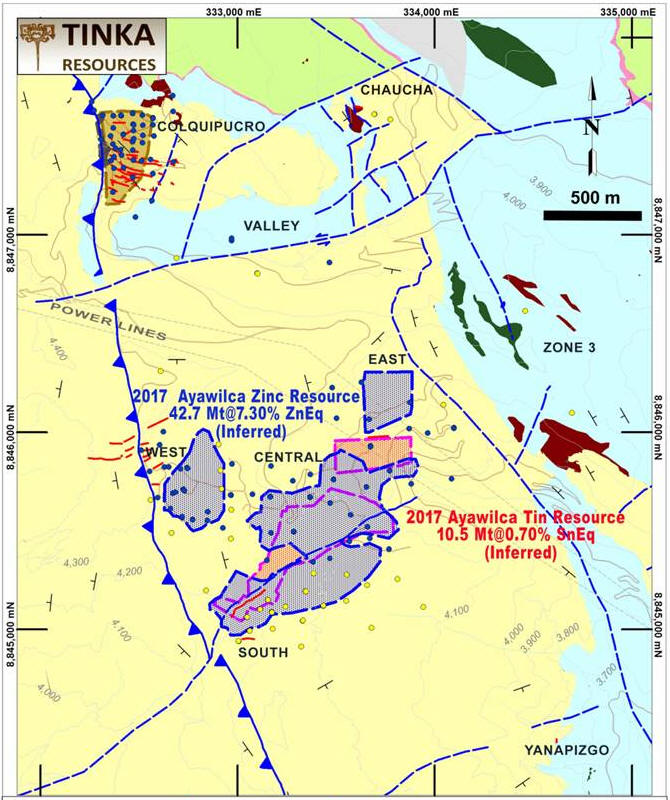
42.7M tonnes grading 6% zinc or 7.3% zinc-equivalent (ZnEq). This implies 5.6
billion pounds of zinc. There is also a separate Inferred resource comprising
145M pounds of tin.
The current zinc resource is spread across the South,
Central, East and West zones. Refer to the following map from the Tinka website
for additional information.
Step-out drilling by TK is continuing to hit wide intercepts of high-grade zinc
outside the boundaries of the existing resource. This guarantees that the
already-large resource will grow.
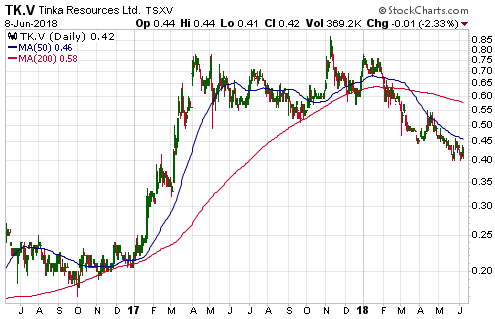
TK recently raised C$8M at
C$0.48/share, so the shares are presently trading at a sizable discount to the
latest financing. Furthermore, the following chart shows that the latest
financing was a long way below last November's high. This performance reflects a
general decline in the enthusiasm for zinc stocks rather than anything specific
to TK. The stocks of most zinc-focused mining juniors have performed very poorly
in 2018, but that's good news for those who are looking to buy.
By the
way, although TK made a new multi-year high in November-2017, for all intents
and purposes the stock has been in correction mode since early-April of 2017,
that is, for about 14 months.
We
estimate that TK has about C$11M cash at this time. It has been consuming cash
at the rate of about C$2.5M per quarter, so the current reserve should be enough
to fund the company's activities for another 12 months. Therefore, we don't
expect another equity financing this year.
Ayawilca has the size, the
grade and the location to be of interest to a major mining company. As a result,
there's a decent chance that TK will attract a takeover bid at some point.
However, we wouldn't buy the stock today in anticipation of a takeover. Ideally,
the takeover bid will come after the company has defined a larger resource and
the market has assigned a much higher value to the project. We would buy TK
today simply because near its current price it offers relatively low-risk (as
far as these types of stocks go) exposure to a metal that stands a good chance
of remaining in an upward trend for another 1-2 years.
With its current
market cap of C$109M, TK doesn't look as cheap as former TSI stock Solitario
Zinc (XPL, SLR.TO). However, we expect that TK will generate more market-moving
news and enthusiasm than XPL once the tide of stock-market speculation turns
back in zinc's favour.
TK plans to commence a PEA during the second half
of this year and once it is complete the PEA will provide the first glimpse at
Ayawilca's economics. Until then it will not be possible for us to value the
stock. It is a pure speculation. It's simply the case that the size, grade and
location of the resource suggests the potential for the Ayawilca project to be
worth a multiple of TK's present market value.
Congo
Risk
Governments throughout the world break agreements and
change the rules whenever it suits them in order to increase their revenues or
score political points. One of this year's examples is the implementation of a
new mining code by the government of the Democratic Republic of Congo (DRC). The
new code, which was signed into law last Friday without any concessions to
industry demands, overrides existing agreements with mining companies and will
greatly increase the cost of operating a mine in the DRC.
Among other
things, the new code scraps 10-year protections for existing projects against
changes to the fiscal regime, imposes a windfall profits tax and increases
royalties. Specifically:
1) Royalties are being increased from 2% to 3.5%
for non-ferrous and base metals and from 2.5% to 3.5% for precious metals,
calculated on the gross market value of the products.
2) A special 10%
royalty will apply to minerals deemed by the State to be "strategic substances".
The list of "strategic substances" likely will include cobalt.
3) A
special 50% tax will apply on excess profits, defined as profits made when a
commodity exceeds by 25% the price used in the feasibility study.
Of the
new regulations, the 50% tax on windfall profits is the biggest problem. Mining
is a boom-bust industry, with huge profits generated during the booms and huge
losses generated during the busts. Take away the opportunity to make the
so-called "windfall" profits during the boom times and the business no longer
makes economic sense.
Chart Sources
Charts appearing in today's commentary
are courtesy of:
http://stockcharts.com/index.html
http://www.goldchartsrus.com/
http://www.investing.com/
