


-- Weekly Market Update for the Week Commencing
11th July 2016
Big Picture
View
Here is a summary of our big picture
view of the markets. Note that our short-term views may differ from our
big picture view.
The BULL market in US Treasury Bonds
that began in the early 1980s ended in early-2015, but there will be many years
of topping action in bond prices and bottoming action in bond yields before
major new trends get underway. (Last update: 29 June 2015)
The stock market, as represented by the S&P500 Index,
commenced
a secular BEAR market during the first quarter of 2000, where "secular
bear market" is defined as a long-term downward trend in valuations
(P/E ratios, etc.) and gold-denominated prices. This secular trend will bottom sometime between 2018 and 2020.
(Last update: 29 June 2015)
A secular BEAR market in the
US
Dollar
began during the final quarter of 2000 and ended in July of 2008. This
secular bear market will be followed by a multi-year period of range
trading.
(Last
update: 09 February 2009)
Gold commenced a
secular bull market relative to all fiat currencies, the CRB Index,
bonds and most stock market indices during 1999-2001.
This secular trend will peak sometime between 2018 and 2020.
(Last update: 29 June 2015)
Commodities,
as represented by the CRB Index, commenced a
secular BULL market in 2001 in nominal dollar terms. The first major
upward leg in this bull market ended during the first half of 2008, but
a long-term peak won't occur until 2018-2020.
(Last
update: 29 June 2015)
Copyright
Reminder
The commentaries that appear at TSI
may not be distributed, in full or in part, without our written permission.
In particular, please note that the posting of extracts from TSI commentaries
at other web sites or providing links to TSI commentaries at other web
sites (for example, at discussion boards) without our written permission
is prohibited.
We reserve the right to immediately
terminate the subscription of any TSI subscriber who distributes the TSI
commentaries without our written permission.
Outlook Summary
Market
|
Short-Term
(1-3 month)
|
Intermediate-Term
(6-18 month)
|
Long-Term
(2-5 Year)
|
|
Gold
|
N/A |
Neutral
(27-Jun-16) |
Bullish
|
|
US$ (Dollar Index)
|
N/A |
Bullish
(29-Feb-16) |
Neutral
(19-Sep-07) |
|
US Treasury Bonds (TLT)
|
N/A |
Bearish
(19-Oct-15)
|
Bearish |
|
Stock Market
(DJW)
|
N/A |
Neutral
(04-Jul-16) |
Bearish
|
|
Gold Stocks
(HUI)
|
N/A |
Neutral
(04-May-16) |
Bullish
|
|
Oil |
N/A |
Neutral
(26-Oct-15) |
Bullish
|
|
Industrial Metals
(GYX)
|
N/A |
Bullish
(04-July-16) |
Bullish |
Notes:
1. Our short-term expectations are discussed in the commentaries, but except in
special circumstances we won't attempt to assign a "bullish", "bearish" or
"neutral" label to these expectations.
2. The date shown below the current outlook is when the most recent outlook change occurred.
3. "Neutral" means that we think risk and reward are roughly in balance with respect to the timeframe in question.
4. Long-term views are determined almost completely by fundamentals and intermediate-term views
are determined by a combination of fundamentals, sentiment and technicals.
Last week's posts at the TSI Blog
The hyperinflation and deflation arguments are both wrong
Gold
is testing its 2011 high
Summary of current
thinking/positioning
1) Concerned about short-term
downside risk in gold, silver and the associated mining stocks, but
comfortable maintaining substantial 'core' exposure in anticipation of
large additional gains over the next two years. Continuing to pick away at
'special situations' -- small/illiquid gold stocks that could generate
large gains independently of sector-wide performance.
2) Building
up exposure to non-gold commodity-related stocks (primarily base-metals
producers/explorers, but also energy and agriculture companies) and hedged
against short-term weakness via XME put options.
3) Thinking that
the US stock market is unlikely to do much on either the upside or the
downside over the coming 1-2 months.
4) Thinking that industrial
commodities (oil, copper, platinum, etc.) and the main commodity
currencies (A$, C$) made long-term bottoms during Q1-2016. The bottoms
could be tested during the second half of this year as part of a basing
process, but prices are likely to be markedly higher a year from now.
5) Thinking that something will soon have to give, because T-Bonds,
the US stock market and gold are all now 'overbought' and at/near
multi-year highs.
6) Anticipating a tradable decline in the T-Bond
and averaging into TBT call options in an effort to profit from the
decline.
7) Maintaining an unusually-large cash reserve in
recognition of the downside risk in almost all equities, but gradually
reducing the cash percentage via the accumulation of non-gold commodity
stocks.
Commodities
Copper
The top section of the following chart shows that copper remains in
consolidation mode in US$ terms. It needs to achieve a weekly close above
US$2.30 to signal an intermediate-term trend reversal, although a daily
close above $2.25 would be an early warning that such a reversal was in
the works.
The bottom section of the same chart shows that copper
remains in a major downward trend relative to gold. In fact, at the end of
last week the copper/gold ratio was close to the multi-decade low reached
near the climax of the Global Financial Crisis in early-2009. This
suggests that either gold is very expensive or copper is dirt cheap. A bit
of both, we think.
Copper is probably in the process of turning upward on an
intermediate-term basis in US$ terms and close to a bottom in gold terms.
This is related to the likelihood that the T-Bond is close to an important
peak, in that copper's current downward trend relative to gold is linked
to the decline in the T-Bond yield.
Oil
Based on the performances of the commodity currencies and the Yuan, the
oil price turned down within the expected time-window (before mid-June).
However, up until now the decline has been less than expected.
The
chart pattern (see below) could be interpreted as a routine short-term
correction that has almost run its course or as a market slowly rolling
over into a more substantial decline. Neither of these possible outcomes
would surprise us.
The Stock Market
The US
It is usually the case that when there is no change in the fundamentals, a
higher price means greater downside risk. The fact that the US stock
indices rose last week therefore implies that the downside risk is now a
little greater, although there is unlikely to be anything more than a
routine pullback over the next few weeks. As explained in recent
commentaries, this is because the market is displaying more internal
strength than would be the case if a large decline were about to begin.
Sentiment is another reason to be unenthused by the market's
short-term downside potential. The Brexit sell-off effectively 'cleared
the decks' of weak-handed longs, and despite the fast rebound from the
27th June post-Brexit low there still appears to be a healthy amount of
wariness in the market.
It's possible that short-term downside risk
will return to a precarious level at some point over the next two months,
but we'll cross that bridge when we come to it. In the meantime we will
probably retain our reduced position in QID (leveraged NDX bear fund)
October call options, but we won't add to the position.
In a
nutshell: It's time to focus more on accumulating exposure to
commodity-related stocks and less on bearish stock-market speculations.
Turning to the charts, the S&P500 Index (SPX) has just achieved a
weekly close above its November-2015, April-2016 and June-2016 highs, and
is now within 5 points of last year's all-time high.
The SPX is likely to make a new all-time this month, but it's unlikely
to run away to the upside anytime soon. Furthermore, there's a good chance
that new highs by the SPX and the Dow Industrials Index will not be
confirmed by some other important indices. An example is the NYSE
Composite Index (NYA).
The SPX's performance in gold terms is very different from its
performance in US$ terms. As illustrated below, in gold terms the SPX is
not far from an 18-month low.
It is worth pointing out, however,
that even in gold terms the SPX is still holding above its February-2016
bottom. Almost regardless of what happens to the nominal prices of the SPX
and gold, if we are dealing with a US equity bear market and/or a gold
bull market then the SPX/gold ratio should take out its February-2016 low
within the next few months and shouldn't move above its 200-day MA.
This week's
significant US economic events
[Notes:
1) The most important events
(to the markets) are shown
in bold. 2) A list of global economic events can be found
HERE]
| Date |
Description |
|
Monday July 11 |
No important events scheduled |
| Tuesday
July 12 |
No important events scheduled |
|
Wednesday July 13 |
Treasury Budget
Important
and Export Prices
Fed's Beige Book |
|
Thursday July 14 |
PPI |
|
Friday July 15 |
CPI
Retail Sales
Industrial Production
Consumer Sentiment
Empire State Mfg
Survey |
Gold and the Dollar
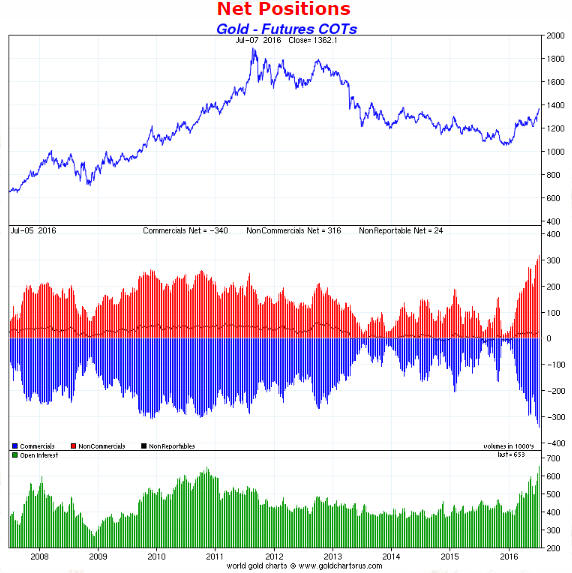
Gold
The COT Situation
The total speculative
net-long position in COMEX gold futures (the inverse of the commercial net-short
position -- the blue bars on the following chart) made a new all-time high last
week in absolute terms, although relative to open interest it is still just shy
of the extremes reached during 2006-2010.
The following excerpt from last
week's report still applies:
"The COT situation will never be the
reason for a trend reversal. Like other sentiment indicators it just creates
potential energy. The problem for gold will come when the trend reverses
downward for reasons that have nothing to do with the COT positioning and the
largest speculative net-long position in history has to quickly get unwound."
Current Market Situation
It seems
that there was something for everyone in the US Employment Report published last
Friday -- enough superficial strength to encourage the economic optimists and
enough underlying weakness to validate the concerns of the economic realists.
These differing views jostled in the currency, credit and gold markets, with the
result being significant intra-day volatility and not much in the way of net
change over the course of the trading day.
Of relevance to many financial
markets and particularly of relevance to the gold and currency markets, the
following chart of the January-2018 Fed Funds Futures (FFF) contract shows that
there was no change over the course of last Friday in market expectations
regarding the Fed's interest-rate moves. Prior to the employment news 'the
market' believed that there was only a 50% chance of a single 0.25% Fed rate
hike within the next 18 months, which is what 'the market' still believes.
Although the gold price only gained $5 on Friday, the price action was
bullish. This is firstly because the gold price dropped $25 in an initial
knee-jerk reaction to the higher-than-forecast jobs growth number included in
the US Employment Report and then quickly recouped this loss. Also, it is
bullish that last week's close was above the spike high of $1362 hit in the
immediate aftermath of the Brexit news on 24th June.
Despite the downside
risk stemming from the rampant enthusiasm of speculators in gold futures,
Friday's price action not only kept alive the possibility of a near-term rise to
$1400 but also increased the probability of such an outcome.
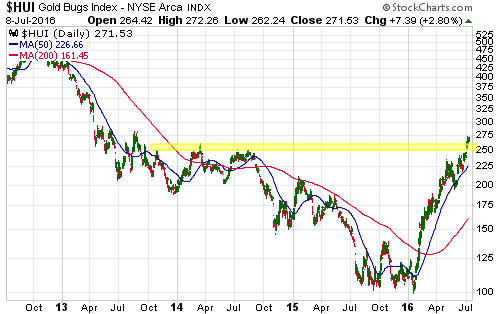
Gold Stocks
Last week, the HUI made its way through
long-term resistance at 250-260 as if it didn't exist.
The next
resistance lies at 280. However, the only remaining historical parallel with
this year's price action is the 1982-1983 rally, and if the HUI matches the
performance of the 1982-1983 rally then it will peak at around 300 in August.
Prior to the past few weeks we hadn't given much thought to the possibility
that this year's gold-sector rally would match the intensity of the 1982-1983
rally. This was partly because the 1982-1983 rally was an outlier in the
historical record, but it was mainly because the 1982-1983 rally was a rebound
within a bear market. The peak of the 1982-1983 rally was followed by a
multi-year downward trend rather than a multi-month correction.
Ultimately, the fundamentals will determine whether we are dealing with a new
cyclical bull market or an incredibly strong bear-market rebound. If gold's true
fundamentals become increasingly bullish over the months ahead then we are
dealing with a new bull market and it will be appropriate to buy corrections to
support in anticipation of large additional gains over the ensuing 1-2 years.
The Currency Market
Why
has the US$ been so weak?
The above question might seem strange
given that the Dollar Index has just broken above its late-May high on a weekly
closing basis, thus confirming that an intermediate-term bottom was put in place
in early-May and projecting a test of the 2015 peak within the next couple of
months. The question stems from our assessment that the Dollar Index has been
much weaker than it should have been given the fundamental backdrop, or, to put
it more accurately, the euro has been much stronger relative to the US$ than it
should have been given the fundamental backdrop.
How is the fundamental
backdrop US$-bullish/euro-bearish? Let us count the ways, from least important
to most important.
1) The European Union has started to come apart, with
the refugee/migration crisis apparently acting as the catalyst by shining a
spotlight on individual countries' loss of sovereignty. The pressure is now
building throughout Europe to hold EU-independence referenda, but there's a high
risk that, unlike the UK situation, the incumbent political leadership in most
EU-member states will not allow the pressure to be relieved via a democratic
process. This could mean that it ends up being relieved in more violent and
destabilising ways.
2) The ECB has been setting new standards in
central-banking imprudence and destructiveness. Moreover, with Mario Draghi, a
man who possesses the dangerous combination of extreme arrogance and extreme
ignorance, likely to remain at the helm until 2019, there's a high probability
that the current policy direction will be maintained.
3) The strength of
European equities relative to US equities usually determines the strength of the
euro relative to the US$. The following chart illustrates this relationship over
the past three years using the EZU/SPY ratio to indicate the relative strength
of European equities, but note that the relationship has been in force since the
birth of the euro.
With European equities having trended lower relative
to US equities since early-December of last year (as indicated on our chart by
the decline in the EZU/SPY ratio), the implication is that the euro should have
been trending downward over the past 7 months and should probably now be trading
below par. Instead, it has gained some ground.
4) According to the historical record, of equal importance to the strength
of European equities relative to US equities is the strength of the European
banking sector relative to the US banking sector. The relationship between the
euro and the strength of European banks relative to US banks is logical and is
illustrated by the following chart (the EUFN/KBE ratio is a proxy for the
relative performance of the European banking sector).
The chart displayed
below shows the same divergence over the past seven months as the chart
displayed above. It seems that the euro SHOULD have been in a powerful downward
trend during this period, but obviously it wasn't.
The question is: Why has the euro/US$ exchange rate defied the
above-mentioned fundamental forces?
One possibility is that these
euro-bearish/US$-bullish influences have been counteracted by another
fundamental factor, but this doesn't seem like a viable explanation to us. As
far as we can tell, at a fundamental level the euro had nothing going for it
over the past seven months.
We suspect that the answer to the question
has nothing to do with fundamental currency-market drivers and almost everything
to do with the overshoot that happened during the first 10 weeks of last year.
You should be able to see what we mean if you take another look at the above
charts and zoom in on the first quarter of 2015. Notice that the euro plunged
from 117 to 105 despite there being relative strength in European equities and
relative strength in the European banking sector.
Based on the most
important short- and intermediate-term drivers of the euro's performance
relative to the US$, the euro should have bottomed near the beginning of 2015 at
around 117 and the Dollar Index should have peaked at the same time at around
92. Instead, momentum-inspired speculation drove the euro down to 105 and the
Dollar Index up to 101.
Now, if currency-market fundamentals justified a
Dollar Index peak of no more than 92 in Q1-2015, then what happened over the
past seven months can be understood as a divergence that brought prices back
into line with fundamentals. In effect, the dollar's 'fundamental value' (we use
the term loosely) has been steadily rising this year but hasn't yet resulted in
a net price gain because the price was too high (relative to the euro) to begin
with.
Current Market Situation
By
ending last week above its late-May high the Dollar Index has provided evidence
that an intermediate-term bottom was put in place in early-May. Unfortunately,
the evidence was diluted to some extent by the dollar's inability to gain any
ground and close above its 200-day MA last Friday in response to a
superficially-strong US Employment Report.
Last week's breakout suggests
the potential for the Dollar Index to test its 2015 high within the coming two
months. It needs to remain above 96 on a weekly closing basis to maintain this
potential.
Updates
on Stock Selections
Notes: 1) To review the complete list of current TSI stock selections, logon at
http://www.speculative-investor.com/new/market_logon.asp
and then click on "Stock Selections" in the menu. When at the Stock
Selections page, click on a stock's symbol to bring-up an archive of
our comments on the stock in question. 2) The Small Stock Watch List is
located at http://www.speculative-investor.com/new/smallstockwatch.html
 Company
news/developments for the week ending Friday 8th July 2016:
Company
news/developments for the week ending Friday 8th July 2016:
*Ivanhoe Mines (IVN.TO) reported the results of initial
metallurgical tests done on a sample of drill core from the Kakula Discovery
zone at the Kamoa copper project.
The tests achieved copper recoveries of
86%, produced a copper concentrate with a high grade of 53% copper, and
indicated that material from Kamoa's Kakula and Kansoko zones (the main deposit)
could be processed through the same concentrator plant.
The results of
metallurgical testing usually don't move the stock price unless they reveal a
major problem, but this type of testing is critical and should be done early in
the exploration process. The results from metallurgical testing at Kamoa have
been positive to date.
*Pilot Gold (PLG.TO) is
mainly of interest to us because of its exploration-stage gold projects.
However, PLG also owns 40% of the Halilaga copper-gold project in Turkey (Teck
owns the other 60%). With the improving intermediate-term outlook for copper,
Halilaga becomes a more important asset and of greater interest to us.
Halilaga is a low-grade copper-gold porphyry deposit with a total resource
comprising 2.1B pounds of copper and 3.3M ounces of gold (roughly half
Indicated, half Inferred). A revised PEA completed in early-2015 suggested that
the project could be developed into a mine with robust economics at $1200/oz for
gold and $2.90/pound for copper. At these metals prices the NPV(7%) and IRR are
estimated to be US$474M and 43%, respectively. 40% of US$474M (PLG's share) is
US$190M, or about 2.5-times PLG's current market cap. Furthermore, the figures
in the revised PEA suggested that the project might still be viable at $1200/oz
for gold and $2.25/pound for copper.
If the copper price is in the
process of making a sustained turn to the upside then Halilaga is in the process
of becoming a lot more valuable, but as far as we can tell the stock market is
presently assigning almost no value to this project.
*Ramelius
Resources (RMS.AX) announced its FY2016 (1 July 2015 through to 30 June
2016) gold production and FY2017 production guidance.
Production during
the June quarter was above the top-end of the 28K-32K-oz guidance, which enabled
the company to slightly exceed its 110K-oz production guidance for the full
year. Moreover, gold production during FY2017 is expected to rise to 135K ounces
thanks to a full year's contribution of 55K ounces from the newly-commissioned
Vivien mine.
If we could be confident that RMS was going to continue
producing 110K-130K ounces of gold per year then we could justify a stock price
of A$1.00/share at the current gold price (the stock closed at A$0.56 last
Friday). However, maintaining an annual production rate in excess of 100K ounces
currently requires finding new deposits near the processing plant and bringing
new small-scale mines into operation every year or two. The lack of production
certainty when looking beyond the next 12 months warrants a discount to full
valuation, but what that discount should be is subjective.
*Resolute
Mining (RSG.AX) announced its FY2016 (1 July 2015 through to 30 June
2016) gold production and FY2017 production guidance.
The company met its
FY2016 production forecast of 315K ounces at a slightly-lower-than-expected AISC
(A$1210/oz versus A$1220/oz). FY2017 production is expected to be slightly lower
at around 300K ounces at a higher AISC of A$1280/oz (US$960).
According
to the company's press release, all of the FY2017 production from its flagship
Syama gold mine (Mali) will come from stockpiles and open-pit mining. This
implies that the Syama underground expansion won't begin to have an effect on
gold output until FY2018. Once complete, the Syama underground expansion will
boost Syama's production to 250K ounces per year (50K ounces more than the
current rate) and reduce the production cost.
RSG continues to perform
well on the ground and in the stock market. Despite the massive gains in its
stock price since the start of this year we think it makes sense to maintain
significant exposure, although a prudent speculator would have done some
profit-taking by now.
Solitario
Exploration and Royalty (XPL, SLR.TO). Shares: 39M issued, 41M fully diluted.
Recent price: US$0.79
We introduced XPL and added it to the TSI
Stocks List (at US$0.57) in the email sent to subscribers last Tuesday. Today we
are providing a bit more detail.
XPL's story is simple. The company has
two main assets, the first of which is easy to value and the second of which is
impossible to value at this time. The easy-to-value asset reduces the downside
risk while the impossible-to-value asset provides the upside potential.
The easy-to-value asset is the company's strong balance sheet. XPL has US$17M of
working capital (cash, US Treasury securities and fully-insured CDs) and no
debt. In effect, about 60% of its current market cap is covered by cash.
The impossible-to-value asset is XPL's 30% stake in the exploration-stage
Bongara zinc project in Peru. The other 70% of the project is owned by Milpo,
the second-largest zinc miner in Peru and a well-financed company.
XPL is
carried to production at Bongara, meaning that it won't have to pay anything for
the project's exploration and development until commercial production is
achieved. At that point, XPL would be obligated to start paying-off its 30%
share of the construction cost by using 50% of its share of the net proceeds of
production.
The project, however, is many years from production and at
this stage doesn't even have a PEA. That's why it is impossible to value. What
we do know is that the currently-defined resource comprises about 3.4 billion
pounds of zinc (across all categories) at a zinc-equivalent average grade of
around 13%. It's a rare project that contains a few billion pounds of zinc at
such a high grade.
Although we can't quantify the value of XPL's 30%
stake in the Bongara project it's likely that it is many times the US$10M
implied by XPL's current enterprise value.
The risk with XPL is currently
limited by the company's US$0.43/share of cash, but there are still risks.
There's the risk that management will blow the cash on an ill-conceived
acquisition. Based on past performance this is very unlikely, but it can't be
ruled out. There's the risk that Milpo will move Bongara forward at a snail's
pace due to the fact that for this relatively-large company it is just one of
several 'irons in the fire'. And there's permitting risk, which, in Peru, means
the risk that the local community will not be in favour of the project.
Unlike Taseko Mines (TGB), which was also added to the TSI List via the email
sent to subscribers early last week, XPL is not a leveraged play on base-metal
prices. It's a stock that is potentially very under-valued at current metal
prices and would be best suited to speculators prepared to wait a couple of
years (if need be) for the story to unfold.
The stock price broke out of
a basing pattern and moved sharply higher over the final four trading days of
last week, which makes it a little riskier than it was when we sent the email
last Tuesday. Based on the chart pattern the optimum place for new buying would
be around US$0.60.
New
stock selection: Sprott Resource Corp. (SCP.TO). Shares: 97M. Recent price:
C$0.60
SCP is an investment company focused at this time on
energy (oil, O&G drilling and coal) and agriculture investments. The stock looks
attractive to us near its current price for two main reasons. First, we are
becoming increasingly bullish on commodities. Second, it is trading at a
discount of almost 50% to its net asset value (NAV).
Also worth
mentioning is that SCP is one of the few stocks that provides exposure to
farming. SCP provides this exposure via its stake in "One Earth Farms", a large
privately-owned farming operation in Canada.
One risk is that SCP's
balance sheet is weak, in that at the date of the latest financial statements
(31st March) the company had almost no cash and a $16M loan due for repayment in
November. However, this risk is not a major concern because a) the loan was
provided by another part of the Sprott empire (Sprott Lending) and b) SCP has
since generated $12M of cash via an asset sale.
Another risk is that a
little more than half of the company's NAV is associated with investments in
private companies. These investments are both illiquid and difficult to value.
The opportunity here is that as sentiment towards commodity-related
investments improves, SCP's assets will increase in value and its discount to
NAV will shrink. This combination creates the potential for at least a doubling
of the stock price over the coming year or two.
Note that we don't see a
good reason to buy commodity-related stocks such as SCP with any urgency at this
time. As is almost always the case, a gradual scaling-in process would be
appropriate.
Potential
future TSI stock selection: Carpathian Gold (CPN.CN). Shares: 907M. Recent
price: C$0.075
CPN is a stock that we traded unsuccessfully
during 2011-2013. At that time the company was advancing two projects -- the
exploration-stage Rovina Valley (RV) gold-copper project in Romania and the
construction-stage RDM gold project in Brazil. We were primarily interested in
the RV project, but it was the debt taken on for the construction of RDM that
created a life-threatening financial problem for the company and prompted us to
exit with a loss.
The company now has a new lease on life. All of the
assets and liabilities associated with the Brazilian project are gone, leaving
the RV project as the only focal point. Furthermore, the Forbes and Manhattan
group has recently invested C$10M via a private placement and installed new
management and a new board of directors. A consequence is that the company is
now debt free with about C$10M of cash to be used for moving the RV project
forward.
CPN provides exposure to both gold and copper. The exposure is
highly speculative, but, unlike some other exploration-stage gold-mining stocks
that have been bid-up aggressively over the past few months, CPN's project has a
realistic chance of eventually being developed into an operating mine.
The RV project has a low-grade, porphyry-style deposit comprising 3.1M ounces of
gold and 759M pounds of copper in the M&I category plus 3.9M ounces of gold and
663M pounds of copper in the Inferred category. A PEA completed way back in
March-2010 estimated that with initial capital expenditure of $509M the project
could be developed into a mine that produced an average of 200K ounces of gold
and 50M pounds of copper per year for 19 years at a cash cost of $379/ounce
(taking copper as a byproduct). Assuming a gold price of $1000/oz, a copper
price of $3.00/pound and a conservative discount rate of 10%, the project's net
present value (NPV) was estimated to be US$544M.
The economics indicated
by the PEA are too far out of date to be relied on, but they suggest the
potential for the project to be viable at or not far from current metal prices.
As evidenced by a $20M investment made several years ago, Barrick Gold also
believed that the RV project had the potential to be economically viable.
In today's frothy market, CPN's current market cap (at C$0.075/share) of
around US$50M offers decent value given the risks. Furthermore, the stock has
reasonable liquidity in the C$0.07-C$0.08 range. However, we aren't going to add
CPN to the TSI List at this time, the reason being that it trades on a minor
Canadian exchange called the CSE. Canada-based accounts should have no trouble
trading on the CSE, but accounts outside Canada might not have access to this
exchange.
Chart Sources
Charts appearing in today's commentary
are courtesy of:
http://stockcharts.com/index.html
http://www.stockwatch.com/
http://www.barchart.com/
http://www.sharelynx.com/
