|
-- for the Week Commencing 11th August 2003, 2nd Page
Gold and
the Dollar
Junior Gold Stock Comparison
In the 25th June Interim Update we
included a valuation comparison of 15 junior gold stocks. Below are updated
versions of the comparison tables covering the original 15 stocks plus
6 new additions.
In the below tables EV stands for "enterprise
value" and TEV stands for "theoretical enterprise value". The enterprise
value (EV) for each gold producer is calculated by adding the company's
net debt to its stock market capitalisation, where net debt is total debt
minus cash. In the case of companies that are not yet in production (about
half the companies in the list) the calculation of the current EV also
includes an estimate of future mine development cost (by doing this we
hopefully create more of a level playing field). In other words, EV represents
the current total market value of each company. TEV, on the other hand,
is what each company's gold reserves are theoretically worth at a particular
gold price. It is calculated by multiplying a company's net profit margin
per ounce of gold (the assumed gold price minus the total cost (expected
future cost in the case of non-producers) to produce an ounce of gold)
by that company's total gold reserves. In the tables we've noted each company's
TEV at $350, $425 and $500, and also the percentage change that would be
needed to bring the current market price into line with the calculated
TEV. In other words, the percentages shown in the final three columns reflect
the gain that the market would bestow on each stock at various gold prices
if the valuation criteria we have used in compiling this table were the
market's only consideration.
In the first of the following tables
the companies are shown in order of value, from best value at the top to
worst value at the bottom, assuming a gold price of $350. In the second
table the companies are once again shown in order of value, but this time
assuming a gold price of $500. Note that "Adj. Resv." in the tables stands
for "adjusted reserves" and is calculated, for each company, by adding
50% of the company's "measured and indicated resource" to its "proven and
probable reserve".
|
Company Name
|
Symbol
|
Recent Price (US$)
|
Ent. Value (US$M)
|
Total Cost per ounce
|
Adj. Resv. (Moz)
|
EV $ per oz Res.
|
TEV at $350
|
TEV at $425
|
TEV at $500
|
Gain at $350
|
Gain at $425
|
Gain at $500
|
| Bendigo
Gold |
BDG |
0.15 |
285 |
200 |
6.0 |
47 |
900 |
1350 |
1800 |
216% |
374% |
532% |
| Gallery
Gold |
GGN |
0.11 |
74 |
240 |
1.8 |
42 |
193 |
324 |
455 |
160% |
336% |
513% |
| Desert
Sun Mining |
DSM |
0.93 |
53 |
240 |
1.2 |
46 |
128 |
215 |
302 |
139% |
301% |
464% |
| Afrikander
Lease |
AFKDY |
0.67 |
147 |
247 |
3.1 |
47 |
319 |
552 |
784 |
117% |
275% |
433% |
| Redback
Mining |
RBK |
0.27 |
82 |
240 |
1.6 |
52 |
172 |
289 |
406 |
110% |
253% |
396% |
| Metallica
Resources |
MR |
1.15 |
89 |
300 |
2.8 |
32 |
140 |
350 |
560 |
57% |
291% |
526% |
| American
Bonanza |
BZA |
0.22 |
58 |
210 |
0.6 |
97 |
84 |
129 |
174 |
44% |
121% |
198% |
| Western
Silver |
WTZ |
3.03 |
169 |
260 |
2.7 |
63 |
243 |
446 |
648 |
44% |
163% |
283% |
| Metallic
Ventures |
MVG |
2.76 |
113 |
260 |
1.6 |
70 |
144 |
264 |
384 |
28% |
134% |
241% |
| Cumberland
Resources |
CBD |
2.56 |
193 |
228 |
2.0 |
96 |
244 |
394 |
544 |
27% |
105% |
183% |
| McWatters
Mining |
MWA |
0.10 |
54 |
321 |
2.3 |
24 |
66 |
238 |
411 |
21% |
339% |
656% |
| Golden
Phoenix |
GPXM |
0.35 |
54 |
300 |
1.3 |
43 |
64 |
160 |
256 |
18% |
194% |
370% |
| Emporer
Mines |
EMP |
0.36 |
36 |
333 |
2.3 |
16 |
38 |
211 |
383 |
6% |
480% |
955% |
| Eldorado
Gold |
EGO |
2.16 |
494 |
276 |
7.1 |
70 |
520 |
1049 |
1578 |
5% |
112% |
219% |
| Apollo
Gold |
APG |
2.07 |
131 |
300 |
2.6 |
51 |
129 |
322 |
515 |
-2% |
145% |
293% |
| Aquiline
Resources |
AQI |
0.51 |
29 |
240 |
0.3 |
115 |
28 |
46 |
65 |
-4% |
61% |
127% |
| Novagold |
NRI |
3.60 |
269 |
250 |
2.5 |
108 |
250 |
438 |
625 |
-7% |
63% |
132% |
| Golden
Star Resources |
GSS |
3.55 |
333 |
243 |
2.7 |
126 |
284 |
483 |
681 |
-15% |
45% |
104% |
| Orvana
Minerals |
ORV |
1.02 |
133 |
160 |
0.6 |
238 |
106 |
148 |
190 |
-20% |
11% |
43% |
| Richmont
Mines |
RIC |
3.65 |
30 |
335 |
0.5 |
57 |
8 |
48 |
88 |
-74% |
59% |
191% |
| Bema
Gold |
BGO |
1.98 |
663 |
333 |
9.6 |
69 |
168 |
888 |
1608 |
-75% |
34% |
143% |
|
Company Name
|
Symbol
|
Recent Price (US$)
|
Ent. Value (US$M)
|
Total Cost per ounce
|
Adj. Resv. (Moz)
|
EV $ per oz Res.
|
TEV at $350
|
TEV at $425
|
TEV at $500
|
Gain at $350
|
Gain at $425
|
Gain at $500
|
| Emporer
Mines |
EMP |
0.36 |
36 |
333 |
2.3 |
16 |
38 |
211 |
383 |
6% |
480% |
955% |
| McWatters
Mining |
MWA |
0.10 |
54 |
321 |
2.3 |
24 |
66 |
238 |
411 |
21% |
339% |
656% |
| Bendigo
Gold |
BDG |
0.15 |
285 |
200 |
6.0 |
47 |
900 |
1350 |
1800 |
216% |
374% |
532% |
| Metallica
Resources |
MR |
1.15 |
89 |
300 |
2.8 |
32 |
140 |
350 |
560 |
57% |
291% |
526% |
| Gallery
Gold |
GGN |
0.11 |
74 |
240 |
1.8 |
42 |
193 |
324 |
455 |
160% |
336% |
513% |
| Desert
Sun Mining |
DSM |
0.93 |
53 |
240 |
1.2 |
46 |
128 |
215 |
302 |
139% |
301% |
464% |
| Afrikander
Lease |
AFKDY |
0.67 |
147 |
247 |
3.1 |
47 |
319 |
552 |
784 |
117% |
275% |
433% |
| Redback
Mining |
RBK |
0.27 |
82 |
240 |
1.6 |
52 |
172 |
289 |
406 |
110% |
253% |
396% |
| Golden
Phoenix |
GPXM |
0.35 |
54 |
300 |
1.3 |
43 |
64 |
160 |
256 |
18% |
194% |
370% |
| Apollo
Gold |
APG |
2.07 |
131 |
300 |
2.6 |
51 |
129 |
322 |
515 |
-2% |
145% |
293% |
| Western
Silver |
WTZ |
3.03 |
169 |
260 |
2.7 |
63 |
243 |
446 |
648 |
44% |
163% |
283% |
| Metallic
Ventures |
MVG |
2.76 |
113 |
260 |
1.6 |
70 |
144 |
264 |
384 |
28% |
134% |
241% |
| Eldorado
Gold |
EGO |
2.16 |
494 |
276 |
7.1 |
70 |
520 |
1049 |
1578 |
5% |
112% |
219% |
| American
Bonanza |
BZA |
0.22 |
58 |
210 |
0.6 |
97 |
84 |
129 |
174 |
44% |
121% |
198% |
| Richmont
Mines |
RIC |
3.65 |
30 |
335 |
0.5 |
57 |
8 |
48 |
88 |
-74% |
59% |
191% |
| Cumberland
Resources |
CBD |
2.56 |
193 |
228 |
2.0 |
96 |
244 |
394 |
544 |
27% |
105% |
183% |
| Bema
Gold |
BGO |
1.98 |
663 |
333 |
9.6 |
69 |
168 |
888 |
1608 |
-75% |
34% |
143% |
| Novagold |
NRI |
3.60 |
269 |
250 |
2.5 |
108 |
250 |
438 |
625 |
-7% |
63% |
132% |
| Aquiline
Resources |
AQI |
0.51 |
29 |
240 |
0.3 |
115 |
28 |
46 |
65 |
-4% |
61% |
127% |
| Golden
Star Resources |
GSS |
3.55 |
333 |
243 |
2.7 |
126 |
284 |
483 |
681 |
-15% |
45% |
104% |
| Orvana
Minerals |
ORV |
1.02 |
133 |
160 |
0.6 |
238 |
106 |
148 |
190 |
-20% |
11% |
43% |
Notes and conclusions:
1. Please read the analysis that accompanied
the comparison tables in the 25th
June Interim Update because the comments made about specific stocks
at that time still apply. Most of the below comments deal with the new
additions to the tables.
2. We haven't taken hedging into account
in our valuation comparison. Of the companies included in the above tables
only Emporer Mines (ASX: EMP), which operates a mine in Fiji, and McWatters
(TSX: MWA) have done significant hedging of their future gold production.
Had we considered the effects of these hedge books when estimating the
values of these companies at a $500 gold price the change in our valuation
of MWA would not have been material but the valuation of EMP would probably
have fallen by 20%-30%. However, EMP is presently so under-valued that
even if we lopped 30% off its theoretical value at a $500 gold price in
order to account for the opportunity cost of the hedge book the stock would
still be at the top of the second table.
Durban Deep (DRD) owns 20% of EMP and
DRD's CEO (Mark Wellesley-Wood) sits on EMP's board. Furthermore, Wellesley-Wood
recently said that DRD was looking to expand its Australasian business
by acquiring a company or companies that are already in production (as
opposed to acquiring exploration-stage companies). Given DRD's current
involvement and EMP's extreme relative under-valuation it is not much of
a stretch to conclude that DRD will eventually make an offer for EMP. Hopefully,
the offer will come after the stock has already moved well above its current
level.
3. When a company appears to be extremely
under-valued relative to its peers there is usually a good reason. In EMP's
case there is a significant hedge book, political risk because the company
operates in Fiji, and poor recent production results due to lower grades.
In MWA's case the stock is very cheap because the company has issued a
massive number of new shares over the past several months in order to raise
money and because there have been some operational problems. An investor
therefore needs to ask himself/herself the following question: Is the apparent
discount in the price sufficient to make the stock a buy in spite of the
obvious problems? In the case of both EMP and MWA we think the answer to
the question is yes and that both stocks have attractive risk/reward ratios
at their current prices.
4. Metallica Resources (OTCBB: METLF)
scored well in terms of its leverage to the gold price. Actually, half
of this company's in-ground resource is silver so the stock is as much
a silver play as it is a gold play. The company is probably going to issue
a large amount of new equity at some point over the next 6 months. When
the stock was added to the TSI Stocks List we therefore suggested that
investors take an initial position immediately and then add to the position
into significant weakness following an equity raising.
5. Afrikander Lease (JSE: AFL, OTC:
AFKDY) is a junior South African gold producer that is expected to grow
very quickly over the next few years (from 70,000 ounces of production
this year to annual production of 300,000 ounces in 2006). Like all South
African mining companies AFL is going to struggle if the Rand continues
to strengthen, but if the Rand started to weaken (see the Rand chart included
later in today's commentary) then AFL would be a reasonable stock to own
due to its strong growth profile.
6. Gallery Gold (ASX: GGN) is about
to commence construction of a 100K oz/year mine at its Mupane project in
Botswana and also has substantial gold resources in Tanzania. The stock
represents very good value at its current price. As is the case with a
number of the other small gold mining companies we follow, at some point
over the next few months GGN will need to raise a substantial sum of money
in order to finance mine construction. This, when it occurs, will probably
put some pressure on the stock price.
7. Both NovaGold (TSX: NRI) and Aquiline
(TSXV: AQI) fared quite poorly in terms of their relative valuations at
a gold price of $500, but this is because only current reserves and measured/indicated
resources are considered in the above tables. In NRI's case there is a
massive inferred resource at Donlin Creek that will almost certainly be
brought into the measured and indicated category over the next year or
two. In AQI's case the drill results released over the past month strongly
suggest that its eventual resource will be much greater than the 500K ounce
figure used in our calculations.
Gold Forecast
In the 23rd July Interim Update we
included a chart illustrating what we considered to be the two most likely
outcomes for the gold price over the remainder of the year. Both outcomes
were bullish, with one being that a major advance was already in progress
and the other being that the consolidation process would continue for a
couple more months before a major advance got underway. Below is an updated
version of this chart. As was the case in the previous commentary, we've
included a chart of the euro below the chart of the gold price since any
gold price forecast must be consistent with a currency market forecast
(and vice versa).
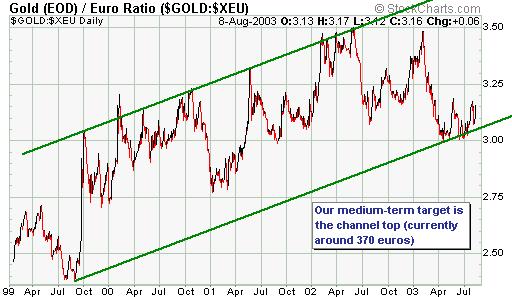
In order to arrive at a reasonable
upside target for the gold price over the next several months we've used
a chart of the gold price in euros. We've done this because the major channel
top for the euro gold price is well defined. Previous rallies in the gold
price over the past few years have ended at the top of the channel shown
on the below chart and if the current rally does the same then a logical
upside target for gold is 370 euros. Assuming a euro-US$ exchange rate
of 1.25 gives us a medium-term upside target for the US$ gold price of
around $460.
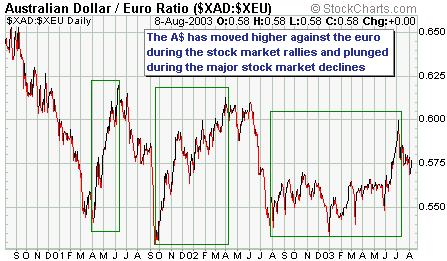
Currency Market Update
Below is a chart showing the Australian
Dollar in terms of the euro (the line on the chart rises when the A$ is
out-performing the euro). Over the past few years the A$ has done well
relative to the euro during those periods when the US stock market has
been strong and has fared poorly during the stock market declines (the
boxes on the chart identify the periods when the stock market was strong
or stable). The AUD-EUR rate reversed lower at around the time the stock
market was peaking in June-July. If the stock market behaves roughly in
line with our current expectations then the A$ will probably be very weak,
relative to the euro, during the first half of next year.
After being one of the weakest currencies
in the world for many years the South African Rand has been the strongest
currency in the world since late-2001. However, the below chart shows that
it wouldn't take much of a fall in the Rand to break the trend-line that
began almost 2 years ago (note that a falling line on the chart indicates
a strengthening Rand). It is quite possible that the US$-Rand exchange
rate bottomed in April and that the recent weakness (strength in the Rand
relative to the US$) is a test of that bottom. A decisive move above the
trend-line drawn on this chart would suggest that this was, in fact, the
case, and that a substantial counter-trend rally was underway. Such a rally
in the US$ relative to the Rand would, of course, benefit the SA-based
miners.
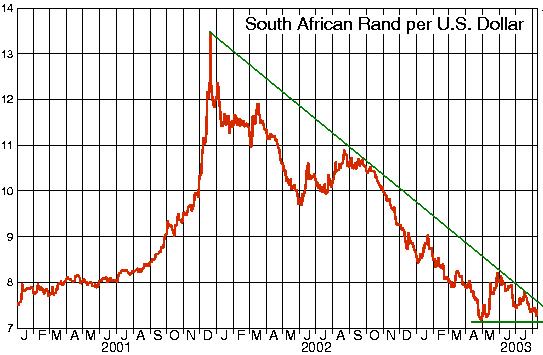
Chart source: http://pacific.commerce.ubc.ca/xr/plot.html
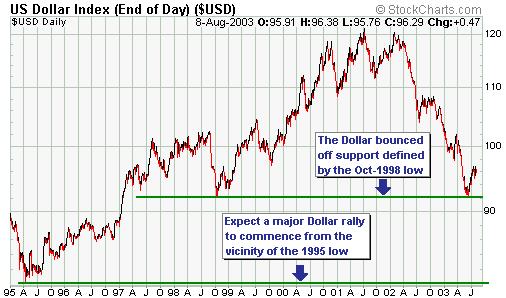
Earlier this year the Dollar Index
bounced off support defined by its 1998 low, but we don't have any technical
or fundamental evidence that a major low is in place for the US$. However,
we do expect the dollar to receive substantial buying support once it drops
to the vicinity of its 1995 low. We expect that the 1995 low will be reached
by mid 2004.
Current Market Situation
Below is a daily chart of December
gold futures. After having bounced off its 200-day moving average during
the week before last gold had managed to move above both its 18-day and
50-day moving averages by the end of last week. Provided gold doesn't close
down by more than $2 on Monday we will therefore have confirmation that
a pullback low was put in place on 1st August.
We are skeptical of gold's ability
to hold above the 200-day moving average during its recent pullbacks because
this widely-watched level often has to be broken before a sustainable bottom
occurs (as was the case earlier this year). However, the behaviour of the
gold shares suggests that the gold price is about to move sharply higher.
Anyway, regardless of whether or not we get a drop below the 200-day moving
average over the next few weeks we will be very surprised if gold does
not trade well above $400 before the end of this year.
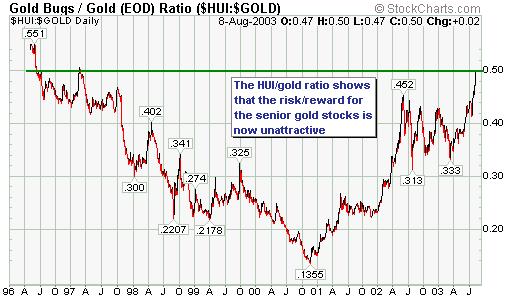
Below is a chart of the HUI/gold ratio.
The rise in the ratio to near its mid-1996 level suggests that there is
little additional upside potential in the senior gold stocks relative
to the gold price. In other words, any further gains in the senior
gold stocks will probably need to be accompanied by equivalent percentage
gains in the gold price. If we owned any large-cap gold stocks (we don't)
we'd be starting to scale-out now and would probably be shifting our investment
funds from the stocks to the bullion. As confirmed by the valuation comparison
included earlier in today's commentary there is, however, a lot of potential
upside in the junior gold stocks and we are not inclined to take any profits
on our junior gold stocks at this time. However, we will probably exit
some of the juniors if the gold price accelerates higher over the next
few weeks. When the appropriate time to do some selling does arrive, the
decision as to which stocks to exit will be made by taking into account
both valuation and price action.
By the way, as we've discussed in the
past it makes little sense to forecast the gold price based on the dollar's
current price action and to forecast gold stocks based on gold's current
price action. It does, however, make sense to forecast gold based on what
is happening to gold stocks and to forecast the dollar based on what is
happening to gold. In the current situation, with gold stocks leading to
the upside, it is likely that gold stocks will peak before gold peaks and
that gold will peak before (perhaps well before) the dollar bottoms. For
example, we wouldn't be surprised if the final $50 up-move in the gold
price occurs AFTER the major gold stock indices have peaked and if the
final plunge in the US$ occurs AFTER the gold price has peaked.
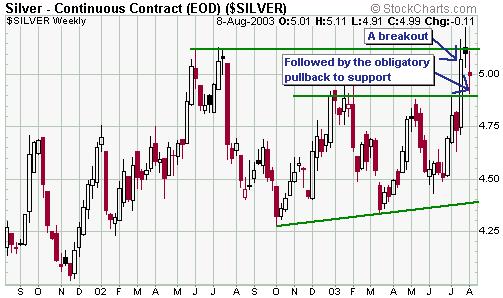
Below is a weekly chart of the silver
price. Silver did what it was supposed to do over the past week and pulled
back to the former resistance area (now support). We continue to expect
that silver will make its way up to at least $5.80 over the next few months.
Update
on Stock Selections
 In
the 30th July Interim Update we briefly discussed the way junior mining
companies use private placements of new shares to raise money and said
that the best the management of these companies can generally do is to
time the placements to coincide with stock price strength. Wheaton River
(TSX: WRM, AMEX: WHT) is definitely not in the junior category anymore,
but its recent announcement of a large equity placement is a good example
of how such deals ideally should be timed. In
the 30th July Interim Update we briefly discussed the way junior mining
companies use private placements of new shares to raise money and said
that the best the management of these companies can generally do is to
time the placements to coincide with stock price strength. Wheaton River
(TSX: WRM, AMEX: WHT) is definitely not in the junior category anymore,
but its recent announcement of a large equity placement is a good example
of how such deals ideally should be timed.
Below is a chart of WRM. On the day
prior to the announcement of the new issue WRM had hit resistance defined
by the all-time high reached in May of 2002, so a pullback in the short-term
was likely with or without the new issue (especially given the large advance
in the shares over the preceding 2 months). As such, the new equity issue
simply assisted in prompting a pullback that would have happened anyway.
Also, the new issue was priced at a slight premium to the market price
at the time and the warrants issued as part of the deal were well out of
the money. This means that the financing will not dilute the value of existing
shares.
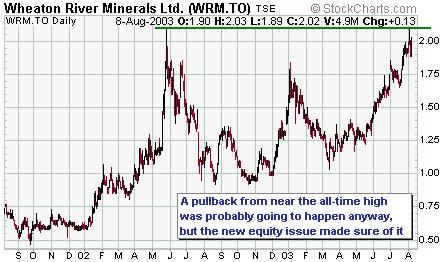
Given the large size of the financing
(C$100M) it is probable that WRM's management has another acquisition in
mind.
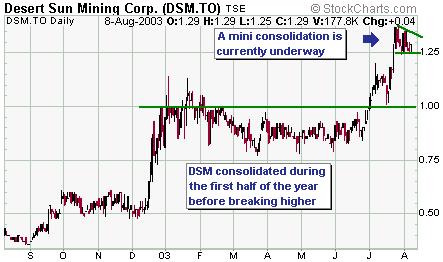
The
feasibility study on Desert Sun Mining's (TSX: DSM) Jacobina gold project
in Brazil is due to be complete later this month. A positive feasibility
study (we see no reason why it won't be positive) will confirm that DSM
is worth more than C$2/share assuming no increase in the gold price.
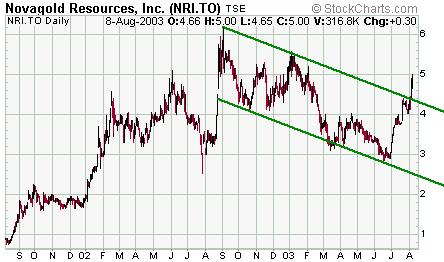
In
the 2nd July Interim Update we explained why NovaGold (TSX: NRI) was probably
worth around C$6.60/share assuming no increase in the gold price. NRI has
since moved up from $3.25 to $5.00 and is still reasonable value, although
the stock is obviously not as attractive now as it was 6 weeks ago. We
don't think it makes sense to purchase NRI now given the recent surge in
its price, but buying following a pullback to near the top of its former
channel (see chart below) might make sense for those looking for relatively
low-risk exposure to some gold juniors.
Although
we think the odds favour new recovery highs in both the S&P500 and
the Dow over the next few months, the risk/reward ratio for the US stock
market is terrible. If new highs are achieved they will most likely only
be a few percent above the June-July peaks, but we estimate that the market
has downside risk of 30%-50%. As such, longer-term investors should remain
out of the US market except for a few special situations such as gold stocks
and, to a much lesser extent, commodity-cyclical stocks.
Due to the market's poor risk/reward
we are going to add another QQQ put option position to the Stocks List
at this time. We'll add a second position in the QQQ December-2003 $25
put options (QAVXY) using Friday's closing price of US$0.60 for record
purposes. If the market falls sharply over the next few weeks we will probably
take the opportunity to exit all December-2003 put options with the aim
of entering longer-dated QQQ put options (options that expire during the
second half of 2004) later this year.
Copyright
Reminder
The commentaries that appear at TSI
are copyrighted material and may not be distributed, in full or in part,
without our written permission. In particular, please note that the posting
of extracts from TSI commentary at other web sites (for example, at discussion
boards) without our written permission is a breach of copyright.
Chart Sources
Charts appearing in today's commentary
are courtesy of:
http://stockcharts.com/index.html
http://bigcharts.marketwatch.com/
http://www.futuresource.com/

|
