![]()
![]()
![]()
![]()
-- Weekly Market Update for the Week Commencing 11th November 2019
Copyright
Reminder
The commentaries that appear at TSI
may not be distributed, in full or in part, without our written permission.
In particular, please note that the posting of extracts from TSI commentaries
at other web sites or providing links to TSI commentaries at other web
sites (for example, at discussion boards) without our written permission
is prohibited.
We reserve the right to immediately
terminate the subscription of any TSI subscriber who distributes the TSI
commentaries without our written permission.
True
Fundamentals Summary
[Notes:
1) The date shown next to the current True Fundamentals Model (TFM) signal is
when the most recent change occurred. 2) Charts of the Gold and Equity
TFMs are included in the "Charts and Indicators" section of the TSI web
site]
| Market | True Fundamentals Model (TFM) |
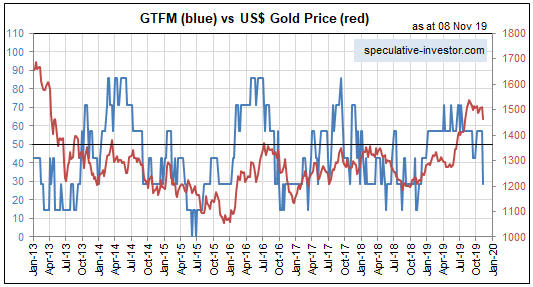
| Gold (US$ Price) | Bearish (08 Nov 2019) |
| US Equity (SPX) | Bearish (04 Oct 2019) |
| Currency (Dollar Index) | Neutral (15 Mar 2019) |
| Commodities (GNX) | Bearish (01 Jun 2018) |
Last week's posts at the TSI Blog
Banks
versus Gold, Part 2
Summary of current
thinking/positioning
1) The Dollar Index (DX) remains
range-bound, needing a weekly close below 96 to signal an
intermediate-term reversal to the downside or a weekly close above 99.5 to
signal an intermediate-term rally. We are anticipating the former, but we
are uncertain as to whether it will happen in the near future or during
the first half of next year.
2) Gold, silver and the associated
mining indices/ETFs resumed their corrections last week. Correction lows
could occur soon, but this is not a short-term buying opportunity due to
the risk of downward acceleration.
3) The Fed's new asset
monetisation program has increased the risk for bearish stock-market
speculators and clear signs of equity strength have appeared outside the
US. However, we suspect that the senior US stock indices are close to
short-term tops.
4) The T-Bond has dropped below its September low
and could be near a short-term bottom, but there is risk of downward
acceleration over the coming month or two. Whether or not a short-term
bottom is close at hand, there's a good chance that major price weakness
will be seen within the next 12 months. In other words, it looks like
higher interest rates are on the way.
5) Industrial commodities
such as oil and copper appear to be in the process of bottoming, with
intermediate-term price lows either already in place or likely to be in
place by early next year.
6) We are holding a cash reserve of
25%-30%.
Close to a
short-term bottom for the T-Bond?
About a month ago we noted on a
chart that the $130-$135 range was a realistic target for a short-term
bottom in the iShares 20+ Year Treasury ETF (TLT). The following daily
chart shows that TLT made it to the top of the aforementioned target range
late last week.
TLT, and therefore the T-Bond, could be close to a short-term bottom
in terms of both price and time, but the risk/reward does not favour a
long-side trade. The reason is that last week's break below the September
low creates the risk of downward acceleration over the next few weeks.
Cannabis Crash
Update
In the 14th October Weekly
Update we wrote about the crash in cannabis-related stocks and ETFs. Due
to the extreme selling pressure witnessed over the preceding several
weeks, we concluded that the cannabis sector was probably within a few
weeks of an intermediate-term bottom and that it would be reasonable to
take an initial position in HMLSF, MJ or CRON with the aim of averaging in
on further weakness or following evidence of a reversal. To reflect this
assessment we added the CRON January-2021 US$10.00 call option to the TSI
List at US$1.50.
The sector subsequently bounced and then dropped
to test the October low before reversing upward on Friday 8th November. As
illustrated by the following daily charts, HMLSF made a slightly lower low
whereas CRON made a slightly higher low last Thursday before rallying on
Friday.
We continue to like the cannabis sector for an
intermediate-term trade.
Oil's next
turning point
There's a strong tendency for
the oil price to make a multi-month high or low during the
December-February period, with the type of extreme (high or low)
determined by the price trend going into the period.
The current
chart pattern (see below) is noncommittal with regard to the coming
December-February turning-point window. One possibility is that the oil
price reverses downward without making significant additional headway and
spikes below support in the low-$50s within the next couple of months, in
the process setting an important low. Another possibility is that the oil
price soon breaks above resistance at $57-$58 and surges to the mid-$60s
or higher during December-January, in the process setting a high that
holds for at least a few months.
At this time we favour the first
possibility because it meshes with our current stock market outlook, but
the second possibility will become more likely if it turns out that we
have underestimated the bullish contingent's ability to extend the stock
market's short-term upward trend.
The Stock Market
Extraordinary Trade Deal
Mileage
We are impressed, nay stunned, at the amount of
mileage that US equity bulls have managed to get from the US-China trade
negotiations. If a trade deal had been struck between the US and China
governments 15-16 months ago, that is, shortly after the 'war' began, the
US economy would now be stronger but the stock market probably would be
lower. Instead, the tariffs and counter-tariffs, the threats, the
disruptions, the on-again/off-again negotiations, the uncertainty and the
relentless headlines have stymied economic progress while creating a
sentiment and monetary backdrop that perpetuated upward trends in the
senior stock indices.
The pattern over the past 16 months has
involved the following:
1) Negative news on the trade front.
2) A stock market sell-off due to concerns about the effects of
tariffs on the economy.
3) A turn for the better in trade-related
news.
4) A stock market rally driven by optimism regarding what
will happen to the economy after the trade dispute is put to bed.
This pattern has repeated several times and has, we suspect, given the
S&P500 Index a substantial net boost even though the deal that possibly
will be done within the next month will leave the US economy in a much
weaker state than it was prior to the start of the trade war.
The
above describes the sentiment-related stock-market fuel provided by the
trade war, but on its own this would have been insufficient to sustain the
bullish trend. There also had to be monetary assistance from the Fed.
Partly due to the economic weakness caused by the trade war, the Fed
shifted in record time from tightening to neutral to easing to aggressive
easing. The 'coup de grace' was the Fed's reintroduction of QE (but don't
you dare call it QE!) in early October, just 12 months after the Fed
Chairman intimated that the Fed's monetary tightening had a long way to
go.
In essence, the topsy-turvy US-China trade situation created
periodic sharp equity sell-offs that established sentiment platforms
capable of supporting subsequent multi-month rallies, and also helped to
transform the Fed from market head-wind to market tail-wind. The net
effect is an S&P500 Index that is probably higher than it would be if the
'trade war' had never happened.
A Bank Speculation
The following chart shows the recent upside breakout in the US Bank
Index (BKX) and the surge in the BKX/SPX ratio. The banking sector is now
short-term overbought in both absolute and relative terms, but if
long-term interest rates and the spread between long-term and short-term
interest rates have commenced cyclical upswings, which we suspect is the
case, then the banking sector's recent strength is the start of a trend
that should last at least 12 months.
The US banking industry doesn't operate in isolation. Instead, banks
around the world are interconnected. A consequence is that general
strength in US bank stocks should go with general strength in European
bank stocks.
We are interested in speculating on an
intermediate-term global rebound in the banking sector via call options on
one of the world's worst-performing major banks: Deutsche Bank (NYSE: DB).
Specifically, we have added the DB January-2021 US$10.00 Call Option to
the TSI List. The option ended last Friday's trading session with a
bid-ask spread of US$0.50-US$0.59, so we have used US$0.55 (roughly the
mid-point of the bid-ask spread) as the starting price for record
purposes.
DB's problems are well known, which is why the stock has
made only minor gains since hitting an all-time low in August. However,
the price action since June of this year has the look of a basing pattern.
Note that a daily close above US$8.00 would warn that the base was
nearing completion and that a meaningful rally was about to begin, whereas
a daily close below US$7.20 would warn that the stock was on its way to
new lows.
Usually when we suggest buying call options on a stock or an ETF the
trade also could be done by purchasing the underlying stock/ETF. For
example, our cannabis trade is reflected in the TSI List by a long-dated
call option on CRON, but for most of our readers it would make more sense
to buy CRON shares than to buy CRON call options. That's not the case with
the DB speculation, though. The reason is the uncomfortably high risk of
out-of-the-blue news that craters the stock.
Our thinking is that
over the next 12 months DB shares will either more than double in response
to a sector-wide rally or collapse to near zero due to bankruptcy. This
suggests that the stock itself does not have an attractive risk/reward
(100% potential reward versus 100% downside risk), but that the call
options mentioned above have reward potential of at least 1,000% versus
downside risk of 100%.
Current Market Situation
S&P500 earnings fell during each of the first three quarters of this
year and another decline is likely during the final quarter. Furthermore,
total US corporate profit peaked way back in 2014. 100% of the US stock
market's gain since then is due to multiple expansion and share buybacks.
Shares are bought today based on what the underlying company is
expected to earn in the future, not what the company earned in the past.
Consequently, by enlisting the appropriate optimistic forecasts of future
earnings it is always possible to justify current valuations. That these
forecasts never pan out is a minor issue.
Turning to the charts, we
find a market that by some measures has broken out to the upside and by
other measures has reached critical resistance. The weekly SPX chart
displayed below is an example of the former.
The following two daily charts are examples of the latter. They show
that the Dow Transportation Average (TRAN) and the Russell2000 ETF (IWM)
tested, but failed to close above, intermediate-term lateral resistance
last week.
We also find a market that can now be described as 'overbullish',
meaning that indicators of sentiment are stretched far enough into
optimistic territory to warn of short-term downside risk. Of particular
relevance, the bottom section of the following chart shows that the 10-day
MA of the equity put/call ratio has just hit a 12-month low and is where
it was when the SPX was peaking in September-October of last year.
We think that a multi-week correction will begin soon, with the scale
of the downturn being determined by what happens with the international
trade negotiations. A trade deal that removes existing tariffs could
ensure that the decline is limited to 3%-5%, while an obvious failure to
reach agreement probably would be the catalyst for an the SPX decline of
around 10%.
This week's
significant US economic events
[Notes:
1) The most important events
(to the markets) are shown
in bold. 2) A list of global economic events can be found
HERE]
| Date | Description |
| Monday Nov-11 | No important events scheduled |
| Tuesday Nov-12 | No important events scheduled |
| Wednesday Nov-13 |
CPI Treasury Budget |
| Thursday Nov-14 | PPI |
| Friday Nov-15 |
Retail Sales Industrial Production Business Inventories |
Gold and the Dollar
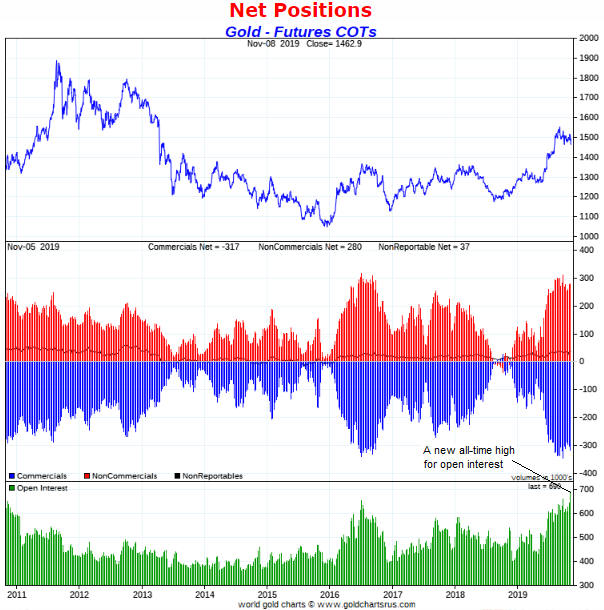
Furthermore, the HUI/gold ratio held up fairly well last week. It
dropped below its 40-day MA on Friday, but only by the smallest of
margins.
Our 1980s model projects an October-November correction low followed
by a rapid advance to new multi-year highs. A bottom this week would be
consistent with this model, but note that if the HUI makes new correction
lows after mid-November then we would view it as a critical deviation.
The gold-mining charts look fine on their own, in that the price
action of the past 2.5 months still has the look of a routine short-term
correction. However, gold-market sentiment and fundamentals suggest the
possibility that something more serious than a routine short-term
correction is underway.
What to do?
Short-term traders who bought the HUI and GDX pullbacks to 20-day MAs
on Tuesday 5th November should have been stopped out on 7th November with
small losses and should now be on the sidelines. New long positions will
not be advisable until there is evidence that a short-term bottom is in
place.
It would be reasonable for intermediate-term and long-term
traders to do some buying if/when the gold-mining ETFs drop to near their
200-day MAs, but caution will be warranted until there are significant
improvements in gold-market sentiment and/or fundamentals.
The Currency Market
Like it did in mid-October, last week
the Dollar Index (DX) rebounded from slightly below its 200-day MA. The
current rebound is stronger, but this really just prolongs the agony.
DX sentiment, fundamentals and price action are all neutral. In other
words, there's very little to go on.
Last week the CurrencyShares Japanese Yen Trust (FXY) pulled back to
the bottom of the wedge pattern drawn on the following daily chart. FXY is
a reasonable speculation on a short-term shift away from risk associated
with a stock market correction, provided that a tight stop is used.
Bear in mind that the Yen probably will remain under pressure if the
stock market extends its short-term upward trend into year-end, that is,
if the 'risk on' theme dominates for several more weeks.
Updates
on Stock Selections
Notes: 1) To review the complete list of current TSI stock selections, logon at
http://www.speculative-investor.com/new/market_logon.asp
and then click on "Stock Selections" in the menu. When at the Stock
Selections page, click on a stock's symbol to bring-up an archive of
our comments on the stock in question. 2) The Small Stock Watch List is
located at http://www.speculative-investor.com/new/smallstockwatch.html
![]() Company
news/developments for the week ending Friday 8th November 2019:
Company
news/developments for the week ending Friday 8th November 2019:
[Note: AISC = All-In Sustaining Cost, EBITDA = Earnings Before
Interest, Tax, Depreciation and Amortisation (a measure of cash flow), EV
= Enterprise Value or Electric Vehicle, FS = Feasibility Study, FY =
Financial Year, IRR = Internal Rate of Return, ISR = In-Situ Recovery, JV
= Joint Venture, MD&A = Management Discussion and Analysis, M&I = Measured
and Indicated, NAV = Net Asset Value, NPV(X%) = Net Present Value using a
discount rate of X%, NSR = Net Smelter Return or Net Smelter Royalty, P&P
= Proven and Probable, PEA = Preliminary Economic Assessment, PFS =
Pre-Feasibility Study]
*Alkane Resources (ALK.AX)
reported the third set of results from a 60,000m resource definition
drilling program undertaken at the San Antonio and Roswell targets. The
latest results included 13 metres grading 9.74g/t Au at San Antonio and 15
metres grading 6.22g/t Au at Roswell.
The next significant news is
expected to be an initial resource estimate for the Roswell prospect early
next month.
The combination of San Antonio and Roswell could enable
a multi-year extension to the TGO's life. If so, substantial value will be
added to the company.
*Peyto Exploration and
Development (PEY.TO) published its results for the quarter ending
30th September 2019.
PEY, a mid-tier Canadian natural gas (NG)
producer, has just achieved its 59th consecutive quarter of profitability,
despite the NG price in Canada reaching historically-low levels during the
quarter.
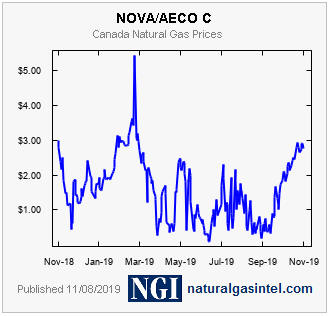
Regarding the past quarter's extremely low NG price and
the improving price outlook, this is what PEY had to say:
"Natural
gas prices in Alberta plunged in the quarter to some of the lowest prices
in the past 30 years as restricted access to storage prevented supplies
from finding a market. Despite the Company's market diversification
efforts this still resulted in some of the lowest realized natural gas
prices in Peyto's 20 year history. Late in the quarter, however, and with
the help of the Alberta government, an industry agreement to revise NGTL
[Nova Gas Transmission Ltd.] service priorities during future summer
periods was successfully negotiated. This had an immediate impact on AECO
natural gas prices and should help prevent the recurrence of such a
disconnected Alberta gas market over the next few years while NGTL
continues to build out its capacity to handle basin growth."
Here's a chart showing the low average Canadian NG price during the third
quarter and the rapid rebound over the past 1-2 months from near zero to
about C$3/GJ.
Despite the NG price weakness, during the September quarter PEY
achieved a 64% Operating Margin, a 6% Profit Margin, and generated C$68
million (C$0.41/share) in Funds from Operations (FFO).
PEY's
management anticipated the NG price weakness of 2019 and now anticipates a
sustained recovery. According to the company's press release, the Canadian
natural gas market has changed throughout 2019 from one of over-supply and
lack of take-away capacity to one of under-supply and increasing take-away
capacity. Based on industry projections for reduced drilling activity,
this trend is expected to continue in 2020.
In its history, PEY has
never incurred a write down nor recorded an impairment of its assets.
Therefore, it's reasonable to assume that its assets are valued
realistically and that the stated book value shown on the balance sheet
included with its September-quarter results is an accurate reflection of
what the company is worth at this time. The stated book value is about
C$10.40/share, which is more than three times the current stock price.
PEY is a strong intermediate-term buy in the low-C$3 area for anyone
looking for capital appreciation potential and/or dividend yield in a
natural resource stock.
![]() List
of candidates for new buying
List
of candidates for new buying
From within the ranks of TSI
stock selections the best candidates for new buying at this time, listed
in alphabetical order, are:
1) CRON (last Friday's closing price:
US$8.52)
2) PEY.TO (last Friday's closing price: C$3.08)
3)
SBB.TO (last Friday's closing price: C$1.56)
4) TGB (last Friday's
closing price: US$0.45)
The above list is limited to five stocks.
It sometimes will contain less than five, but it never will contain more
than five regardless of how many stocks are attractively priced for new
buying.
![]() Canadian
natural gas speculation
Canadian
natural gas speculation
As mentioned above in the
discussion of Peyto's latest quarterly results, there are tentative signs
that a sustainable recovery is underway in the Canadian natural gas (NG)
market. Owning PEY shares is a good way to profit from this recovery,
because the stock has large upside potential but the company will remain
viable if the recent NG price rebound proves to be a false start.
Another way to profit would be to own the shares of Petrus Resources
(PRQ.TO), a former member of the TSI Stocks List. In terms of current
production, PRQ is about one-tenth the size of PEY. Also, PRQ has a higher
production-cost structure and a weaker balance sheet than PEY. These
attributes make it a lot riskier, but they also mean that the stock price
could achieve a much greater percentage gain IF the recent NG price
rebound proves to be the start of an upward trend.
Further to the
above, we have added a PRQ trading position to the TSI List at Friday's
closing price of C$0.17. This is a trade with an expected duration of 6-12
months.
Note that due to the effects of tax-loss selling and
weakness in the oil price the stock could remain under pressure until
early next year, but we like the current risk/reward.
Chart Sources
Charts appearing in today's commentary
are courtesy of:
https://stockcharts.com/
http://www.goldchartsrus.com/