|
-- Weekly Market Update for the Week Commencing
12th January 2015
Big Picture
View
Here is a summary of our big picture
view of the markets. Note that our short-term views may differ from our
big picture view.
In nominal dollar terms, the BULL market in US Treasury Bonds
that began in the early 1980s ended in 2012. In real (gold)
terms, bonds commenced a secular BEAR market in 2001 that will continue
until 2018-2020. (Last
update: 20 January 2014)
The stock market, as represented by the S&P500 Index,
commenced
a secular BEAR market during the first quarter of 2000, where "secular
bear market" is defined as a long-term downward trend in valuations
(P/E ratios, etc.) and gold-denominated prices. This secular trend will bottom sometime between 2014 and 2020.
(Last update: 22 October 2007)
A secular BEAR market in the Dollar
began during the final quarter of 2000 and ended in July of 2008. This
secular bear market will be followed by a multi-year period of range
trading.
(Last
update: 09 February 2009)
Gold commenced a
secular bull market relative to all fiat currencies, the CRB Index,
bonds and most stock market indices during 1999-2001.
This secular trend will peak sometime between 2014 and 2020.
(Last update: 22 October 2007)
Commodities,
as represented by the Continuous Commodity Index (CCI), commenced a
secular BULL market in 2001 in nominal dollar terms. The first major
upward leg in this bull market ended during the first half of 2008, but
a long-term peak won't occur until 2014-2020. In real (gold) terms,
commodities commenced a secular BEAR market in 2001 that will continue
until 2014-2020.
(Last
update: 09 February 2009)
Copyright
Reminder
The commentaries that appear at TSI
may not be distributed, in full or in part, without our written permission.
In particular, please note that the posting of extracts from TSI commentaries
at other web sites or providing links to TSI commentaries at other web
sites (for example, at discussion boards) without our written permission
is prohibited.
We reserve the right to immediately
terminate the subscription of any TSI subscriber who distributes the TSI
commentaries without our written permission.
Outlook Summary
Market
|
Short-Term
(1-3 month)
|
Intermediate-Term
(6-18 month)
|
Long-Term
(2-5 Year)
|
|
Gold
|
N/A |
Bullish
(26-Mar-12) |
Bullish
|
|
US$ (Dollar Index)
|
N/A |
Neutral
(29-Sep-14) |
Neutral
(19-Sep-07) |
|
US Treasury Bonds (TLT)
|
N/A |
Neutral
(18-Jan-12)
|
Bearish |
|
Stock Market
(DJW)
|
N/A |
Bearish
(28-Nov-11) |
Bearish
|
|
Gold Stocks
(HUI)
|
N/A |
Bullish
(23-Jun-10) |
Bullish
|
|
Oil |
N/A |
Bullish
(17-Dec-14) |
Bullish
|
|
Industrial Metals
(GYX)
|
N/A |
Neutral
(15-Sep-14) |
Bullish
(28-Apr-14) |
Notes:
1. Our short-term expectations are discussed in the commentaries, but except in
special circumstances we won't attempt to assign a "bullish", "bearish" or
"neutral" label to these expectations.
2. The date shown below the current outlook is when the most recent outlook change occurred.
3. "Neutral" means that we think risk and reward are roughly in balance with respect to the timeframe in question.
4. Long-term views are determined almost completely by fundamentals and intermediate-term views
are determined by a combination of fundamentals, sentiment and technicals.
IF
The 22nd-25th January period contains two big market-moving
events: an ECB meeting on 22nd January and elections in Greece on
25th January. These events are market-moving due to the uncertainty
and anticipation surrounding them. In particular, there is much
anticipation that the ECB will decide on 'bold' new measures to
combat an imaginary deflation problem at its 22nd January meeting
and that the "anti-austerity" Syriza Party will come to power in
Greece on 25th January. The fear is that a Syriza victory will lead
to Greece exiting the euro-zone. It won't, but that's the current
fear and the basis for much speculation.
The recent market trends are: up for the Dollar Index, the T-Bond,
gold and gold-mining stocks, and down for the euro, the broad stock
market and industrial commodities. If these trends continue then
there is a good chance that the 22nd-25th January period will
usher-in short-term price extremes, regardless of what actually
happens at the ECB meeting and in Greece.
This is just something to keep in mind if, and only if, the current
trends extend into 22nd-25th January.
Not the most misunderstood word in
macroeconomics, but close to it
"Reserves" is not the most misunderstood word in
macroeconomics. That dubious honour could go to "inflation", which, contrary to
popular opinion, is not an increase in the general price level; it is an
increase in the supply of money that has, as its main effect, the distortion of
relative prices that leads to the boom/bust cycle. The honour could also go to
"capitalism", which has almost nothing to do with making money and almost
everything to do with economic freedom, private property ownership, voluntary
exchange and minimal government. However, "reserves" would probably be in the
top ten most misunderstood words in macroeconomics.
In macroeconomics the word "reserves" is generally used in one of two ways. It
is either used to describe the currency units held by commercial banks (in bank
vaults or at the central bank) as 'coverage' for their customers' deposits
("bank reserves") or to describe the foreign currency held by a nation's
government or central bank to 'back' the official money of the nation ("foreign
currency reserves"). Either way, the word doesn't mean what the vast majority
thinks it means.
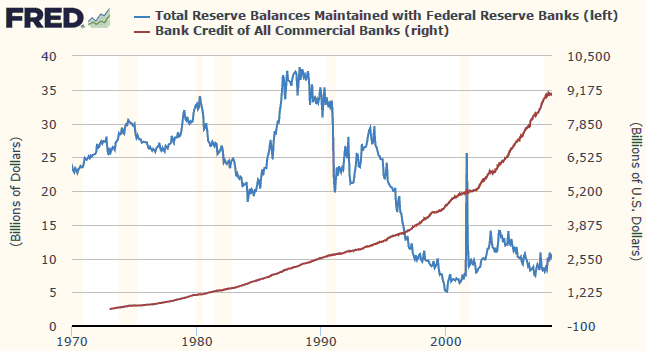
First, let's deal with bank reserves.
Bank reserves are widely considered to be the base upon which commercial banks
expand their loan books and deposits, but this is not the case. At least, it is
not the case in the US. As evidenced by the following chart, from 1970 through
to mid-2008 there was no positive correlation between US Commercial Bank Credit
and Total Bank Reserve Balances (we ended the chart in mid-2008 because bank
reserves subsequently went haywire due to the Fed's QE). In particular, note
that during the 20-year period ending in June-2008 there was a dramatic
expansion of bank credit (from $2.3T to $9T) in parallel with a shriveling of
bank reserves to almost nothing.
The reality is that for the past few decades, US commercial bank lending has
been independent of bank reserves. To put it another way, bank credit expansion
does not 'piggyback' on reserves.
Also worth mentioning is that bank reserves cannot be loaned into the economy
and do not constitute purchasing power for the banks that hold them. In more
general terms, bank reserves cannot be used as money by the banks that hold
them. That's why bank reserves aren't counted in True Money Supply (TMS), M1,
M2, MZM or M3. In particular and despite assertions by some analysts to the
contrary, US commercial banks cannot use the reserves held on deposit at the Fed
to purchase bonds.
Another relevant point is that the whole bank reserve concept is a holdover from
the Gold Standard, when gold (the true money of the time) was held in reserve
and receipts for gold circulated within the economy. Under today's monetary
system the concept lies somewhere between misleading and bogus, because what we
have is created-out-of-nothing dollars 'backing' created-out-of-nothing dollars,
which is ridiculous.
Let's now move on to foreign currency reserves.
The main point to understand with regard to foreign currency reserves is that
under the current system they are solely related to the exchange-rate
manipulation engaged in by governments guided by mercantilist economic theory.
The primary goal of mercantilist policy is to maximise goods flowing out of the
country relative to goods flowing into the country, that is, to maximise the
international trade surplus. The attempts to achieve this jaundiced goal often
involve downward manipulation of the domestic currency's exchange rate, which
involves buying the most popular international trading currency (the US$) using
newly-created units of the domestic currency, leading to the accumulation of
foreign currency (mostly US$) reserves and the expansion of the domestic money
supply.
Rather than being a sign of strength, as it is typically portrayed, a large
build-up of foreign currency reserves is a warning sign of a future "inflation"
problem. Once the "inflation" problem arrives, there is no longer a need to
implement policies designed to weaken the domestic currency on the foreign
exchange market because the market takes matters into its own hands and causes
the currency to become weaker than desired. This forces a policy reversal by the
mercantilists and manipulative steps are then taken in an effort to prevent
further devaluation. These steps often include the selling of foreign currency
reserves. This will prompt some analysts to make comments such as "it's just as
well that the government had a large pile of foreign currency reserves to draw
upon to support their currency in this time of need". These analysts are
ignorant of the fact that the preceding accumulation of foreign currency
reserves helped bring about the economic problems that led to the excessive
currency weakness that the government or central bank is now attempting to
address by the selling of foreign currency reserves.
Like bank reserves, foreign currency reserves are holdovers from an earlier
monetary system. Under the current system they are pointless at best and a
consequence of destructive policy-making at worst.
The Stock
Market
The US
The US stock market has had a downward bias since late-December. The short-term
price action isn't suggestive of anything more than a routine pullback, but, as
mentioned in last week's Interim Update, on a longer-term basis there are
clear-cut bearish signals.
Chief among these long-term bearish signals is the downward reversal in the
SPX/USB ratio (the S&P500 Index divided by the T-Bond). This indicator signaled
that a major top was close at hand when it broke below its 50-week moving
average in October and provided additional evidence of a major top last week by
breaking below its October-2014 low.
The SPX/USB ratio continues to perform similarly to how it performed around the
major tops of 2000 and 2007.
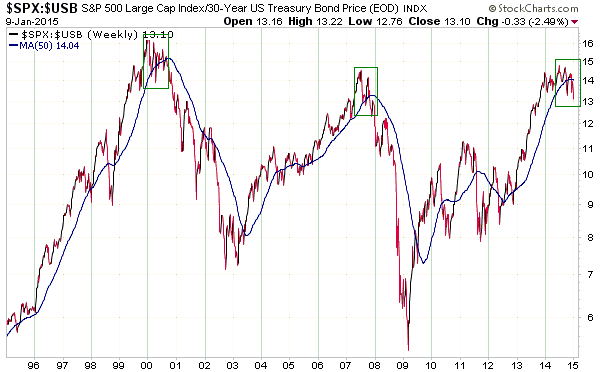
The short-term price action, which is suggestive of a routine correction that
would be expected to end within the next couple of weeks, can be reconciled with
the longer-term bearish indicators if we assume that the market is going to make
a marginal new high later this quarter before rolling over into a 1-2 year
decline. Furthermore, a marginal new high prior to the start of a bear market
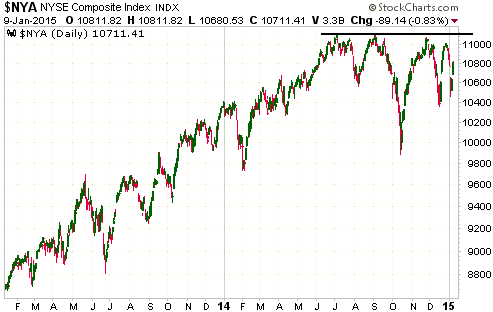
would make the 2014-2015 top in the NYSE Composite Index (NYA) look similar to
the 2000 and 2007 tops in the same index.
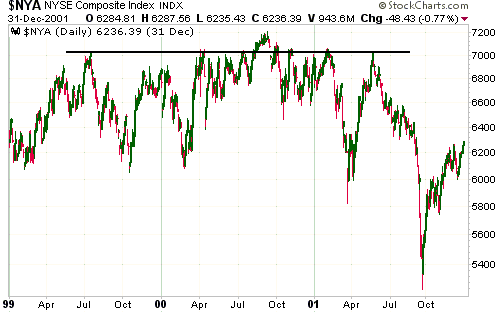
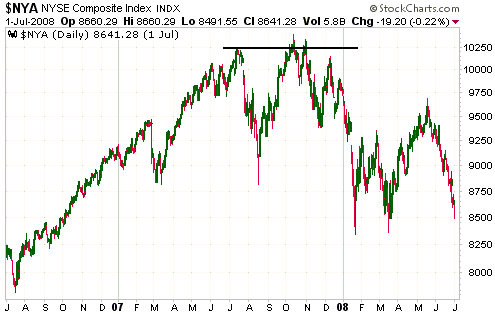
To show what we mean, here are three charts. The first chart shows that there
was a short-lived break to a new all-time high in the NYA in September-2000,
just prior to the start of a major decline. The second chart shows that there
was a short-lived break to a new all-time high in the NYA in October-2007, just
prior to the start of a major decline. The third chart shows the current
situation.
Europe
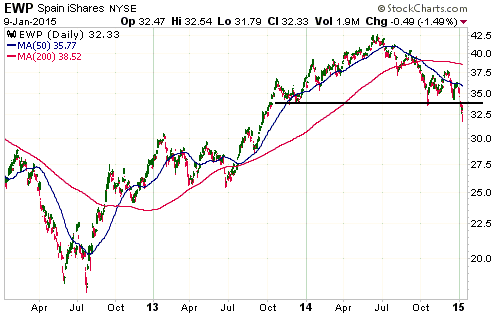
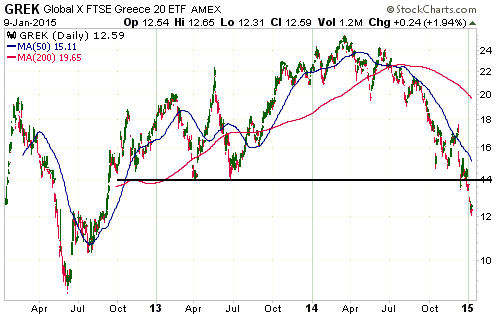
Some of the weakest European stock markets are well and truly in bear-market
territory. For example, the following daily charts show that Spain iShares (EWP)
and Global X Greece 20 ETF (GREK) made new 12 month lows last week and are down
by 24% and 50%, respectively, from last year's high.
Despite attractive valuations, we aren't inclined to take long positions in
either the Greek or Spanish stock markets. This is partly because sentiment and
news-flow could result in continuing downward trends for both markets and partly
because our understanding of the markets is inadequate. However, the declines of
the past year certainly reduce the downside risk, both in nominal currency terms
and relative to the precariously elevated US stock market.
This week's
significant US economic events
(The most important events are shown
in bold)
| Date |
Description |
| Monday Jan 12 |
No important events scheduled | | Tuesday
Jan 13 |
Treasury Budget | | Wednesday
Jan 14 |
Retail Sales
Import and Export Prices
Business Inventories
Fed's Beige Book | | Thursday
Jan 15 |
PPI
Empire State Mfg Survey
Philadelphia Fed Survey
|
| Friday Jan 16 |
CPI
Industrial Production
Consumer Sentiment
TIC Report |
Gold and
the Dollar
Gold
The Fundamentals
We intend to do a more complete review of gold's fundamental drivers next week.
Suffice to say at this time that they remain 'mixed', although one of the
drivers that has generally been bullish since July of 2013 became a little more
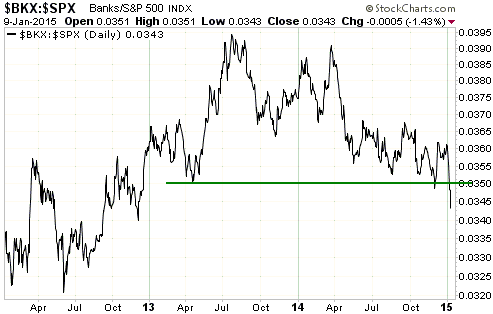
so last week. We are referring to the relative performance of the US banking
sector as indicated on the following chart by the BKX/SPX ratio.
Relative strength in bank stocks, as indicated by a rising trend in the BKX/SPX
ratio, is bearish for gold, while relative weakness in bank stocks, as indicated
by a falling trend in the BKX/SPX ratio, is bullish for gold. The BKX/SPX ratio
began to trend downward in July-2013 and last week moved below its 2013 and 2014
lows to its lowest level in more than two years.
The Price Action
In US$ terms, gold has important resistance beginning at $1240 and extending up
to the mid-$1250s. A weekly close above this resistance would be confirmation
that an intermediate-term rally is in progress.
However, before tackling resistance at $1240-$1256 gold must first break out
from the price channel in which it has oscillated over the past year. As
illustrated below, it ended last week at the top of this channel.
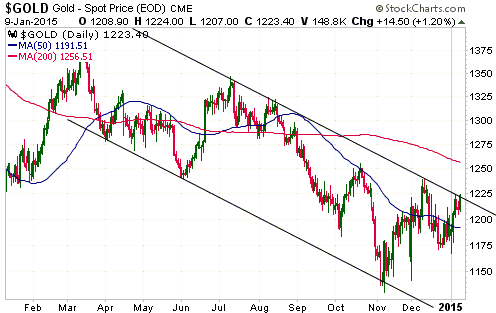
Gold is not short-term 'overbought' by any of the measures that we track and
could be given a boost by additional euro/ECB-related uncertainty over the
coming two weeks. This creates the opportunity for gold to generate a
longer-term bullish signal later this month.
Gold Stocks
Gold stocks during a general equity bear market
Although we covered this topic as recently as 26th November, the main point is
worth reiterating. The main point is that, according to the historical record,
the gold-mining sector performs very well during the first 18-24 months of a
general equity bear market as long as the average gold-mining stock is not
'overbought' and over-valued at the beginning of the bear market.
Unfortunately, the historical sample size is small, with only two relevant cases
since the birth of the current monetary system. The two cases involve the
general equity bear markets of 1973-1974 and 2000-2003, and are illustrated by
the following charts.
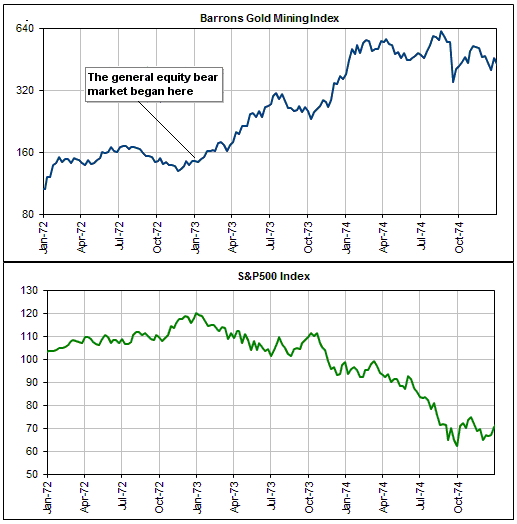
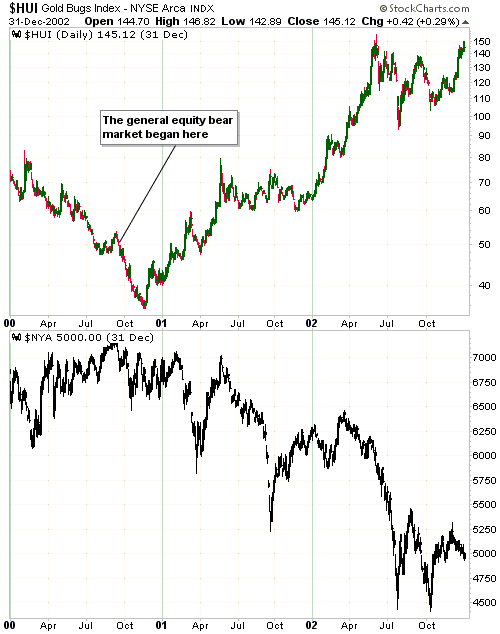
The message of our small historical sample size is that IF a general equity bear
market has begun or begins in the near future, then the HUI is likely to be at
least triple its current level by the third quarter of 2016. We are confident
that this message is accurate, but we aren't confident that a general equity
bear market has just begun or is about to begin.
Note that the gold-mining sector could enjoy a 6-12 month rally during a
continuing bull market in general equities as part of a rotation into
commodity-oriented stocks. This would be similar to what happened during
1986-1987. However, on a long-term basis the gold-mining sector, like gold
bullion, is a counter-cyclical investment. A cyclical (2-5 year) bearish trend
in the broad stock market is a virtual prerequisite for a cyclical bullish trend
in gold-mining stocks.
Current Market Situation
Below is a daily chart of the XAU.
From 2nd through 8th January the XAU rallied for three days and then pulled back
for two days, with the 2-day pullback retracing less than the gain achieved
during the final day of the preceding 3-day up-move. The rally then resumed on
Friday 9th January and the XAU managed to end the week slightly above resistance
at 75. This is bullish price action. It suggests that additional gains are
likely in the near future.
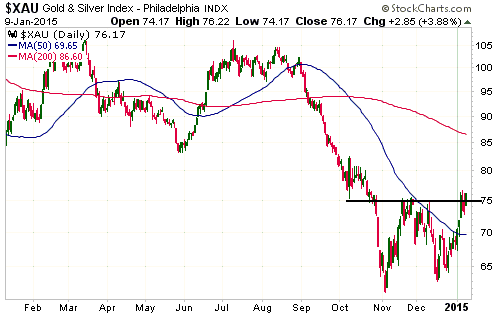
There is more resistance for the XAU just above its current price. However, it
looks like the news-flow will be supportive for gold-related investments over
the coming 2 weeks, and none of the gold-mining indices or ETFs is close to
being 'overbought'. It's therefore a good bet that the immediate price-related
obstacles will be overcome.
We continue to anticipate rises to near 200-day moving averages for the
gold-mining indices and ETFs. This means that we have a short-term upside target
of around 85 in mind for the XAU.
The Currency Market
The Dollar Index pulled back last Friday, but prior to that it had closed higher
for six days in a row. It is very stretched to the upside in terms of both price
and bullish sentiment.
The extent to which sentiment is stretched is clearly indicated by the rise in
Market Vane's Dollar Index bullish percentage to the high-80s, although it is
perhaps even more clearly indicated by the
Daily Sentiment Index
(DSI). We don't subscribe to the DSI service, but according to an
acquaintance the DSI for the Dollar Index hit a high of 98% last week. At the
same time the DSI for the euro hit 3%. Market sentiment doesn't get any more
extreme than this.
The extent to which the price is stretched is indicated by the following
long-term chart. The top section of the chart shows the Dollar Index and a
200-day/8% moving average envelope (the blue lines). The bottom section of the
chart shows the Dollar Index's 250-day rate of change (ROC).
Notice that except for briefly during the 2008 financial crisis, at no time
since 1990 has the Dollar Index been higher relative to the aforementioned MA
envelope than it is right now. Notice, as well, that the Dollar Index's 250-day
ROC is unusually high, although it is still slightly below the extremes of 1993,
1997 and 2000 and well below the extreme of 2008.
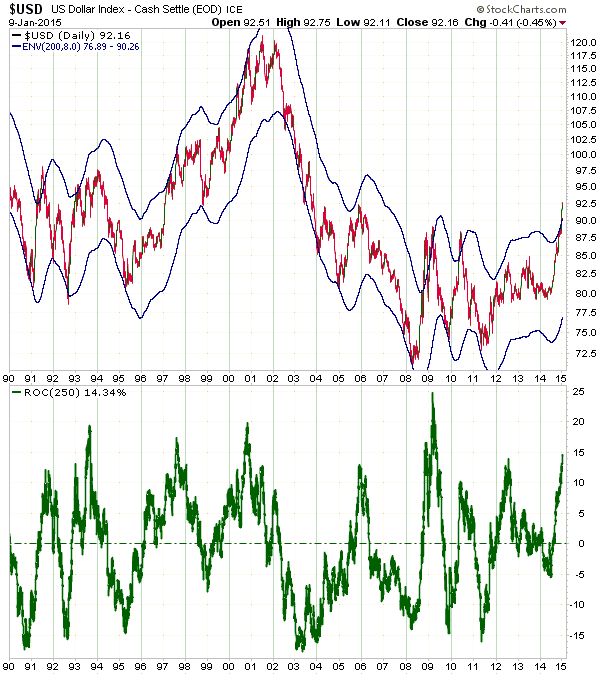
Over the past three months we've been anticipating a short-term US$ correction
that never came. Considering the historic sentiment extreme and the extent to
which the Dollar Index is 'overbought', it's now likely that the next peak will
be the intermediate-term variety rather than just the short-term variety.
However, due to the potential for high volatility in the lead-up to the 22nd
January ECB meeting our intermediate-term US$ outlook remains "neutral" for the
time being.
Updates
on Stock Selections
Notes: 1) To review the complete list of current TSI stock selections, logon at
http://www.speculative-investor.com/new/market_logon.asp
and then click on "Stock Selections" in the menu. When at the Stock
Selections page, click on a stock's symbol to bring-up an archive of
our comments on the stock in question. 2) The Small Stock Watch List is
located at http://www.speculative-investor.com/new/smallstockwatch.html
 Company
news/developments for the week ended Friday 9th January 2015: Company
news/developments for the week ended Friday 9th January 2015:
[Note: AISC = All-In Sustaining Cost, FS = Feasibility Study, IRR = Internal
Rate of Return, MD&A = Management Discussion and Analysis, M&I = Measured and
Indicated, NAV = Net Asset Value, NPV(X%) = Net Present Value using a discount
rate of X%, P&P = Proven and Probable, PEA = Preliminary Economic Assessment,
PFS = Pre-Feasibility Study]
*Clifton Star (CFO.V) responded to the request of dissident
shareholders for a special meeting to vote on removing the existing board and
replacing it with a slate of five new members. We were under the impression that
the company's by-laws required the meeting to be held by 10th March, but
apparently that isn't the case. The scheduled date is 15th June 2015.
As we have previously stated, replacing the existing board with the new members
proposed by dissident shareholders led by Harry Miller would pave the way for
the Duparquet option to be renegotiated. As such, it is vital that the proposed
board changes take place. Unfortunately, postponing the special meeting until
June does nothing other than reduce the probability of a favourable
renegotiation.
CFO could again become a good speculation when new management takes over and a
favourable renegotiation is completed, but not before.
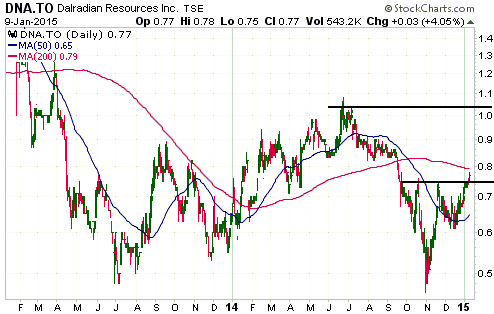
*Dalradian Resources (DNA.TO) advised that underground drilling in
support of the PFS for its high-grade Curraghinalt gold project (Northern
Ireland) is scheduled to begin in March. The results from this drilling should
create decent news-flow for the stock.
The following chart shows that DNA's stock price achieved a marginal upside
breakout last Friday. Assuming this breakout sticks, C$1.05 is the short-term
target implied by the chart (see below).
*Energy Fuels (EFR.TO, UUUU), a junior US-based uranium producer,
is buying Uranerz Energy (URZ), another junior US-based uranium producer, in an
all-stock deal initially priced at a 37% premium to URZ's pre-bid market price.
This deal is very 'dilutionary' for EFR shareholders, because despite URZ being
the much smaller company (in asset terms) it will result in URZ shareholders
owning 55% of the combined company. In our opinion, this is empire-building by
EFR's management at shareholder expense.
URZ currently has small-scale uranium production (a few hundred thousand pounds
per year) from an ISR (In Situ Recovery) operation in Wyoming. Furthermore, with
an operating cost (including royalties and taxes) of around $35/pound, its
production would not be profitable at today's spot uranium price.
From our perspective, the only positive aspect of this deal is that it will make
EFR the go-to uranium stock for speculators/investors wanting exposure to
US-based uranium production. This will probably result in a big run-up in the
stock price during the next intermediate-term uranium rally, but in the
here-and-now the deal does nothing other than reduce EFR's per-share value by at
least 30%.
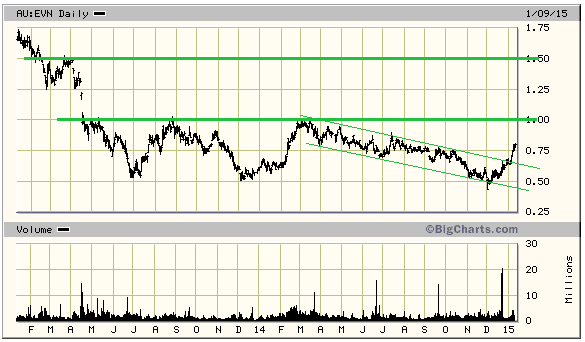
*Evolution Mining (EVN.AX) broke out to the upside last week.
A$1.00 is the short-term target implied by the chart (see below). A$1.50 would
be the target implied by a daily close above A$1.00.
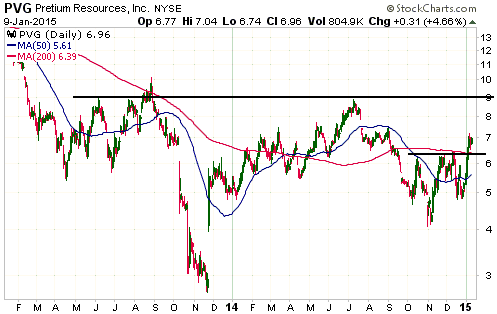
*Pretium Resources (PVG), like a number of other gold stocks,
broke out to the upside last week. PVG's chart (see below) implies a short-term
upside target of US$9.00.
*Ramelius Resources (ASX: RMS) announced that gold production for
the December quarter was well ahead of plan. Specifically, the company produced
24.2K ounces of gold during the quarter, which compares very favourably with
guidance of 19.5K-21.5K. This is an excellent result that has the important
effect of making the company cash-flow positive for the second quarter running.
Six months ago RMS was at risk of fully depleting its cash reserves by the end
of 2014, but its financial position now looks much healthier. The strengthening
of the balance sheet had two main drivers, the first being the improved
production performance mentioned above. The other driver was the weakness in the
Australian Dollar and the resultant strength in the A$-denominated gold price
(gold/A$).
As a (mostly) unhedged gold miner operating in Australia, RMS's profitability is
determined by its production performance (quantity and cost of production) and
by the A$-denominated gold price. Thanks to the weakness in the A$, the
A$-denominated gold price is now close to a 15-month high.
Due to its improved operating performance and the strength in the A$-denominated
gold price, RMS has again become a reasonable candidate for new buying. The
shares rebounded last week in the wake of the production news, but at
A$0.07-$0.08 they are still extremely cheap.
*UEX Corp. (UEX.TO) and Areva (the operator) have set the 2015
exploration budget for the Western Athabasca joint venture uranium projects at
$4.8-million, of which UEX will be financing $2.1-million. The high-grade Shea
Creek project (49% UEX) is budgeted to receive $2.8M, with UEX's share being
$1.4M. Its 49% holding in Shea Creek is currently UEX's most important asset.
Also, UEX has budgeted $2.5M for exploration of its 100%-owned Hidden Bay
low-grade uranium project in Eastern Athabasca.
We estimate that UEX has about $8M of cash, so it should be able to fund its
2015 exploration expenses from cash on hand.
From within the ranks of TSI stock selections the best candidates
for new buying at this time, listed in alphabetical order, are:
1) AKG (last Friday's closing price: US$1.62).
2) EDV.TO (last Friday's closing price: C$0.52).
3) RSG.AX (last Friday's closing price: A$0.32).
4) TGD (last Friday's closing price: US$1.10).
Note that the above list is limited to five stocks. It will
sometimes contain less than five, but it will never contain more
than five regardless of how many stocks are attractively priced for
new buying.
Chart Sources
Charts appearing in today's commentary
are courtesy of:
http://stockcharts.com/index.html
http://bigcharts.marketwatch.com/
http://research.stlouisfed.org/

|
