|
-- Weekly Market Update for the Week Commencing 12th February 2007
Big Picture
View
Here is a summary of our big picture
view of the markets. Note that our short-term views may differ from our
big picture view.
Bonds commenced a secular BEAR market in
June of 2003. (Last
update: 22 August 2005)
The stock market, as represented by the S&P500 Index, commenced a secular BEAR market during the first quarter of 2000. The rally
that
began in October of 2002 will end during the first half of 2007. The ultimate bottom of
the secular bear market won't occur until the next decade. (Last update: 02 October 2006)
The Dollar commenced a secular BEAR market during the final quarter of 2000. The
first major downward leg in this bear market ended during the first
quarter of 2005, but a long-term bottom won't occur until 2008-2010. (Last update: 28 March 2005)
Gold commenced a
secular bull market relative to all fiat currencies, the CRB Index,
bonds and most stock market indices during 1999-2001. The first major
upward leg in this secular bull market ended in December of 2003, but a
long-term peak won't occur until at least 2008-2010. (Last update: 13
February 2006)
Commodities, as
represented
by the CRB Index, commenced a secular BULL market in 2001. The first
major upward leg in this bull market ended during the second quarter of
2006, but a long-term
peak won't occur until at least 2008-2010. (Last update: 08 January 2007)
Copyright
Reminder
The commentaries that appear at TSI
may not be distributed, in full or in part, without our written permission.
In particular, please note that the posting of extracts from TSI commentaries
at other web sites or providing links to TSI commentaries at other web
sites (for example, at discussion boards) without our written permission
is prohibited.
We reserve the right to immediately
terminate the subscription of any TSI subscriber who distributes the TSI
commentaries without our written permission.
Outlook Summary
Market
|
Short-Term
(0-3 month)
|
Intermediate-Term
(3-12 month)
|
Long-Term
(1-5 Year)
|
Gold
|
Bullish
(04-Oct-06)
|
Bullish
(29-Jan-07)
|
Bullish
|
US$ (Dollar Index)
|
Neutral
(08-Jan-07)
| Bullish
(31-May-04)
|
Bearish
|
Bonds (US T-Bond)
|
Neutral
(29-Jan-07)
|
Neutral
(23-Aug-06)
|
Bearish
|
Stock Market (S&P500)
|
Neutral
(13-Dec-06)
|
Bearish
(02-Jan-07)
|
Bearish
|
Gold Stocks (HUI)
|
Bullish
(04-Oct-06)
|
Bullish
(29-Jan-07)
|
Bullish
|
| Oil | Bullish
(04-Oct-06)
| Neutral
(25-Sep-06)
| Bullish
|
Industrial Metals (GYX)
| Neutral
(15-Jan-07)
| Bearish
(25-Sep-06)
| Bullish
|
Notes:
1. In those cases where we have been able to identify the commentary in
which the most recent outlook change occurred we've put the date of the
commentary below the current outlook.
2. "Neutral", in the above table, means that we either don't have a
firm opinion on which way the market will move or that we expect the
market to be trendless during the timeframe in question.
3. Long-term views are determined almost completely by fundamentals,
intermediate-term views by giving an approximately equal weighting to
fundmental and technical factors, and short-term views almost
completely by technicals.
Commodities
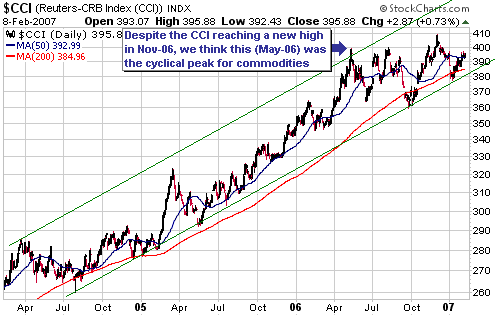
A problem with indices
The
diverging of the CRB and the CCI is an extreme example of a general
problem with indices... ...if there's a meaningful contraction in
liquidity over the coming two quarters then the commodity downturn will
likely become more broad-based than it has been to date.
In a recent article
Adam Hamilton correctly points out that the gnashing of teeth provoked
by last year's breakdown in the CRB Index makes little sense given that
the CRB would not have broken down at all if not for the revisions that
were made to this commodity index in 2005. That this is the case is
evidenced by the performance of the Continuous Commodity Index (CCI), a
chart of which is included below. The CCI is the CRB sans the 2005
revisions and has clearly not yet broken down.
The diverging of the CRB and the CCI is an extreme example of a general
problem with indices, particularly weighted indices made up of a fairly
small number of components. The problem is that under certain
situations -- especially around important turning points in the market
-- the performance of an index may not paint an accurate picture of the
market it supposedly represents. For example, the Dow Industrials Index
-- a widely-watched measure of the US stock market's performance that
consists of only 30 stocks -- will often provide false signals near
intermediate-term turning points; specifically, it tends to maintain
its upward trend for some time after the overall market has begun to
trend lower and maintain its downward trend for some time after the
overall market has begun to trend higher.
Even though it came about due to major changes in the way the index was
constructed and calculated, the recent CRB-CCI discrepancy is really
just an example of a limitation of indices in general. Most indices are
somewhat arbitrary, and what we have in the CRB-CCI situation is an
example of an arbitrary change to what was already an arbitrary index
causing a big change in performance.
Commodity bulls can choose to hang their hats on the CCI's relative
strength and commodity bears can point to the CRB's breakdown, but in
our opinion it would be dangerous to base an intermediate-term outlook
on the performance of either index. Neither of these indices can be
relied upon to provide the 'correct' representation of the overall
commodity trend, but there could well be some information in the fact
that such a discrepancy exists at all. To be specific: at important
turning points some market components -- individual stocks,
commodities, sub-sectors, etc. -- will invariably reverse direction
ahead of others, thus causing market proxies with differing
compositions to diverge.
The difference between the performances of the CRB and the CCI is
indicative of a loss of consistency across the commodity universe
stemming from some commodities reversing downward while others stayed
on upward paths. It could therefore be interpreted as evidence that the
commodity market trend is transitioning from up to down. This is, in
fact, our interpretation (we think commodities are going through a
mid-cycle downturn within a secular bull market).
Only a small number of commodities have broken down in a decisive
manner over the past 6 months, but it's potentially significant that
two of the ones that have broken down (oil and copper) are two of the
most important. That many others are yet to break down is symptomatic
of the on-going liquidity deluge, but if there's a meaningful
contraction in liquidity over the coming two quarters then the
commodity downturn will likely become more broad-based than it has been
to date. The grain and gold markets might buck such a change in the
monetary trend -- the grains for the reasons outlined in the 15th
January Weekly Market Update and gold due to its counter-cyclical
nature -- but most commodities would probably go the way of oil and
copper.
Alternatively, if the liquidity deluge continues for several more
months then the breakdowns in oil and copper will likely prove to be
isolated incidents within an uninterrupted bullish trend. This is not
the way to bet, though, because the re-ignition of the commodity bull
at this time would force the major central banks to take quick
counter-measures with the aim of keeping inflation expectations in
check.
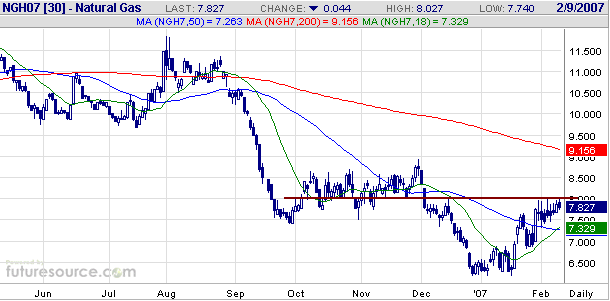
Natural Gas Update
The weather in the US has taken a rather dramatic turn over the past
two weeks from being unseasonably warm to being unusually cold. In
fact, after experiencing one of the mildest December-January periods on
record the US now appears to be on track to experience one of the
coldest Februarys ever. This sudden change in the weather has, in turn,
gone some way toward mitigating the near-term supply glut in the
natural gas market. The amount of gas in storage is still well above
the 5-year average, but it is now slightly below where it was at this
time last year.
We had been allowing for the nearest NG futures contract to make a
final low during February, but the change in the weather might mean
that the next pullback results in a higher low.
The probability that the ultimate price low is already in place will
obviously increase if the cold spell continues. Also, a daily close
above the $8.00 resistance level by the March natural gas (NG) futures
contract would be evidence that the market had bottomed a bit earlier
than we had originally expected.
The Canadian 'gassy'
energy trusts (AVN.UN, DAY.UN, FEL.UN, SHN.UN, TET.UN, THY.UN and
VNG.UN) are suitable for new buying near current levels. With the
exceptions of FEL.UN and THY.UN, these trusts have all made substantial
cuts to their monthly distribution amounts over the past several
months. As a result, distributions are still high enough to provide
attractive yields -- the average yield across the aforementioned trusts
is about 16% -- but are now at levels that should prove to be
sustainable assuming the NG price does not drop well into new-low
territory. A distribution cut from C$0.12/month to around C$0.09/month
might lie ahead for THY.UN, but the stock market appears to have
already discounted such an outcome so if/when it happens it shouldn't
have a big effect on the trust's unit price.
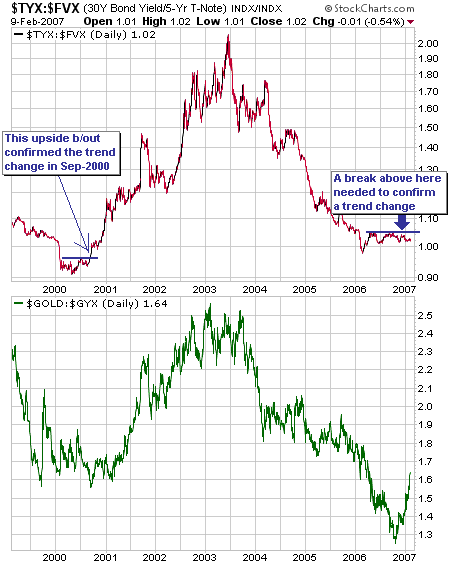
Gold versus the Industrial Metals
Over the past four months there has been a sharp upward move in the
gold/GYX ratio (the gold price divided by the Industrial Metals Index),
which we've been pleased to see because it's what we've expected would
happen and what we've been positioned for. However, it's still too
early to tell if we have a major trend change on our hands. The reason
is that the surge in the gold/GYX ratio has not yet been confirmed by
an upward reversal in the yield-spread.
To explain what we mean by "not yet been confirmed" we've included,
below, a chart comparing the gold/GYX ratio with the TYX/FVX ratio (the
30-year yield divided by the 5-year yield -- a measure of the US
yield-spread). Clearly, gold/GYX has been trending in the same
direction as the yield-spread for many years.
Gold/GYX has just experienced its best rally in a long time, but until
TYX/FVX confirms a change in its trend by breaking decisively above
1.05 there will remain a risk that the post-October-2006 strength in
gold relative to the industrial metals is solely a response to the
overshoot that occurred between October-2005 and October-2006. During
the aforementioned 12-month period, rampant speculation in metals such
as copper and zinc caused gold to plunge relative to the GYX even while
it was rallying relative to paper money. And in the absence of a
confirmed change in the yield-spread's trend it will be possible that
gold's relative strength is a short-lived phenomenon driven by the
unwinding of these speculative bets.
Bonds
It
looks like T-Bond futures made a short-term bottom in late January, but
the potential for a spike to new multi-month lows will remain until the
March contract closes above the resistance indicated on the following
daily chart. A daily close above the aforementioned resistance would
immediately take our short-term bond market outlook to "bullish" in
anticipation of a 1-3 month rally.
The Stock
Market
...one
of the many adverse ramifications of the US Government's ethanol
subsidies will be a quicker/sooner rise in the cost of labour than
would otherwise be the case.
The US stock market is showing initial signs of reversing lower. An
important support level to watch is 1750 for the NASDAQ100 in that a
decisive close below 1750 would indicate that an intermediate-term peak
was in place for this leading stock index.
As discussed in previous commentaries, US corporate profit margins are
extremely high at this time and the main reason they are high is that
labour's 'slice of the pie' has fallen in size over the past several
years. What has happened is that most other prices have risen at a
faster pace than the price of labour, boosting corporate profit margins
as a percentage of GDP since labour is the single largest cost for most
businesses.
Profit margins are mean reverting, the only real question being the
timing of the reversion. Specifically, the salient question is: will
profit margins contract THIS year due to a rise in labour prices
relative to other prices, or will the reversion be pushed further into
the future?
The fact that labour costs have recently begun to rise at an
accelerated pace suggests that the reversion is either already underway
or will begin over the next couple of quarters, thus putting downward
pressure on profit margins -- and potentially stock prices -- this
year. In addition, it is possible that one of the many adverse
ramifications of the US Government's ethanol subsidies will be a
quicker/sooner rise in the cost of labour than would otherwise be the
case. Here's why.
The rapid growth in the ethanol industry made possible by Government
subsidies has caused the prices of corn and soybeans to move sharply
higher, thus directly pushing up the prices of all the foods that
contain corn and soybeans. But since soybean meal and corn are
extensively used to feed cattle, pigs and poultry, the large increases
in the prices of these two commodities will lead to higher prices for
most of the popular meats. In other words, a very significant
across-the-board increase in food prices will most likely stem from the
ethanol subsidies. This, in turn, will undoubtedly grab the attention
of the US consumers who have not experienced much wage growth over the
past few years but didn't really care up until recently because the
unstoppable upward trend in house prices -- a trend that is presently
in hibernation -- was making them feel good about their financial
situations.
In summary: there's a good chance that the acceleration in the cost of
everyday food items due to the government-funded growth in the ethanol
industry will prompt US wage earners to more aggressively seek
increases in their wages. And the extent to which they are successful
will put downward pressure on corporate profit margins.
This week's
important US economic events
| Date |
Description |
Monday Feb 12
| No significant events scheduled
|
Tuesday Feb 13
| Trade Balance
| | Wednesday Feb 14
| Retail Sales
| | Thursday Feb 15
| Import and Export Prices
Net Foreign Purchases of US Securities
Industrial Production
Capacity Utilisation
| | Friday Feb 16
| PPI
Leading Economic Indicators
|
Gold and
the Dollar
Gold Stocks
...the
best risk/reward ratios can be found amongst the exploration-stage
miners, the small-scale producers and a select few mid-tier (or soon to
be mid-tier) producers.
Gold's break to new highs on Friday was accompanied by a small decline
in the gold share indices. This is bearish price action that might be
signaling some up-coming consolidation in both gold bullion and the
gold shares, but we won't attempt to read a lot into a single day's
performance. As noted in last week's Interim Update, gold shares are
generally oversold relative to the gold price and are therefore poised
to out-perform over the next couple of months. In addition, gold's
recent upward trend relative to some other important commodities should
lead to higher profit margins for gold producers and, eventually, to
some interesting upside in share prices.
Many gold market commentators are operating under the assumption that
the gold sector embarked on another major upward leg last October. This
assumption might prove to be on the mark, but up until now we haven't
seen anything that differentiates the current rally from a
counter-trend move within an on-going correction. There is, however,
nothing unusual about this because the early stage of a new trend will
often be indistinguishable from a counter-trend move (the financial
markets are generally very good at hiding their true intentions).
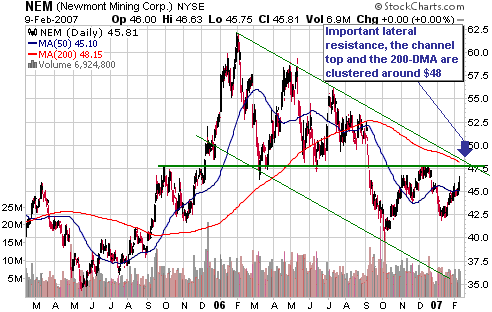
The following chart of Newmont Mining (NEM) does a good job of
illustrating the current lack of confirmation of an intermediate-term
trend change. A preliminary sign of such a change would be a decisive
break above resistance at $48.
We continue to expect
the major gold shares to reach significantly higher levels within the
next two months, but our primary focus remains on the juniors.
As has been the case for a long time (years, actually), the best
risk/reward ratios can be found amongst the exploration-stage miners,
the small-scale producers and a select few mid-tier (or soon to be
mid-tier) producers. With a few exceptions there hasn't been much
interest in such stocks over the past several months, but this will
change at some point if the gold stock indices continue to grind
upward. The thing is, if you want to make serious money by speculating
in the small gold shares -- especially the shares of the
exploration-stage companies -- you simply have to do the bulk of your
buying when the public's interest in this area of the market is low.
The reason is that once these types of shares begin to move they tend
to do so very quickly and with very little warning.
Gold
...broad-based strength on gold's part could be an early warning sign of a general decline in monetary confidence.
Gold's recent strength in the face of a modestly firm US$ could be
explained in a number of ways. For example, the trouble that is brewing
in sub-prime mortgage land (high-risk US home mortgages that were
packaged together, given a stellar credit rating and sold to large
investors throughout the world as low-risk debt securities, have begun
to default at an accelerated pace) could be creating some investment
demand for gold, as could the growing realisation that the massive
Iraq-related expenditures will continue indefinitely. Both the mortgage
debt problem and the Iraq-expenditures issue equate to future downward
pressure on the US$ because they will lead to more inflation, so it's
possible that the gold market has begun to discount this future
pressure. Another possibility is that technically-oriented speculators
have been buying gold futures, thus driving up the gold price, in
anticipation of the US$ peaking on a short-term basis near its current
level. Due to the gold market being much smaller than the currency
market it is certainly not uncommon for short-term trend changes to
become evident in the gold price before they become evident in the US
dollar's foreign exchange value.
In any case, there have been clues in the price action for months that
gold was probably going to test its May-2006 peak at some point during
the first half of 2007. We can only make guesses regarding the
underlying drivers of the recent action because the market price is the
net result of the buy/sell decisions of millions of individuals, each
of whom has his/her own reasons for wanting to buy or sell.
Furthermore, the price action has not exactly been dramatic in that
Friday's rise was only 1.3% and the US$ gold price remains well within
the range in which it has traded over much of the past year.
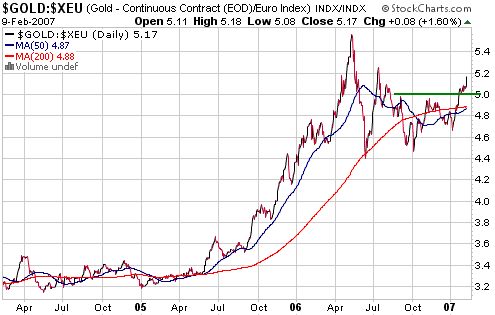
From our perspective, one of the two most interesting aspects of the
recent market action is that gold appears to be breaking upward from
consolidation patterns in terms of EVERY major currency. For example,
the following chart of the euro-denominated gold price shows that
'round number resistance' at 500 has been decisively breached. This
broad-based strength on gold's part could be an early warning sign of a
general decline in monetary confidence.
The other aspect of
the recent market action that has grabbed our attention is gold's
strength relative to the industrial metals. This was discussed earlier
in today's report and if confirmed by an upward reversal in the
yield-spread will indicate that gold's current rally is 'real', rather
than just a side effect of general metals-related speculation.
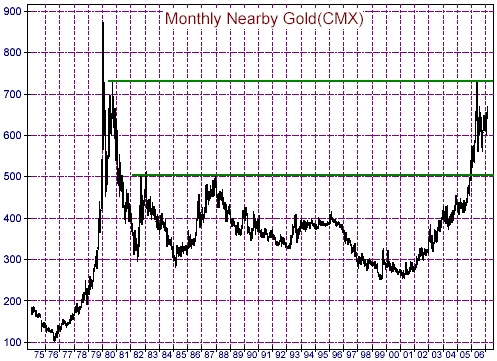
Instead of using a daily chart to highlight Friday's obvious (but
currently unconfirmed by the gold shares) break above short-term
resistance, we thought we'd take a longer-term view today and have
therefore included, below, a monthly gold futures chart. The chart
shows the long-term resistance at around $730 that capped last year's
upward move and the long-term support that exists at around $500. This
long-term support is the top of a multi-decade base and in our opinion
defines the maximum downside risk. It is, we think, equivalent to the
$40 level for oil and the $1.50 level for copper.
Surmounting long-term resistance on a sustained basis will probably
require a deflation scare. This is not because gold is a hedge against
deflation (it definitely isn't a hedge against genuine deflation) but
because a) a deflation scare would provide the cover for the next round
of central-bank-sponsored inflation, and b) in the absence of a
deflation scare the central banking community will have the freedom to
fight an upside breakout in the gold price with tighter monetary
policy.
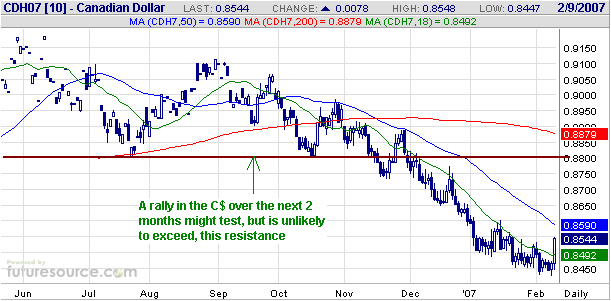
Currency Market Update
The only thing noteworthy that happened in the currency market last
week was Friday's surge in the Canadian Dollar (refer to the following
chart of March C$ futures for details). This price action, coming as it
did after a prolonged period of weakness, is a clear sign of a
short-term trend change.
There's a significant chance that the euro, the Swiss Franc and the Yen
will spike to new lows before commencing tradable rebounds, but it
looks like a 1-2 month rebound is already underway in the C$.
Update
on Stock Selections
(Note: To review the complete list of current TSI stock selections, logon at http://www.speculative-investor.com/new/market_logon.asp
and then click on "Stock Selections" in the menu. When at the Stock
Selections page, click on a stock's symbol to bring-up an archive of our comments on the stock in question)
 American Gold Capital (TSXV: AAU) and Chesapeake Gold (TSXV: CKG) American Gold Capital (TSXV: AAU) and Chesapeake Gold (TSXV: CKG)
The AAU-CKG merger is scheduled to be completed this week, resulting in
AAU shareholders receiving CKG shares, warrants and Class A shares. At
this stage no announcement has been made regarding when the new
warrants and Class A shares will begin to trade and what their symbols
will be.
Each new Class A share will confer the right to purchase ten CKG shares
at C$1.00 per share within the coming 5 years, but the right only
'kicks in' after the gold price closes above US$850/ounce for 90
consecutive days. A new Class A share will, therefore, be more of a
leveraged play on gold bullion than a leveraged play on CKG.
We have no idea how the market will value these Class A shares because
the price will be almost entirely determined by the probability that
the market assigns to gold trading above $850 within 5 years. For
example, in our valuations we've assumed a 50% probability of gold
achieving this objective, so with CKG at C$6.70 we end up with a rough
value of C$28.50 for the Class A shares {10*0.5*(6.70-1.00)}. However,
if the market were to assign a probability of only 20% to gold moving
above $850 within 5 years then with CKG at C$6.70 the Class A shares
would trade at only C$11.40 or thereabouts.
There won't be much liquidity in the market for the CKG Class A shares
because the float will be small (around 900,000). As a result, they
won't make good trading vehicles. Furthermore, the price will make
large swings in response to changes in sentiment towards gold, so it
will only make sense to accumulate them during periods when sentiment
towards gold is 'in the dumps'.
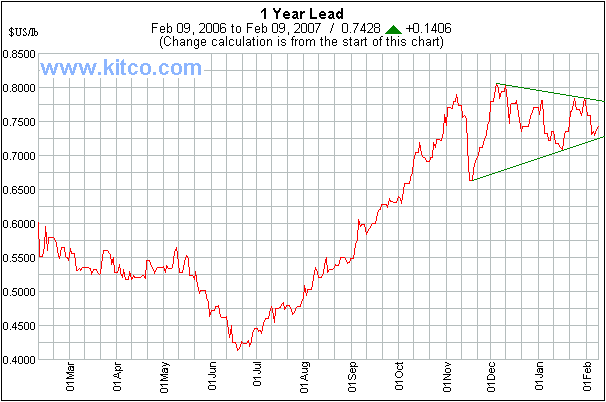
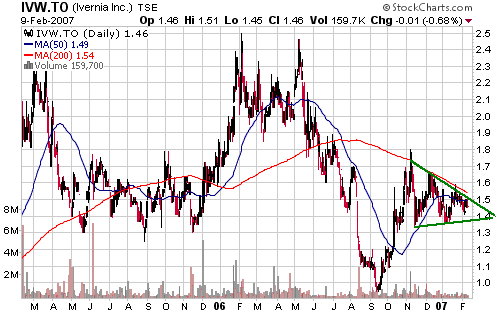
Ivernia Inc. (TSX: IVW). Shares: 134M issued, 143M fully diluted. Recent price: C$1.46
There might be a downturn in the lead market later this year in
response to slowing global growth, but there are no signs of trouble at
this time. In particular, LME stockpiles of the metal have fallen to
near their lows of the past several years and the price appears to be
undergoing a normal consolidation within an intermediate-term upward
trend (see chart below).
As the owner/operator
of the world's largest pure lead mine (the Magellan mine in Western
Australia), IVW is benefiting from the current high lead price and will
obviously benefit even more if lead moves to new highs in the near
future. The company also seems to be progressing well on the
operational front with production steadily increasing toward the design
rate of 100,000 tonnes per year. Given these fundamentals, the current
market cap of around US$175M is low.
Taking a look at the stock's chart (refer below), the price moved
sharply higher during September-November and has since been tracing out
a triangular consolidation pattern. It will have to break out of this
pattern in one direction or the other within the coming 4 weeks and the
odds favour the direction being up.
It would be reasonable, we think, to take partial profits on IVW at
around $2.00 if given the opportunity to do so within the next two
months, and to retain the balance as part of a core industrial metals
position.
Takeover Candidates
Potential takeover candidates in the TSI Stocks List include European
Minerals (TSX: EPM), Minefinders Corp. (AMEX: MFN), Metallica Resources
(AMEX: MRB), Nevsun Resources (AMEX and TSX: NSU), and Northern Orion
Resources (AMEX: NTO). Of these, we think the two most likely
recipients of takeover bids in 2007 are MFN and MRB -- MFN by either
Gammon Lake Resources (AMEX: GRS) or Hecla Mining (NYSE: HL) and MRB by
Xstrata (MRB's JV partner at the huge El Morro copper/gold project).
Both MFN and MRB are presently overbought on a short-term basis and
near all-time highs, which means that right now would not be an ideal
time to be doing any new buying. However, despite the recent gains in
their stock prices and regardless of any potential for them to become
the targets of other mining companies, it is our view that they still
offer two of the best intermediate-term risk/reward ratios in the gold
sector. We do, therefore, think that they would be suitable for new
buying following pullbacks of 5%-10%.
Chart Sources
Charts appearing in today's commentary
are courtesy of:
http://stockcharts.com/index.html
http://www.futuresource.com/
http://www.mrci.com/

|