![]()
![]()
![]()
![]()
-- Weekly Market Update for the Week Commencing 12th February 2018
Big Picture
View
Here is a summary of our big picture
view of the markets. Note that our short-term views may differ from our
big picture view.
The BULL market in US Treasury Bonds that began in the early 1980s ended in mid-2016, but there will be many years of topping action in bond prices and bottoming action in bond yields before major new trends get underway. A major decline in government bond prices will unfold during the 2020s. (Last update: 11 September 2017)
The stock market, as represented by the S&P500 Index, commenced a secular BEAR market during the first quarter of 2000, where "secular bear market" is defined as a long-term downward trend in valuations (P/E ratios, etc.), gold-denominated prices and inflation-adjusted prices. This secular trend will bottom in 2020 or later. (Last update: 11 September 2017)
A cyclical BEAR market in the US Dollar began in 2016-2017. (Last update: 11 September 2017)
Gold commenced a secular bull market relative to all fiat currencies, the CRB Index, bonds and most stock market indices during 1999-2001. This secular trend will peak in 2020 or later. (Last update: 11 September 2017)
Commodities,
as represented by the CRB Index, commenced a
secular BULL market in 2001 in nominal dollar terms. The first major
upward leg in this bull market ended during the first half of 2008, but
a long-term peak won't occur until 2020 or later.
(Last
update: 11 September 2017)
Copyright
Reminder
The commentaries that appear at TSI
may not be distributed, in full or in part, without our written permission.
In particular, please note that the posting of extracts from TSI commentaries
at other web sites or providing links to TSI commentaries at other web
sites (for example, at discussion boards) without our written permission
is prohibited.
We reserve the right to immediately
terminate the subscription of any TSI subscriber who distributes the TSI
commentaries without our written permission.
True
Fundamentals Summary
[Notes:
1) The date shown next to the current True Fundamentals Model (TFM) signal is
when the most recent change occurred. 2) Charts of the Gold and Equity
TFMs are included in the "Charts and Indicators" section of the TSI web
site]
| Market | True Fundamentals Model (TFM) |
| Gold (US$ Price) | Bearish (12 Jan 2018) |
| US Equity (SPX) | Neutral (12 Jan 2018) |
| Currency (Dollar Index) | Bullish (15 Dec 2017) |
| Commodities (GNX) | Bullish (29 Dec 2017) |
Last week's posts at the TSI Blog
No blog posts last week
Summary of current
thinking/positioning
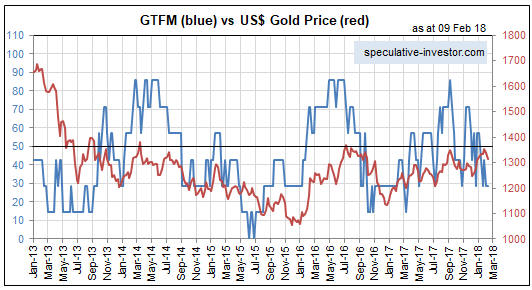
1) Thinking that the US$ gold
price will remain in a downward trend for a few more weeks but will go on
to make new highs for the year during the second quarter.
2)
Expecting a 2-3 week stock market rebound followed by another fast decline
that tests or breaches the early-February low. Although not the most
likely outcome, there is a realistic chance that the SPX will trade as low
as 2200 before the end of Q1.
3) Thinking that industrial
commodities such as oil and copper are in short-term downward trends that
will end in March.
4) Expecting the Dollar Index (DX) to maintain
an overall upward bias for another month or so and then resume its
longer-term downward trend.
5) Expecting that the T-Bond's
downward trend will be interrupted over the coming 2-3 weeks by a rebound
or consolidation.
6) Holding a cash reserve of 25%-30% and looking
for opportunities to increase it.
Still no
flight-to-safety bid for the T-Bond
Despite panic in the stock
market there was more supply than demand for the 30-year T-Bond last week,
hence the continuing decline in the T-Bond price. As illustrated by the
following chart, the T-Bond price has now fallen 5 points since the stock
market's late-January peak. This constitutes a very important change in
the financial markets.
Rather than the T-Bond market rallying in
response to significant stock-market weakness and selling-off in response
to significant stock-market strength, it appears that the T-Bond is now
'in the driver's seat'. To get a rally in the stock market there may have
to be a rally in the T-Bond.
It's likely that the T-Bond will soon commence a multi-week
counter-trend rebound, enabling the stock market to partially recover from
last week's shellacking.
The Stock Market
The incredible collapse
of the short-volatility trade
In our 13th December
commentary under the heading "The trade that is sure to NOT work in 2018",
we wrote:
"The most consistently profitable trade since the
stock-market bottom of February-2016 wasn't owning Bitcoin or one of the
other 'cryptoassets'. The 'cryptos' achieved the largest and fastest price
gains, but they experienced a few 30%+ crashes along the way. The most
consistently profitable trade also wasn't being long the "FANGs". Taking
into account the consistency of the trend, the most profitable trade over
the past 21 months was being short volatility."
And:
"The
belief in the short-volatility trade is now so strong that this trade is
almost guaranteed NOT to work in 2018. By the same token, trades that are
predicated on increased volatility should do much better in 2018 than they
did in 2017."
The 'short volatility' trade blew up in a more
spectacular fashion last week than any trade has ever blown up. And all it
took to bring about a total collapse in this trade was a 5%-10% drop in
the S&P500 Index from its all-time high.
Displayed below are
pictures of the incredible 'blow-up' in the form of daily charts of two
popular short-volatility ETNs (Exchange Traded Notes that are designed to
rise in price when the VIX declines and fall in price when the VIX rises).
The charts show that all gains delivered by the immensely-profitable
short-volatility trade over the past 5-6 years were wiped out in the space
of a couple of days last week.
An excellent explanation of what happened is contained in
Kid Dynamite's 7th February blog post. Two points made in this post
that bear repeating are:
1) The buying of VIX futures by the ETN
issuer in its efforts to balance the price and the NAV of the ETN
exacerbated the VIX's rise, which necessitated more buying of VIX futures
to establish a balance, which pushed the VIX even higher, and so on. In
effect, there was a positive feedback loop.
2) The decision by the
issuer of XIV (one of the most popular short-volatility ETNs) to terminate
the ETN did not cause or even add to the ETN's price collapse. It was the
other way around: The 95% price collapse prompted the issuer to terminate
the ETN. Those who hold the ETN at the termination date will receive a
payment equal to the ETN's NAV on that date.
The short-volatility
trade is dead, at least for the next 12 months. The reason is that having
witnessed what can happen without warning to the prices of the products
designed to profit from low/falling volatility, from now on nobody with
significant money will be interested in buying these products.
This
trade's demise removes a force that was supporting the longer-term upward
trend, in that the large-scale betting on the continuation of the
low-volatility environment was acting to suppress stock-market volatility
and elevate stock prices.
Stocks and Bonds
A week ago we wrote:
"...last week's downside breakout in the
bond market has increased the risk that something more bearish than a
5%-10% correction will occur in the stock market within the next couple of
months.
There will be a further increase in the stock market's
short-term risk if the downside breakout in the T-Bond price is confirmed
by an upside breakout in the T-Bond yield. In fact, if the T-Bond yield
breaks above 3.20% and continues to surge then the probability of
something resembling a stock market crash will become uncomfortably -- or
comfortably, depending on your perspective -- high."
Although
multiple factors contributed to the recent stock market sell-off, there is
no doubt that the decline in the T-Bond price played an important role. To
put it another way, it wasn't a random coincidence that a mini
stock-market panic got underway the day after the T-Bond signaled the
completion of a long-term topping pattern by breaking below major support.
To further explain, the stock market can ignore a rising interest-rate
trend for a considerable time (1-2 years is typical), but at some point
the interest-rate trend shifts from being almost irrelevant to being
almost the only thing that matters. We thought, well in advance of it
happening, that this time around the point of recognition -- the point
when the rising interest-rate trend suddenly goes from being unimportant
to critical as far as the stock market is concerned -- would coincide with
the T-Bond breaking below major support at 146-147. The T-Bond breakdown
was confirmed by the weekly close on Friday 2nd February. On Monday 5th
February, all hell started to break loose in the stock market.
It's
likely that another round of panicked selling in the stock market would be
caused by the T-Bond yield breaking decisively above 3.20%. At the end of
last week the yield was 3.14%.
Current US Market Situation
Last week, the S&P500 March futures contract bottomed on Tuesday at
2529. It then tested Tuesday's low on Friday before rebounding into the
close.
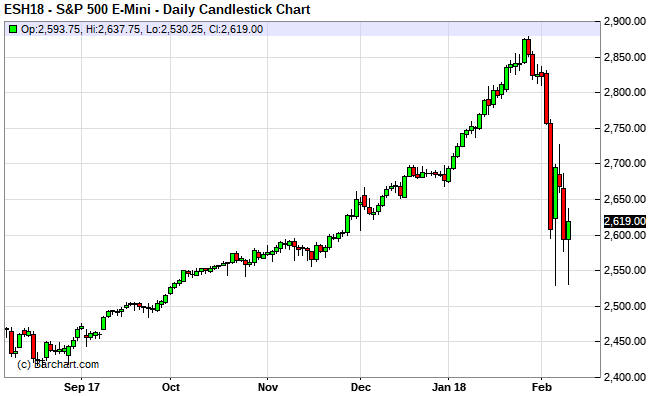
The cash S&P500 Index, however, made a sequence of lower lows last
week before reversing upward on Friday.
Tuesday's low for the March S&P500 futures and Friday's lows for both
the cash S&P500 and the March futures were all within the 2529-2532 range.
Also, we have the 50-week MA at 2512 and the 200-day MA at 2539, so it is
fair to say that there is a confluence of important support within the
2510-2540 range.
The fact that this support range has been probed
during the first downward leg of a correction makes it more likely that
the support will be breached before the correction is over. If it is
breached then a quick decline to the 200-week MA (near 2200) may follow.
Although last week's price action was more dramatic than
envisaged, the expected pattern hasn't changed. The pattern was described
as follows in our previous weekly commentary:
"Almost
regardless of what's in store over the next two months, a multi-week
bottom probably will be put in place this week. There should then be a
rebound that recoups at least half of the loss from the January high
followed by a drop to new lows for the move."
We suspect that
a multi-week bottom was put in place last week and that a rebound will
soon begin. Depending on its strength, a rebound over the coming 2-3 weeks
could create a new opportunity to take a short-term bearish position in
anticipation of a subsequent fast decline to a new low for the year.
Tesla (TSLA) Update
Every now and then TSLA
reminds the market that it a) is hemorrhaging cash, b) will continue to
hemorrhage cash indefinitely, c) is incapable of meeting its own
production targets and d) has an astronomically-high valuation. The market
then promptly forgets about these issues and chooses to dream about what
the stock could be worth in the distant future.
We are betting
against TSLA via the April-2018 $250 put options, which means that we are
betting on a decisive breach of support at $300 happening within the next
two months. The stock traded below $300 on Friday, but then rebounded with
the broad market and managed to end the week above this critical support
level.
$230 would be the short-term chart-based target following a break
below $300. However, it would make sense to take profits on the
above-mentioned put options following a drop to around $250 within the
coming few weeks, because at that point the option price would be above
$20 and there would be more to lose than gain by continuing to hold.
The STOX5E completes an intermediate-term topping pattern
Like its S&P500 Index, the EURO STOXX 50 Index (STOX5E) is very
'oversold' and likely to rebound over the coming 2-3 weeks. However, last
week's decline appears to have completed an intermediate-term topping
pattern.
Our guess is that the STOX5E will rebound to above 3400
within the coming fortnight but trade at 3100 or lower before the end of
March.
This week's
significant US economic events
[Notes:
1) The most important events
(to the markets) are shown
in bold. 2) A list of global economic events can be found
HERE]
| Date | Description |
| Monday Feb-12 | Treasury Budget |
| Tuesday Feb-13 | No important events scheduled |
| Wednesday Feb-14 |
CPI Retail Sales Business Inventories |
| Thursday Feb-15 |
PPI Industrial Production TIC Report |
| Friday Feb-16 |
Housing Starts Import and Export Prices Consumer Sentiment |
Gold and the Dollar