


--
Weekly Market Update for the Week Commencing
12th March 2018
Big Picture
View
Here is a summary of our big picture
view of the markets. Note that our short-term views may differ from our
big picture view.
The BULL market in US Treasury Bonds
that began in the early 1980s ended in mid-2016, but there will be many years
of topping action in bond prices and bottoming action in bond yields before
major new trends get underway. A major decline in government bond prices will
unfold during the 2020s. (Last update: 11 September 2017)
The stock market, as represented by the S&P500 Index,
commenced
a secular BEAR market during the first quarter of 2000, where "secular
bear market" is defined as a long-term downward trend in valuations
(P/E ratios, etc.), gold-denominated prices and inflation-adjusted prices. This secular trend will bottom
in 2020 or later.
(Last update: 11 September 2017)
A cyclical BEAR market in the
US
Dollar
began in 2016-2017.
(Last
update: 11 September 2017)
Gold commenced a
secular bull market relative to all fiat currencies, the CRB Index,
bonds and most stock market indices during 1999-2001.
This secular trend will peak in 2020
or later.
(Last update: 11 September 2017)
Commodities,
as represented by the CRB Index, commenced a
secular BULL market in 2001 in nominal dollar terms. The first major
upward leg in this bull market ended during the first half of 2008, but
a long-term peak won't occur until 2020 or later.
(Last
update: 11 September 2017)
Copyright
Reminder
The commentaries that appear at TSI
may not be distributed, in full or in part, without our written permission.
In particular, please note that the posting of extracts from TSI commentaries
at other web sites or providing links to TSI commentaries at other web
sites (for example, at discussion boards) without our written permission
is prohibited.
We reserve the right to immediately
terminate the subscription of any TSI subscriber who distributes the TSI
commentaries without our written permission.
True
Fundamentals Summary
[Notes:
1) The date shown next to the current True Fundamentals Model (TFM) signal is
when the most recent change occurred. 2) Charts of the Gold and Equity
TFMs are included in the "Charts and Indicators" section of the TSI web
site]
|
Market |
True Fundamentals Model (TFM) |
|
Gold (US$ Price) |
Bearish (12 Jan 2018) |
|
US Equity (SPX) |
Neutral (12 Jan 2018) |
|
Currency (Dollar Index) |
Bullish (15 Dec 2017) |
|
Commodities (GNX) |
Bullish (29 Dec 2017) |
Last week's posts at the TSI Blog
The
rising interest-rate trend
Summary of current
thinking/positioning
1) A number of markets are set
up for trend reversals or accelerations, with the US$ being the linchpin.
If the DX breaks out to the downside from its recent narrow range then
rallies should begin or accelerate across the commodity world, with silver
bullion and gold-mining stocks leading the way higher. However, if the DX
breaks out to the upside from its recent range then the commodity world
will have a downward bias for the ensuing two months.
2) More
evidence has emerged that the US stock market's decline from its January
peak was nothing more than a short-term correction. A test of the
early-February low is still a realistic possibility for some stock
indices, but the probability of a test will drop to almost zero unless the
NDX negates last Friday's upside breakout this week.
3) Downward
corrections in oil and copper will end by May, with the timing dependent
upon what happens in the currency market. We've had March in mind for a
correction low, but the turning point will be delayed if the DX breaks out
to the upside.
4) Bond yields are in long-term upward trends and
will move substantially higher before year-end, but the COT data warn that
a multi-month counter-trend move may have begun.
5) Holding a cash
reserve of 25%-30%.
The oil and
copper corrections
The prices of oil and copper
were expected to decline from January highs to March lows. This
expectation was based on the extent to which these commodity markets were
'overbought' near the turn of the year and also on what we thought would
happen in the currency and stock markets during the first quarter (US$
strength combined with stock market weakness will usually put downward
pressure on the prices of industrial commodities). March lows are still
possible, but depending on whether the Dollar Index breaks downward or
upward from its recent range it's now more likely that either the
correction lows occurred in February (if the US$ soon breaks downward) or
the corrections will extend to May (if the US$ breaks upward).
For
oil, there is a precarious COT situation (a huge speculative net-long
position) counteracted by a physical supply/demand situation that remains
bullish. The price action (see chart below) is neutral. Prior to last
Friday it looked like the oil price was working its way to a new low for
the year, but Friday's strong rebound from support at $60 muddied the
waters.
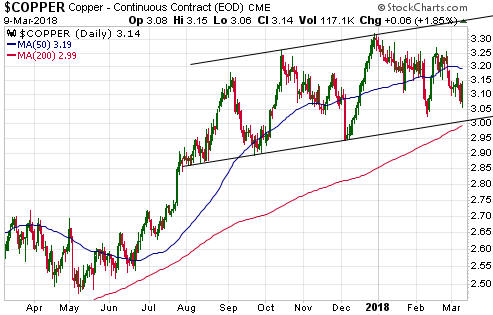
The copper price also rebounded from near support on Friday (copper
has important support at US$3.00-$3.05). For copper, the physical
supply/demand situation is neutral and so is sentiment.
One way to
interpret copper's price chart (see below) is that everything since the
September-2017 top has been a type of "running correction". A normal
downward correction involves lower highs and lower lows, but strong
markets will sometimes 'correct' via a sequence of slightly higher highs
and higher lows.
As mentioned above, important support lies at
$3.00-$3.05. A daily close below $3.00 would warn that the price could
drop as far as $2.50 prior to the correction coming to an end, whereas a
daily close above $3.25 would indicate that the correction was over.
Depending on the timing of the US dollar's rebound peak, the copper
price could trade at $4.00 by mid-year and should trade at $4.00 before
year-end.
The Stock Market
On Friday 9th March the SPX
closed above the level (2781) that we suggested as a stop for short-term
bearish speculations.

More significantly, the NDX achieved a solid daily and weekly close
above its January high. There's a risk that the signal will be negated
within the next few days, but as things stand right now the NDX's breakout
is conclusive evidence that the overall market correction ended on 9th
February.
For other indices there is scant evidence that the correction is over.
For example, the Dow Transportation Average has done no more, to date,
than rebound to its 50-day MA.
For another example, the rebound in the EURO STOXX 50 Index (STOX5E)
is yet to come close to the declining 50-day MA. Furthermore, the STOX5E
didn't even come close to making a new 2-week high last Friday.
Whenever a market breaks through an obvious resistance or support
level, as the NDX has just done, there will be a decent chance that the
breakout is a misleading signal. However, it generally will make sense to
assume that a breakout is genuine/sustainable until proved otherwise.
Also, limits must be placed on any trades in leveraged ETFs/ETNs to
prevent small or at least acceptable losses from becoming problematic. We
have therefore removed the QID (UltraShort QQQ) trade from the TSI List
and recorded a loss of about 12%.
We will consider reinstating the
QID position if evidence emerges that last week's upside breakout was a
'fakeout'. A daily NDX close below 6900 sometime this week would
constitute such evidence.
The other short-term bearish speculation
in the TSI List is the Tesla (TSLA) April-2018 $250 put option. Despite
last week's upside breakout in the NDX, TSLA still looks vulnerable. We
will therefore give this position some additional time.
This week's
significant US economic events
[Notes:
1) The most important events
(to the markets) are shown
in bold. 2) A list of global economic events can be found
HERE]
| Date |
Description |
|
Monday Mar-12 |
Treasury Budget |
|
Tuesday Mar-13 |
CPI |
|
Wednesday Mar-14 |
PPI
Retail Sales
Business
Inventories |
|
Thursday Mar-15 |
Import and Export Prices
Housing Market Index
TIC Report |
|
Friday Mar-16 |
Quadruple Witching
Housing
Starts
Consumer Sentiment
Industrial Production |
Gold and the Dollar
Gold
8-Year Cycle Update
As mentioned in
previous commentaries (most recently in the 14th February Interim Update), if we
apply some artistic licence and assume that gold's 8-year cycle bottomed in
December-2016 then the price action following the latest cycle low has the most
in common with the price action following the February-1985 cycle low. Also of
relevance is that as was the case in the mid-1980s, gold is not currently in a
bull market. It is, instead, immersed in what probably will turn out to be a 2-3
year rally within a bear market or long-term basing pattern.
The chart
displayed below was previously part of our 14th February commentary. It shows
what happened to the US$ gold price and the XAU for several months before and
for about 2.5 years after the February-1985 cycle low. The main takeaway from
this chart is that while the US$ gold price trended upward over the 2.5-year
period following the February-1985 cycle low, it was a very different story for
the gold-mining sector (as represented by the XAU). The gold-mining sector made
new multi-year lows more than a year after gold had made its 8-year cycle low.
A major rally in the gold-mining sector didn't get underway until 17 months
after the 8-year cycle low. It began when the gold price broke above its
early-1986 high in July-August of that year.
The following chart shows the current cycle, with the HUI representing the
gold-mining sector. As was the case in the mid-1980s, after briefly rallying
with gold during the first 1-2 months of the current cycle the gold-mining
sector has diverged bearishly from the bullion market.
If the
similarities between the current cycle and 1985-1987 persist then the
gold-mining sector will remain weak until the gold price breaks above resistance
in the $1360s, at which point a huge catch-up move will get underway.
Note that if we take the comparison with 1985-1987 literally then a major
gold-mining rally won't begin until 17 months after the December-2016 cycle low,
which is May-2018. Although it's beginning to look like the intermediate-term
bottom for the gold sector that was expected to occur in March will be delayed
to May, the key point to bear in mind is that the start of a major gold-mining
rally should coincide with gold making a new 12-month high regardless of whether
the new 12-month high happens this month or May or some other time.
Current Market Situation
Many people
have noticed that the chart pattern formed by the US$ gold price over the past
4.5 years has the look of a long-term base. As illustrated by the following
weekly chart, the top of the base is around $1360.
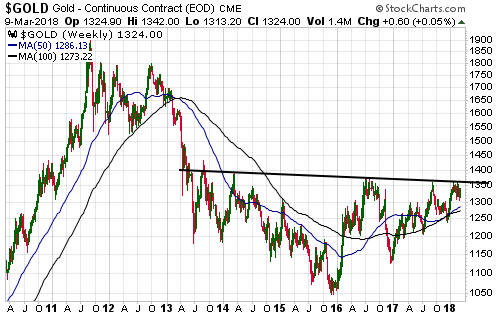
A
weekly close above the top of the base would have bullish implications for the
months and possibly even the quarters ahead, although markets aren't so simple
that you can reliably determine how far a price will move in the aftermath of a
breakout by doing some basic measurements on a chart. To put it another way, if
determining future price performance were as easy as taking a few measurements
on a price chart then anyone capable of doing primary-school arithmetic could
make a fortune in the financial markets. Consequently, the gold price targets
that will get bandied about following an upside breakout and that are already
getting bandied about in anticipation of an upside breakout should be viewed
with a large dose of scepticism.
We expect that the US$ gold price will
break upward from its long-term base within the next few months and that when it
does it will set a fire under the gold-mining sector. However, right here and
now the fundamental backdrop is gold-bearish and an upside breakout by the
Dollar Index is possibly on the cards. It will therefore not surprise us to see
the gold price dip into the $1250-$1300 range before commencing a rally that
goes to new multi-year price highs.
Silver
Silver's Commitments of Traders (COT) situation is bullish, but not as bullish
as it is being made out to be by some pundits.
If you consider only the
net position of speculators in silver futures then you likely will conclude that
silver's COT situation recently became as bullish as it has been in many years
and that the start of a huge rally is imminent. However, if you take into
account other aspects of the COT data you likely will not be so enthusiastic.
The most important 'other aspect' is the open interest (OI).
Here is a
chart showing, from top to bottom, the silver price, the net positions of
traders in Comex silver futures and the OI. Referring to the middle section of
the chart, the net positions of the different classes of trader reflect an
unambiguously bullish situation because they suggest that speculative sentiment
is near a pessimistic extreme. This is evidenced by the unusually low level of
the commercial net-short position (indicated by the blue bars), which is the
mathematical equivalent of the total speculative net-long position. However, the
bottom section of the chart shows that OI is almost 200K contracts, which is in
the top half of its 3-year range. This is important because near an
intermediate-term price bottom the OI will tend to be near a multi-year low.
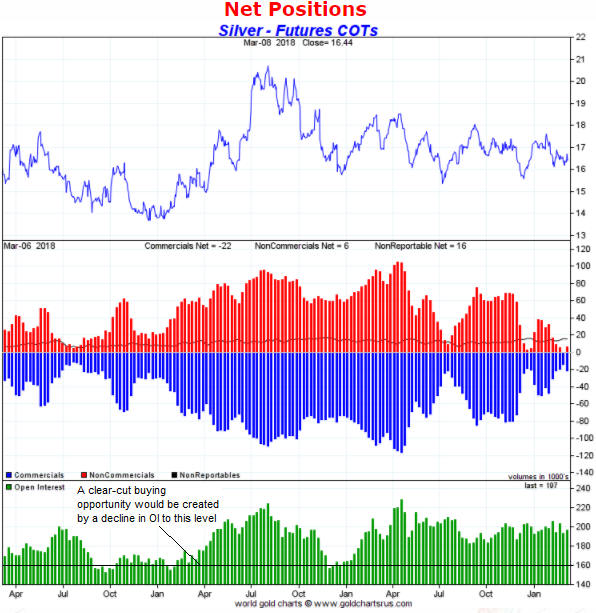
It's possible that the next intermediate-term silver rally will begin with
OI closer to the top than the bottom of its 3-year range, but a much better
rally setup than presently exists would be created by a decline in the OI to
160K contracts.
Based on the current COT situation and the performance
of the silver market over the past four years, if a rally were to begin in the
near future it probably would be limited by the top of the channel drawn on the
following daily chart. That is, the $17.50-$18.00 range would be the most likely
place for a multi-month top.
Gold Stocks
Today we'll take a look at the Gold Miners
ETF (GDX). Whereas the HUI has made a series of marginally lower lows and has
therefore had a slight downward bias over the past 12 months, GDX has traded
within a horizontal range. The bottom of this range ($21) has been tested on six
separate occasions, with the most recent test happening in the past fortnight.
Here's the relevant daily chart:
When a lateral support level is tested as often as GDX has tested support at
$21.00, an eventual downside breakout is likely. However, a downside breakout
doesn't reliably indicate the extent of the ensuing weakness. In GDX's case, for
example, a break below obvious lateral support at $21 could be followed by a 1-2
month decline to as low as $17, but there is an equal probability that the
breakout will be followed within several days by an upward reversal and the
launching of a strong multi-month rally.
If GDX breaks downward from its
12-month range then the most prudent initial assumption will be that significant
additional weakness is in store, but the assumption should change if the
breakout is negated within a short time by a rebound to above the breakout level
($21). A quickly-negated break below obvious intermediate-term support is a
reliable bullish signal.
The Currency Market
The
Dollar Index (DX) has now spent about 6 weeks oscillating between 88.5 and 90.5.
We think that the direction of the breakout from this range will be the main
determinant of what happens in the financial world over the coming few months.
We've thought that the most likely direction of the DX's breakout would be
up. In fact, at this time last month our favoured scenario involved an upside
breakout and a quick rally by the DX to a peak of around 92 well before the end
of March. That could still happen, but due to the additional time spent inside
the 88.5-90.5 range it is no longer the most likely outcome.
It's now
more likely that an upside breakout would be followed by a longer and larger
rally, with the DX potentially rising to 95 and not topping until May. If this
were to happen it would delay an upside breakout in the US$ gold price and
extend the downward corrections in the markets for gold mining shares, silver,
platinum, oil and several other commodities. In a nut shell, the
commodity-market strength that we expected during the second quarter would be
delayed until the third quarter.
The DX's extended range-trading also
raises the possibility that we are dealing with a 1-2 month flat consolidation
prior to a resumption of the longer-term downward trend. That is, it raises the
possibility that the DX won't go any higher than 90.5 before entering the next
leg of its bear market.
Due to the lopsidedly-optimistic speculative
sentiment evident in the euro's COT numbers we still think the odds are in
favour of the DX's eventual breakout being to the upside, but the main point we
want to make right now is that the DX's breakout direction will indicate the
likely paths of several markets over the ensuing 2+ months.
Updates
on Stock Selections
Notes: 1) To review the complete list of current TSI stock selections, logon at
http://www.speculative-investor.com/new/market_logon.asp
and then click on "Stock Selections" in the menu. When at the Stock
Selections page, click on a stock's symbol to bring-up an archive of
our comments on the stock in question. 2) The Small Stock Watch List is
located at http://www.speculative-investor.com/new/smallstockwatch.html
 Company
news/developments for the week ending Friday 9th March 2018:
Company
news/developments for the week ending Friday 9th March 2018:
[Note: AISC = All-In Sustaining Cost, FS = Feasibility Study, FY = Financial
Year, IRR = Internal Rate of Return, ISR = In-Situ Recovery, MD&A = Management
Discussion and Analysis, M&I = Measured and Indicated, NAV = Net Asset Value,
NPV(X%) = Net Present Value using a discount rate of X%, NSR = Net Smelter
Return, P&P = Proven and Probable, PEA = Preliminary Economic Assessment, PFS =
Pre-Feasibility Study]
*Alio Gold (ALO) updated
the market on the progress of its exploration program at the Ana Paula gold
project in Guerrero, Mexico.
The program has three parts. The first part
is drilling six deep holes from surface to get a rough idea of the extent of the
high-grade breccia mineralisation below the proposed open pit. The second part
is about finding new deposits on the project's 56,000 hectare land package. The
third part involves building a decline from the valley adjacent to the proposed
open pit to enable extensive underground drilling of the below-pit breccia
mineralisation.
Two of the six surface holes are complete and apparently
intersected the below-pit breccia mineralisation as expected. Assays will be
available before the end of this month. With regard to second part, two new
breccia targets outcropping at surface have been identified within 1.5 km of the
Ana Paula deposit. This is interesting, but sampling and drilling will be
required to determine the significance. Lastly, construction of the decline is
proceeding as planned and will continue for the next few months, enabling the
underground drilling to commence during Q3.
*Blackham
Resources (BLK.AX) announced that it achieved a new record-high for
production and a new record-low for production cost during the month
February-2018. During the month the company produced 6.7K ounces of gold at an
AISC of only A$912/oz (US$711/oz).
In reaction to this obviously good
news, on Thursday 8th March the stock price gained 52% and about 340M shares
changed hands. Even taking into account the recent explosion in the total share
count due to the company's recapitalisation, this constitutes massive volume. It
equates to about 27% of the company. Then, on Friday 9th March the trading
volume was about 235M shares. This means that over the course of the final two
days of last week about 46% of the company changed hands in reaction to nothing
more than a monthly production update. Extraordinary!
In the 22nd January
Weekly Update, we wrote:
"Making the assumption that the new
recapitalisation plan is completed, we estimate that a BLK share has a fair
valuation range of A$0.07-A$0.11. If the company achieves its guidance and there
is no change in the A$-denominated gold price, then in a year from now the fair
value will rise to A$0.13 due to the repayment of debt. Note that these figures
don't allow anything for the project's expansion potential."
Thanks
to last week's performance the BLK price is now in what we view as the fair
valuation range, allowing nothing for the project's expansion potential. Our
estimate of fair value will rise to A$0.13 at the current gold price if BLK
achieves its 2018 production guidance or it becomes clear that the production
guidance will be achieved, again allowing nothing for the project's expansion
potential.
Participants in BLK's recent 0.04/share entitlement issue and
buyers of the shares/options on the market when the stock was trading in the
A$0.045-0.055 range during January-February now have sizable profits on their
purchases and should be looking for an opportunity to take some money off the
table. A good place to do some selling would be near the top of our 0.07-0.11
valuation range, but, as is often the case, the decision will depend to a large
extent on personal money management considerations such as the amount of
existing exposure to the stock.
For TSI record purposes, profits will be
taken on the BLK options (ASX: BLKOA) if they trade at A$0.05 within the next
two months.
*Continental Gold (CNL.TO) published
its financial report for the year ending 31st December 2017.
The report
shows that at 31st December the company had working capital of US$69M, long-term
debt of US$48M and undrawn credit of US$225M. It also shows that US$115M of the
US$389M Buritica mine development budget had been spent, leaving a balance of up
to $274M.
The company has available financing (working capital plus
undrawn credit) of $294M. Although this should be enough to cover the remaining
mine capex and working capital requirements, we expect that for risk management
purposes a US$20M-$40M equity financing will be done within the next 12 months.
It is important to have a cash cushion when starting production to manage the
'teething problems' that often occur.
Our CNL valuation is unchanged at
C$5.30/share based on US$1300/oz for gold.
*Euro Sun
Mining (ESM.TO) advised that there has been another delay in the
ratification, by the government of Romania, of the Mining Licence for the Rovina
Valley gold-copper project. That's the bad news. The good news is that the
government has published a schedule of the steps required to complete the
ratification. This schedule shows the final step happening by 23rd March.
*Cobalt 27 (KBLT.V) announced that it raised C$200M
via a private equity placement at $11.40/share. Due to the placement being
expanded in response to strong demand, this is $70M more than it initially
planned to raise.
The strong demand is in part a reflection of the new
shares being underpriced, but whether this is a good or bad deal for existing
shareholders will depend mostly on the specific deals that are done with the
money.
*Petrus Resources (PRQ.TO) published its
financial report for the year ending 31st December 2017.
In terms of both
financial performance and stock-market performance, 2017 was a bad year for PRQ
and for Canadian natgas producers in general. For PRQ the sorry tale of 2017
includes cash consumption of about C$25M (net debt increased by C$15M, from
$131M to $146M, but the increase would have been $25M if not for a $10M equity
financing) and a plunge in book value from C$5.58/share to C$3.08/share.
The main problem for PRQ and other Canadian NG producers is the very low NG
price in Canada and the expectation that the NG price will remain very low for
at least 1-2 more years. Refer to the article posted
HERE for more info.
Due to the depressed market in Canada for natural
gas, in 2018 PRQ will be prioritising its light oil drilling opportunities and
moderating its growth. The company expects that this will enable net debt
repayment of C$10M-$15M during the year.
Prioritising its light oil
drilling opportunities and moderating its growth would have been the right
course of action for 2017, but the right course of action is always obvious with
the benefit of hindsight.
*Ramelius Resources (RMS.AX)
reported good results from infill drilling at both of its West Australian gold
mines (Edna May and Mt Magnet). Both mines have short remaining lives based on
current reserves, but exploration success should enable them to continue
producing near current rates for many years to come.
List
of candidates for new buying
From within the ranks of TSI stock
selections the best candidates for new buying at this time, listed in
alphabetical order, are:
1) ALK.AX (last Friday's closing price: A$0.31)
2) ALO (last Friday's closing price: US$2.49)
3) AOI.TO (last
Friday's closing price: C$1.33)
4) PG.TO (last Friday's closing price:
C$3.11)
5) XPL (last Friday's closing price: US$0.49)
The above
list is limited to five stocks. It will sometimes contain less than five, but it
will never contain more than five regardless of how many stocks are attractively
priced for new buying.
Potential
addition to the TSI List: Columbus Gold (TSX: CGT). Shares: 159M issued, 161M
fully diluted. Recent price: C$0.35.
CGT's principal asset is
its 45% ownership of the Montagne d'Or (MDO) gold project in French Guiana. The
remaining 55% of the project is owned by Nordgold, a mid-tier gold producer
based in Russia.
According to the
FS completed in early-2017, for a capital cost of US$361M the MDO project
could be developed into a mine with average annual production of 237K ounces
over 10 years. The FS estimated that at a gold price of US$1250/oz the mine
would have an after-tax IRR and NPV(5%) of 18.7% and US$370M, resp.
The
above-mentioned economics are solid without being impressive, but it's likely
that the economics will be enhanced by adding reserves to the mine plan.
Importantly, Nordgold clearly believes that the economics are good enough to
justify building a mine because it has moved the project into the permitting and
detailed engineering stage. The expectation is that all permits will be received
by late-2019 and that mine construction will begin in early-2020. Therefore,
unless it is taken over by its senior partner there's a good chance that within
a few years CGT will have attributable production of about 100K ounces/year.
In our opinion, the current value of CGT's 45% stake in the MDO project is
US$83M. This figure was arrived at by applying a 50% discount to the US$370M NPV
noted above. It could be argued that a 50% discount is a little high for a
project with a completed FS, but we think it is reasonable given the country,
permitting and execution risks.
At the current C$/US$ exchange rate, a
US$83M valuation for CGT's stake in the MDO project implies that CGT is worth
C$0.67/share.
We first had a close look at CGT during the final quarter
of last year. At that time we saw nothing to interest us because the shares were
trading in the C$0.70s, which we thought was close to full value. Note that the
company spun off its early-stage exploration projects to shareholders in January
of this year via the listing of a company called Allegiant (AUAU.V), so full
value was about C$0.10/share higher in Q4-2017 than it is today.
We are
now interested because although the value of the MDO project hasn't changed, the
price of CGT shares is much lower. As illustrated below, the price collapsed
over the past two months and is now close to a 3-year low.
The
distance between our estimate of fair value and the share price is now big
enough to make CGT a candidate for new buying, but we are not ready to add the
stock to the TSI List. The reason is that the company is out of money and will
soon have to do an equity financing. CGT owns about C$2.5M of AUAU shares that
could be sold to raise some cash, but this would be a stop-gap measure.
Nordgold will be paying all permitting, engineering and construction costs
associated with development of the MDO project until 60 days after all permits
are received, so CGT probably won't need a lot of money until H1-2020. However,
we anticipate an equity financing of C$5M-$10M within the next few months.
Our plan, therefore, is to wait for either the financing announcement or a
decline in the stock price to C$0.30 (whatever happens first) before adding CGT
to the TSI List as an intermediate-term trade.
Summary
of potential additions to the TSI List
For ease of reference,
here is a table showing the potential additions to the TSI Stocks List that
we've mentioned over the past few months. The table notes the price at which
each stock would be automatically added (unless advised otherwise) and whether
the stock would be a long-term position or a shorter-term trade.
Chart Sources
Charts appearing in today's commentary
are courtesy of:
http://stockcharts.com/index.html
http://www.goldchartsrus.com/
