|
-- Weekly Market Update for the Week Commencing 12th November 2012
Big Picture
View
Here is a summary of our big picture
view of the markets. Note that our short-term views may differ from our
big picture view.
In nominal dollar terms, the BULL market in US Treasury Bonds
that began in the early 1980s will end by 2013. In real (gold)
terms, bonds commenced a secular BEAR market in 2001 that will continue
until 2014-2020. (Last
update: 23 January 2012)
The stock market, as represented by the S&P500 Index,
commenced
a secular BEAR market during the first quarter of 2000, where "secular
bear market" is defined as a long-term downward trend in valuations
(P/E ratios, etc.) and gold-denominated prices. This secular trend will bottom sometime between 2014 and 2020.
(Last update: 22 October 2007)
A secular BEAR market in the Dollar
began during the final quarter of 2000 and ended in July of 2008. This
secular bear market will be followed by a multi-year period of range
trading.
(Last
update: 09 February 2009)
Gold commenced a
secular bull market relative to all fiat currencies, the CRB Index,
bonds and most stock market indices during 1999-2001.
This secular trend will peak sometime between 2014 and 2020.
(Last update: 22 October 2007)
Commodities,
as represented by the Continuous Commodity Index (CCI), commenced a
secular BULL market in 2001 in nominal dollar terms. The first major
upward leg in this bull market ended during the first half of 2008, but
a long-term peak won't occur until 2014-2020. In real (gold) terms,
commodities commenced a secular BEAR market in 2001 that will continue
until 2014-2020.
(Last
update: 09 February 2009)
Copyright
Reminder
The commentaries that appear at TSI
may not be distributed, in full or in part, without our written permission.
In particular, please note that the posting of extracts from TSI commentaries
at other web sites or providing links to TSI commentaries at other web
sites (for example, at discussion boards) without our written permission
is prohibited.
We reserve the right to immediately
terminate the subscription of any TSI subscriber who distributes the TSI
commentaries without our written permission.
Outlook Summary
Market
|
Short-Term
(1-3 month)
|
Intermediate-Term
(6-12 month)
|
Long-Term
(2-5 Year)
|
|
Gold
|
Bullish
(17-Oct-12)
|
Bullish
(26-Mar-12)
|
Bullish
|
|
US$ (Dollar Index)
|
Bearish
(29-Oct-12)
|
Neutral
(09-Jan-12)
|
Neutral
(19-Sep-07)
|
|
Bonds (US T-Bond)
|
Neutral
(12-Nov-12)
|
Neutral
(18-Jan-12)
|
Bearish |
|
Stock Market
(DJW)
|
Bearish
(30-Jul-12)
|
Bearish
(28-Nov-11)
|
Bearish
|
|
Gold Stocks
(HUI)
|
Bullish
(22-Oct-12)
|
Bullish
(23-Jun-10)
|
Bullish
|
|
Oil |
Neutral
(30-Jul-12)
|
Neutral
(31-Jan-11)
|
Bullish
|
|
Industrial Metals
(GYX)
|
Neutral
(30-Jul-12)
|
Neutral
(29-Aug-11)
|
Neutral
(11-Jan-10)
|
Notes:
1. In those cases where we have been able to identify the commentary in
which the most recent outlook change occurred we've put the date of the
commentary below the current outlook.
2. "Neutral", in the above table, means that we either don't have a
firm opinion or that we think risk and reward are roughly in balance with respect to the timeframe in question.
3. Long-term views are determined almost completely by fundamentals,
intermediate-term views by
fundamentals, sentiment and technicals, and short-term views by sentiment and
technicals.
The "Fiscal Cliff"
The US "Fiscal Cliff" is garnering an
incredible amount of media attention and will continue to do so. It's being
treated as if it were an enormous deal. It isn't. The "cliff" will come and go
with no dramatic changes. The total amount of money under discussion is small
compared to the budget deficit and the government's debt. The amount of money
(spending and taxes) about which there is strong disagreement between the two
political parties is much smaller still. And the total amount of money under
discussion is like a drop in the ocean compared to the unfunded liabilities of
the US government.
Here is a neat summary of the major components of the "Fiscal Cliff" from a
recent
article by John Mauldin:
"1. Abolition of the Bush tax cuts, which amount to $265 billion, of which
$55 billion is for the 'wealthy' and $210 billion for the 'middle class'
(everyone else). Almost no one on either side of the aisle wants to actually go
forward with axing the tax cuts for the middle class. Republicans want to hold
on to the top-level tax cuts, and to my mind that's a bargaining chip.
2. The Budget Control Act, or the debt-ceiling deal, comes in at roughly $160
billion, with $110 billion of that in sequestration, mostly for defense; and
there seems to be a growing consensus that not all of these cuts should be made.
3. The 2009 stimulus will also roll off (this is the 2% Social Security break
and extended unemployment benefits). This amounts to $140 billion or almost 1%
of GDP. Almost everyone agrees that these tax cuts were supposed to be
temporary.
4. The 'ObamaCare' $24-billion tax increase on high-income households is almost
sure to be allowed to go through.
5. Technically, there is $105 billion in the temporary 'doc fix' and Alternative
Minimum Tax, which every year are supposed to expire and every year are
postponed, which of course allows Congress and the president (whoever is in
control) to project lower deficits in the future, even though those cuts never
happen."
T-Bond Update
The T-Bond is absurdly over-valued. At the same
time, it is not 'overbought' on either a short- or intermediate-term basis and
sentiment is neutral. Also, the price action looks neutral-bullish, with last
week's post-election bond rally having created the impression that the decline
from the July top was nothing more than a routine short-term correction (see
chart below). Our short-term T-Bond outlook has therefore shifted from "bearish"
to "neutral". Neutral, in this case, indicates a lack of clarity on our part
regarding the market's upside potential and downside risk.
Neither a T-Bond buyer nor a T-Bond short-seller be.

The price is wrong. Is
this a problem?
Grant Williams writes an always-interesting
weekly letter called "Things That Make You Go Hmmm" that now gets distributed by
"Mauldin Economics". In a
recent
letter Mr. Williams discusses the fact that due to the interventions of
governments and central banks, the prices of most investments are wrong. One of
his conclusions is that this creates a big problem for investors. We agree and
disagree.
We most definitely agree that the interventions of central banks and governments
are causing a lot of prices to be wrong. This is a huge problem for the economy,
because wrong prices lead to poor decisions. As succinctly explained by Don
Boudreaux in a
20th
September post at Cafe Hayek: "...successful mutual coordination of the
economic decisions of millions of people occurs to the extent that prices --
which guide people's economic decisions -- accurately reflect underlying
economic realities such as resource scarcities and households' preferences for
saving. ...government activities that distort prices [therefore] cause prices to
'lie' about underlying economic reality and, hence, cause prices to mislead
economic actors into making an unusually large number of plans that are destined
to fail."
We also agree that the plague of wrong prices creates a problem for many
investors. For example, due to false price signals the decision-making process
of someone deciding whether or not to establish a new manufacturing facility or
build a new office block or develop a new copper mine or start a new restaurant
will be more difficult and subject to error than it should be.
Lastly, we agree that to a large extent the financial markets are broken. Due to
the meddling of central banks and governments, the financial markets now do a
much poorer job of allocating capital. One example is that a lot of stock market
investment is now dictated by what central banks are expected to do.
We disagree that the methods of determining the right price are altered by the
distortions caused by intervention. After rapid monetary inflation and
artificially low interest rates have caused valuations to become high and stay
high for an unusually long time, many investors will conclude that the
traditional ways of determining value no longer apply. This is a mistake. The
traditional valuation methods will always apply. Assuming that they don't is a
sure way to lose a lot of money in the long run. Understanding that they do is
the key to identifying the prices that are most wrong.
This brings us to the second point of disagreement. Wrong prices are not a
problem for all investors. The reason is that smart investors and speculators in
financial markets make money by exploiting situations where the price is wrong.
The greater the extent to which the price of a particular asset is wrong, the
greater the opportunity to make money by trading the asset. And the more
widespread the mispricing stemming from government and central bank
intervention, the more investing/speculating opportunities there will be. By the
same token, if everything were correctly priced then it would be much more
difficult for investors and speculators to generate outsized gains.
In summary, a lot of prices are wrong and this constitutes a major economic
problem. It's a problem that's going to get worse, because the economic weakness
caused by intervention-related price distortions only encourages the bozos at
the central bank and in the government to intervene more aggressively. However,
for some investors and speculators in financial markets, the greater the extent
of the mispricing the greater the money-making opportunity.
The Stock
Market
Displayed below are five weekly charts that
paint a picture of the global stock market situation. The blue line on each
chart is the 50-week moving average and the charts are shown in order from most
to least 'oversold'.
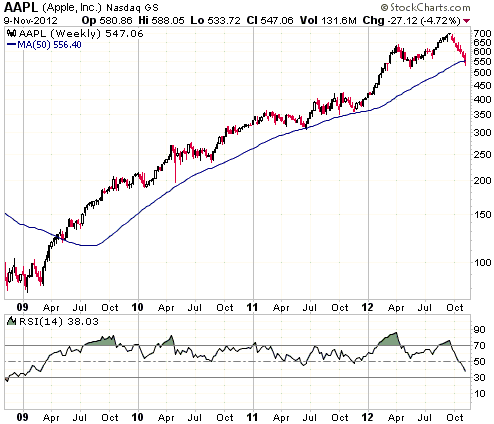
We begin with a chart of Apple (AAPL), the world's most important tech stock.
AAPL has become such a profitable company and such an important stock that it is
almost an asset class on its own.
AAPL has just ended a week below its 50-week MA for the first time since the
second quarter of 2009 and is now more 'oversold' than it has been at any time
since the first quarter of 2009. It is also very cheap based on what it will
earn this year. Whether it is cheap based on what it will earn over the next two
years is anyone's guess.
AAPL is poised for a substantial rebound, although the start of the rebound will
possibly be delayed by weakness in the broad market.
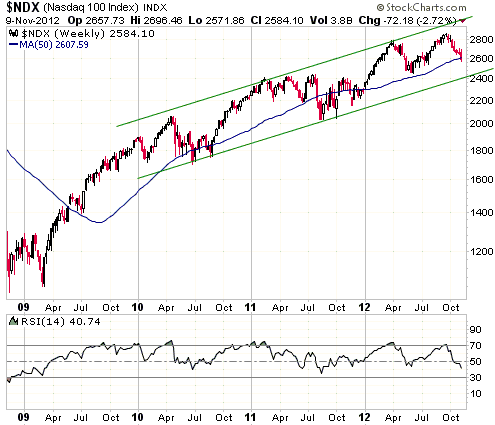
Next up we present a chart of the NASDAQ100 Index (NDX). The NDX is moderately
'oversold', but not sufficiently so to skew short-term risk/reward decisively
towards reward. Notice, in particular, that the 2010 and 2011 corrections ended
at significantly lower levels relative to the 50-week MA and the 3-year price
channel.
The NDX's short-term risk/reward would most likely become bullish if the NDX
were to decline to around 2450 within the next three weeks.
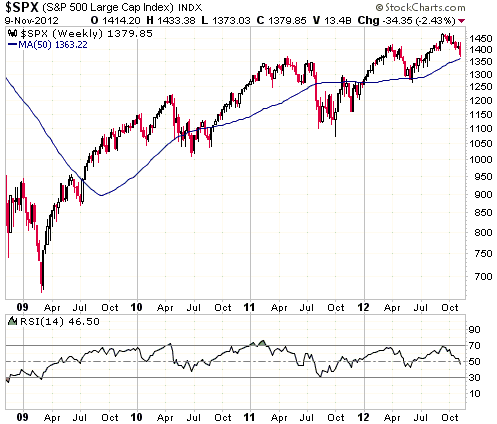
Our third chart shows the S&P500 Index (SPX). The SPX is only slightly
'oversold' and hasn't yet reached its 50-week MA.
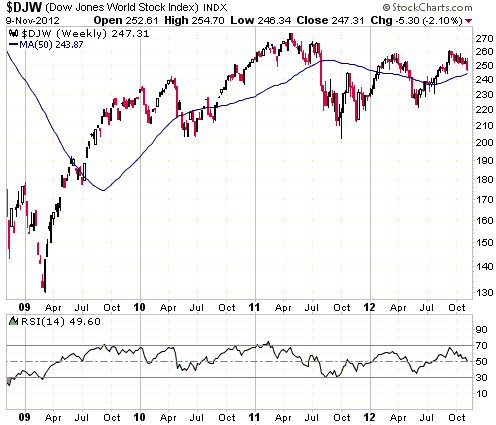
Our fourth chart shows the Dow Jones World Stock Index (DJW). This chart is
neutral -- not 'oversold', not 'overbought', not suggestive of anything in
particular.
Finally, we turn our attention to Hong Kong's Hang Seng Index (HSI). The
following chart shows that the HSI has just turned down after reaching a
short-term peak during the week before last. It is still 'overbought'.
Although the HSI probably needs to spend some time correcting/consolidating, its
relative strength over the past two months has been enough to suggest a reversal
of the pattern of the past two years. In other words, it looks like the HSI has
transformed into a relatively strong stock index.
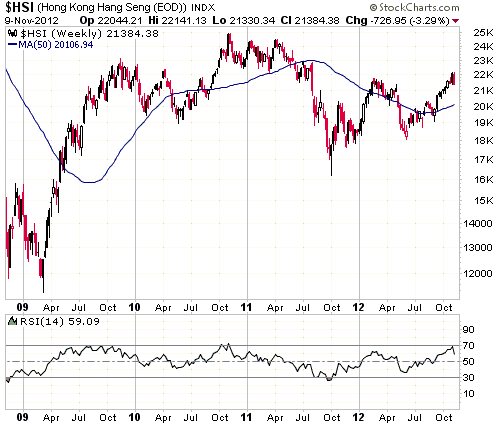
Conclusion: AAPL has more short-term upside potential than remaining downside
risk, the NDX's short-term risk and reward are roughly in balance, while the
SPX, the DJW and the HSI have the potential to suffer significant additional
downside over the weeks ahead.
This week's
important US economic events
| Date |
Description |
| Monday Nov 12 |
US bond market closed for Veteran's Day. Stock market open.
| | Tuesday Nov 13 |
Treasury Budget | | Wednesday
Nov 14 |
PPI
Retail Sales
FOMC Minutes
Business Inventories | | Thursday
Nov 15 |
CPI
Empire State Mfg Survey
Philadelphia Fed Survey
|
| Friday Nov 16 |
TIC Report
Industrial Production
|
Gold and
the Dollar
Gold and Silver
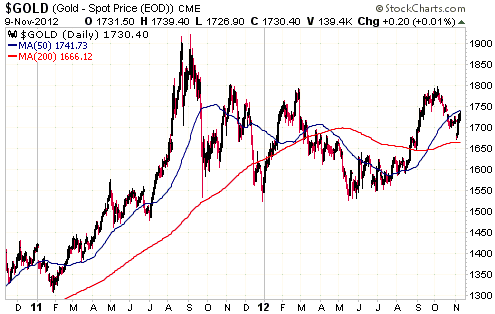
The US$ gold price bottomed just above its 200-day moving average during the
week before last and rebounded to just below its 50-day moving average last
week. The price action is consistent with a routine correction having just come
to an end, but the evidence is far from conclusive.
The sentiment situation is also consistent with a routine correction having just
come to an end, in that Market Vane's bullish percentage hit a low of 63% on
Friday 2nd November and the total speculative net-long position has fallen by
61K contracts since early October. These sentiment figures are roughly in line
with what would typically be seen near the end of a short-term correction.
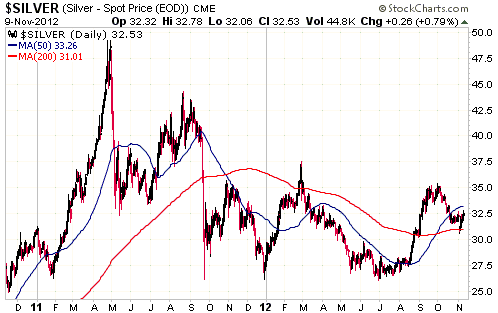
At this stage it looks like silver's correction ended near the middle of the
most likely $2 range for a correction low, but as is the case with gold the
evidence is far from conclusive. As we've noted in the past, conclusive evidence
of a low or a high usually only arrives well after the fact.
Gold Stocks
Last week's performances by the HUI and the XAU could aptly be described as
noncommittal. As evidenced by the following daily chart, the XAU did very
little. It simply remained within the confines of the narrow downward-sloping
channel that began to form in September.
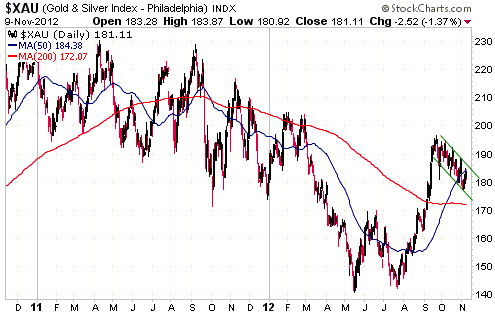
Despite the recent lack of strength we are becoming increasingly bullish about
the prospects for gold stocks. Actually, it's partly because of the recent lack
of strength that we are becoming increasingly bullish. The extension of the
downward correction makes it more likely that the overall advance from the May
low will last well into next year.
Recall that according to our reading of the situation, the most likely
alternative to the overall advance being sustained well into next year was an
intermediate-term peak late this year. With the corrective action that began in
September having continued until mid-November there is now almost no chance of
an intermediate-term peak by year-end. The correction has been long enough and
large enough to lay the foundation for a rally lasting at least a few months.
Although last week's performance by the gold sector was generally lacklustre, it
was interesting that the senior gold stocks were stronger on the days when the
broad stock market fell and weaker on the days when the broad stock market rose.
We expect to see a lot more of this type of performance over the coming 12
months, with the gold sector making progressively higher highs and higher lows
while the broad stock market works its way downward.
Note that an inverse relationship of the nature outlined above has occurred
numerous times during the past 4 decades. In other words, such an outcome would
be far from unprecedented. The gold sector is actually the only sector of the
stock market that has regularly bucked major trends in the broad stock market.
It happens this way because gold mining companies produce the premier
counter-cyclical investment.
We acknowledge that if there were another 2008-style market crash then gold
stocks would be dragged down with all other stocks, but a 2008 repeat is
unlikely in the extreme. We will continue to assess the evidence in real time,
but at this stage we can't envisage the monetary backdrop changing over the next
few months in a way that would give a 2008-style collapse a realistic chance.
Also of relevance is the general point that the next crisis is rarely, if ever,
similar to the last crisis. As things stand today, the last crisis was the
'mother of all' deflation scares. It involved large declines in the prices of
all investments except the highest grade government bonds. We suspect that the
next crisis will involve a melt-up in gold-related investments driven by
rapidly-rising fear of what central banks and governments are doing. The start
of the next crisis is probably more than a year away.
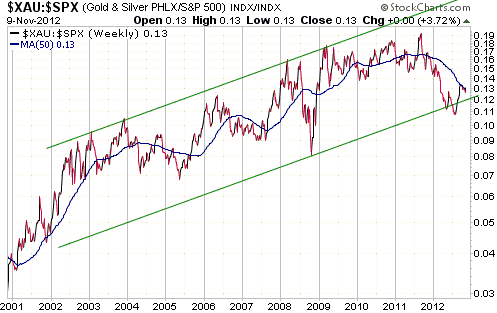
Moving on, the following weekly chart of the XAU/SPX ratio is one way to
illustrate the upside potential of gold stocks relative to stocks in general,
assuming that the long-term bull market in the XAU/SPX ratio isn't over. This is
a reasonable assumption, because a) the long-term bull market in the XAU/SPX
ratio shouldn't end until the gold bull market comes to an end, and b) in our
1st October and 29th October commentaries we explained why the gold bull market
was still years away from its ultimate top.
Given that the XAU/SPX ratio is coming off its most oversold extreme of the
entire bull market and is still near the bottom of its long-term channel, it is
reasonable to expect substantial strength in the gold sector relative to the
broad market over the coming 12 months as the major trend shifts from massively
'oversold' to 'overbought'. This should result in a strong rally in the gold
sector even if the broad stock market is moderately weak. For example, a decline
to 1200 by the SPX combined with a move in the XAU/SPX ratio to near the top of
its long-term channel would translate into a rise to around 300 by the XAU.
We aren't forecasting moves to 1200 and 300 in the SPX and the XAU,
respectively, over the next 12 months. These numbers were only mentioned to
indicate the XAU's upside potential. Our forecast is simply that gold stocks, as
represented by the XAU and the HUI, will handily outperform the broad stock
market over the coming year and in the process achieve good absolute returns.
Currency Market Update
They say it's darkest before the dawn. At various times over the past year the
economies of some euro-zone (EZ) countries have seemed to get as dark as they
could possible get, only to become even darker. It didn't seem possible, for
example, that Spain's economy could get much worse, but last week the Spanish
government reported that September-2012 was one of the worst months ever for
industrial output. The government says that Spain's industrial output is down by
7% year-over-year, which probably means that it is actually down by at least
10%. It is difficult for us to imagine how bad things must be in Spain, let
alone how bad they must be in Greece. It is very dark in parts of the EZ, but at
this stage there is no sign of the 'economic dawn'.
The real EZ solution involves defaulting on government debt and slashing
government spending, but the real solution is not being attempted. Instead,
bandaids are occasionally applied in the hope that carrying an impossibly heavy
-- and becoming heavier by the day -- debt burden will somehow become possible
with the passing of time.
The long-term survival of the euro relies on a real solution to the debt
predicament being implemented. However, short-term strength in the euro is all
about bandaids. There will be a strong euro rally if/when the next
inflation-related bandaid is applied.
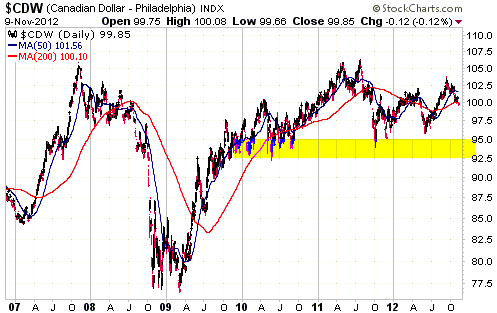
The Canadian Dollar has essentially traded sideways over the past 2 years. Like
most 'investments' that are perceived to benefit from the Fed's QE, it reached
its most recent peak shortly after the QE3 announcement. It has since pulled
back and is slightly 'oversold' on a short-term basis, but not sufficiently so
to create tradable upside potential.
Strong support lies at 92.5-95.0.
Update
on Stock Selections
Notes: 1) To review the complete list of current TSI stock selections, logon at
http://www.speculative-investor.com/new/market_logon.asp
and then click on "Stock Selections" in the menu. When at the Stock
Selections page, click on a stock's symbol to bring-up an archive of
our comments on the stock in question. 2) The Small Stock Watch List is
located at http://www.speculative-investor.com/new/smallstockwatch.html
 Company
news/developments for the week ended Friday 9th November 2012: Company
news/developments for the week ended Friday 9th November 2012:
[Note: FS = Feasibility Study, IRR = Internal Rate of Return, M&I =
Measured and Indicated, NPV(X%) = Net Present Value using a discount
rate of X%, P&P = Proven and Probable, PEA = Preliminary Economic
Assessment, PFS = Pre-Feasibility Study]
*Evolution Mining (EVN.AX) announced that it had arranged a $200M
line of credit. This credit doesn't appear to be needed to support
the company's existing operations and development projects, so EVN
could be gearing up to make an acquisition. A lot of junior gold
explorers and producers are presently sporting very low valuations,
which means that there are now plenty of good opportunities for
financially strong mid-tier gold miners (like EVN) to grow via
acquisition.
*Fairborne Energy (FEL.TO) reported its financial results for the
September quarter. The company sold more than half of its assets
during the quarter and there was a large write-down associated with
this asset sale. This write-down led to a big $121M loss being
reported for the quarter, but the company's operations were
cash-flow positive.
As previously advised, our plan is to exit FEL after its price
recovers to around C$2.
*Golden Predator (GPD.TO) reported the results from 19 holes
drilled at the "Classic Zone" of its Brewery Creek project in
Canada's Yukon. The results were decent, but nothing special. The
next important news from GPD will likely be the updated Brewery
Creek resource estimate scheduled for next month. GPD is a strong
buy in the low-C$0.30s, but keep in mind that tax-related selling
could keep a lid on its price until year-end.
*Golden Star Resources (GSS) reported its financial results for
the September quarter (having reported quarterly production results
a month ago). The company reported a sizeable loss for the quarter,
but this was due to a non-cash adjustment to the value of its 2017
convertible debentures. Accounting adjustments associated with the
2017 debentures will cause additional large swings in reported
earnings in the future, which makes it more important than ever to
focus on the company's cash flow. During the most recent quarter
GSS's operations were strongly cash-flow positive.
One of the best measures of GSS's performance is the change in its
working capital (current assets minus current liabilities). Working
capital improved from $65M at the end of June to $93M at the end of
September. This $28M improvement was primarily due to cash generated
by the company's mining operations.
GSS's balance sheet is likely to strengthen further during the
December quarter as it uses part of its cash to pay off the 2012
convertible notes and as its operations throw off more cash.
The GSS stock price has roughly doubled since its May-2012 bottom.
Assuming that management doesn't make any additional big mistakes,
the de-risking of the company's balance sheet and its relatively low
valuation suggest the potential for the stock price to double again
within the coming 9 months.
*International Tower Hill Mines (THM) issued a pointless press
release that did nothing other than state that engineering work was
continuing with the aim of completing the Livengood project's FS
during the first half of 2013. Everyone following the stock already
knew that.
The press release was probably more about addressing the decline in
the company's stock price than about providing useful information.
The stock has continued to underperform due -- as far as we can tell
-- to lack of interest. At this time the market has minimal interest
in large low-grade gold deposits. THM's management can't do anything
about that, other than prove -- via the upcoming FS -- that
Livengood's economics are robust despite the low grade.
THM is definitely suitable for new buying near its current low
price, but, as is the case with other junior mining stocks that are
trading near their lows for the year, be aware that it could be held
in check by tax-related selling between now and late December.
*Jaguar Mining (JAG) advised that it would report its latest
quarterly results and updated guidance after the close of trading on
Monday 12th November. The stock has recently traded heavily, which
could be due to people who 'know something' selling ahead of bad
news. However, it is just as likely due to sector-wide negativity
towards higher-risk stocks. We await the results with bated breath.
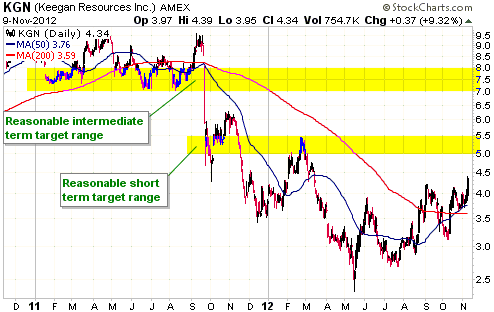
*Keegan Resources (KGN) issued its latest quarterly reports. There
was nothing new in these reports. KGN's stock price appears to be on
its way to US$5.00-$5.50.
*Pretium Resources (PVG) published its latest quarterly report.
The report reiterated earlier advice that the next resource estimate
and the FS for the Brucejack high-grade project will be issued
during December-January and Q2-2013, respectively. It also indicated
that the company had $60M of working capital at 30th September.
*Rio Novo Gold (RN.TO) published the results of the FS for its
Almas gold project in Brazil. The bad news is that the initial capex
increased from the $94M shown in the April-2012 PEA to $150M in the
FS. The good news is that the project still looks economically
viable, in that despite the blow-out in the capex the project's
estimated after-tax NPV(5%) is approximately the same now as it was
in the PEA (at an assumed gold price of $1595/oz the NPV is
currently estimated to be $191M). Other points of interest in the FS
were: 1) gold production expected to average 63K-oz/year over the
first 11 years; 2) cash operating cost estimated to be $721/oz; 3)
production startup scheduled for H1-2014; and 4) P&P reserves
estimated to be 764K ounces.
Using the current share count of 114M, the NPV estimate of $191M
mentioned above equates to $1.67 per RN share. Given that RN ended
last Friday's session at C$0.23, this suggests huge upside potential
in the share price. The problem is that RN will not be able to
finance the $150M project capex without massively diluting existing
shareholders. In our opinion, the company's best strategy would be
to bring on board a larger and financially-stronger JV partner.
RN is a speculative buy in the low-C$0.20s.
*Sabina Gold and Silver (SBB.TO) issued its mandatory reports for
the September quarter. For us, the only information of interest in
these reports was the company's working capital (current assets
minus current liabilities), because everything else of significance
had been noted within earlier press releases.
SBB had $127M of working capital (WC) at 30th September, down from
$153M at 30th June. The company estimates that it will end 2012 with
$118M of WC. In the 20th August Weekly Update we estimated that SBB
would end the year with $120M of WC, so it looks like we were out by
$2M (1.7%). An error of this magnitude would be excellent for
government work and is still OK for the private sector.
Assuming that SBB does end the year with $118M of WC then the
company will have burned through $77M of cash over the course of the
year (it began 2012 with $161M and raised $34M via an equity
financing). This implies that if it maintains its current rate of
spending it will begin 2013 with enough cash to fully fund its work
for more than 12 months. This doesn't mean that SBB won't do another
equity financing next year, but it should mean that the company
won't be pressured into doing a financing at an inopportune time.
*Volta Resources (VTR.TO) published its mandatory reports for the
September quarter. The two main points of interest: 1) the company
had working capital of $24.8M at 30th September, down from $29.2M at
30th June, and 2) the FS for the Kiaka project is scheduled to be
completed in Q3-2013.
VTR's current cash hoard should be enough to see it through the next
6 months, but another equity financing will probably be required
prior to completion of the FS.
Final
comment on Andina Minerals (TSXV: ADM)
We removed ADM, an exploration-stage gold miner with a low-grade 10M-ounce gold
deposit in Chile, from the TSI Stocks List in May-2012 and recorded a big loss
on the position. We said at the time that we held ADM shares in our own account
that we wouldn't be selling in the immediate future but intended to sell within
the ensuing few months. No decent opportunities to sell the shares arose over
the ensuing months, until last week when it was announced that Hochschild Mining
had made an all-cash offer to buy ADM at C$0.80/share. This constitutes a
premium of 100% to where ADM was trading just before the offer. Anyone (us, for
example) who bought ADM prior to the past 12 months will still have a sizeable
percentage loss, but considering the circumstances this is a good deal for ADM
shareholders. It is, at least, a liquidity event that frees up cash to be used
elsewhere.
Speculation
Idea: Yellowhead Mining (TSX: YMI). Shares: 61M issued, 75M fully diluted.
Recent price: C$0.66
Taseko Mines (TGB) is one of the many junior mining stocks that we have no
financial interest in, but keep a distant eye on (meaning that we keep track of
its stock price and quickly scan its press releases). Late last week TGB
announced that it had purchased 7.7M shares of Yellowhead Mining (YMI.TO) in a
private placement, bringing its total stake in YMI to 10.3M shares (16.8% of the
company).
We had never heard of YMI, so we quickly checked it out not expecting to find
anything of interest. We guessed that it was an exploration-stage copper miner
at a very early stage of development. We discovered that YMI is indeed an
exploration-stage copper miner, but with a large project at the Feasibility
stage. Moreover, we discovered that the FS for YMI's Harper Creek copper project
revealed very compelling economics and that YMI was trading at a tiny fraction
of the project's NPV. Of particular interest to us was that the compelling
economics were based on a realistic long-term copper price of $2.50/pound.
Specifically, assuming a copper price of $2.50/pound the Harper Creek project is
estimated to have a pre-tax NPV(8%) of $750M and an IRR of 20.2%.
There are, of course, risks. The biggest risk is that the development plan
involves building a large open-pit mine in British Columbia (BC). It will be
very difficult (to put it mildly) to get a permit to build such a mine. That
being said, Taseko is well versed in the difficulties of mine-permitting in BC
and obviously sees potential in YMI's project.
We don't own any YMI shares and at this stage have no intention of adding this
microcap exploration-stage copper miner to the TSI Stocks List. We are simply
identifying a speculative opportunity that could be of interest to some of our
readers.
Note that the stock price was up 18% on Friday in reaction to the Taseko news
and could drop back to near its recent lows after the Taseko enthusiasm wears
off. Also, the stock is vulnerable to tax-related selling between now and
year-end.
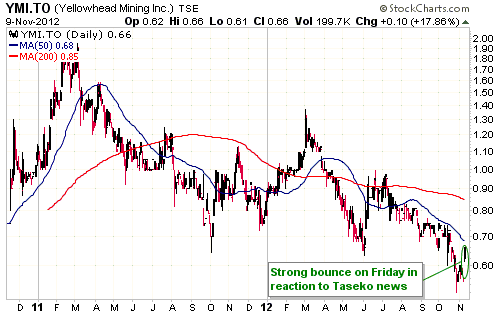
Chart Sources
Charts appearing in today's commentary
are courtesy of:
http://stockcharts.com/index.html

|
