|
-- Weekly Market Update for the Week Commencing 12th December 2011
Big Picture
View
Here is a summary of our big picture
view of the markets. Note that our short-term views may differ from our
big picture view.
In nominal dollar terms, the BULL market in US Treasury Bonds
that began in the early 1980s ended in December of 2008. In real (gold)
terms, bonds commenced a secular BEAR market in 2001 that will continue
until 2014-2020. (Last
update: 4 April 2011)
The stock market, as represented by the S&P500 Index, commenced
a secular BEAR market during the first quarter of 2000, where "secular
bear market" is defined as a long-term downward trend in valuations
(P/E ratios, etc.) and gold-denominated prices. This secular trend will bottom sometime between 2014 and 2020. (Last update: 22 October 2007)
A secular BEAR market in the Dollar
began during the final quarter of 2000 and ended in July of 2008. This
secular bear market will be followed by a multi-year period of range
trading. (Last
update: 09 February 2009)
Gold commenced a
secular bull market relative to all fiat currencies, the CRB Index,
bonds and most stock market indices during 1999-2001. This secular trend will peak sometime between 2014 and 2020. (Last update: 22 October 2007)
Commodities,
as represented by the Continuous Commodity Index (CCI), commenced a
secular BULL market in 2001 in nominal dollar terms. The first major
upward leg in this bull market ended during the first half of 2008, but
a long-term peak won't occur until 2014-2020. In real (gold) terms,
commodities commenced a secular BEAR market in 2001 that will continue
until 2014-2020. (Last
update: 09 February 2009)
Copyright
Reminder
The commentaries that appear at TSI
may not be distributed, in full or in part, without our written permission.
In particular, please note that the posting of extracts from TSI commentaries
at other web sites or providing links to TSI commentaries at other web
sites (for example, at discussion boards) without our written permission
is prohibited.
We reserve the right to immediately
terminate the subscription of any TSI subscriber who distributes the TSI
commentaries without our written permission.
Outlook Summary
Market
|
Short-Term
(0-3 month)
|
Intermediate-Term
(3-12 month)
|
Long-Term
(1-5 Year)
|
| Gold
|
Neutral
(22-Sep-11)
|
Neutral
(24-Jan-11)
|
Bullish
|
| US$ (Dollar Index)
|
Neutral
(22-Nov-11)
| Bullish
(12-Oct-11)
|
Neutral
(19-Sep-07)
|
| Bonds (US T-Bond)
|
Neutral
(19-Sep-11)
|
Bearish
(24-Aug-11)
|
Bearish
|
| Stock Market (S&P500)
|
Neutral
(22-Nov-11)
|
Bearish
(28-Nov-11)
|
Bearish
|
| Gold Stocks
(HUI)
|
Neutral
(28-Nov-11)
|
Bullish
(23-Jun-10)
|
Bullish
|
| Oil | Neutral
(31-Jan-11) | Neutral
(31-Jan-11)
| Bullish
|
| Industrial Metals
(GYX)
| Neutral
(22-Nov-11)
| Neutral
(29-Aug-11)
| Neutral
(11-Jan-10)
|
Notes:
1. In those cases where we have been able to identify the commentary in
which the most recent outlook change occurred we've put the date of the
commentary below the current outlook.
2. "Neutral", in the above table, means that we either don't have a
firm opinion or that we think risk and reward are roughly in balance with respect to the timeframe in question.
3. Long-term views are determined almost completely by fundamentals,
intermediate-term views by giving an approximately equal weighting to
fundamental and technical factors, and short-term views almost
completely by technicals.
The false premises and
promises of Keynesian economics
The 2007-2009 US recession prompted by far the largest fiscal and monetary stimulus programs in US history, and yet the US economy experienced the weakest post-recession recovery in its history. The supporters of Keynesian-style economics could, however, argue that although the stimulus was the biggest ever, it still wasn't big enough. They could also argue that things would be even worse today if the stimulus hadn't happened. They have, in fact, made these arguments, and due to the nature of economics they cannot be proven wrong using empirical data. To be more clear, the data are generally inconsistent with their theories and forecasts, but the data do not constitute positive proof because we have no way of knowing what the situation would be today if the official response to the recession had been different. In particular, we can't go back in time and repeat the experiment using different inputs to see how the outcome would change. The best we can reasonably hope to do is explain that stimulus programs are based on premises that are wrong. If you begin with the wrong premises then there is a very high probability that you will arrive at the wrong conclusions, and, in the case of economics, the wrong policy recommendations.
Keynes got so much wrong that a book could be written on the subject. In fact, Hunter Lewis did write a
book
on the subject. It is therefore difficult to write a short piece that zooms in on just one or two of the false premises underlying Keynesian economics. Difficult, but not impossible, because many of the errors inherent in Keynesianism stem from the idea that economic growth happens due to increased consumer spending. Or, to put it another way, a lot of the errors can be traced back to the idea that consumption precedes production.
When money is taken out of the equation it is clear that an increase in production must precede an increase in consumption. For example, if a baker wants to consume more he must first bake more bread, and if a cobbler wants to increase his consumption he must first make more shoes. In general terms, in a barter economy it is clear that people either spend what they produce (in effect, a baker spends bread and a cobbler spends shoes) or they borrow and spend the excess (saved) production of others.
Now, it should be intuitively obvious that introducing a common medium of exchange (money) does not alter the necessity for production to precede consumption. Money makes it easier for people to trade with each other, but to consume more a baker still has to produce more bread and a cobbler still has to produce more shoes. The only difference is that due to the useful role played by money, a cobbler that wanted bread wouldn't have to find a baker that wanted a new pair of shoes in order for trade to happen.
The above SHOULD be intuitively obvious, and yet if we are to believe the Keynesians then the introduction of money turns the economy back to front. Changes in consumption (aggregate demand) now apparently drive everything. Economic growth now occurs because people start spending more, with the increased spending prompting greater production, and economic contraction occurs when people start spending less.
As far as we can tell, the source of the Keynesian confusion is that the supply of money can change independently of the supply of goods and services. In a barter economy it would be impossible for a sustained increase in spending to precede a sustained increase in production, but in an economy that has a common medium of exchange an increase in the money supply would allow for more spending even if production had not increased.
To explain why an increase in money spending cannot be beneficial to the economy if it is unrelated to a prior increase in production, let's return to the hypothetical example of our baker and cobbler. In the past, the baker always exchanged bread for money and then used that money to purchase shoes from the cobbler, meaning that he paid for his shoes with bread (money's only role was to facilitate the exchange). However, he is now tired of rising at 4.00am every day to bake bread, so he obtains a machine that he can use to print as much money as he wants whenever he wants. The next time he desires a pair of new shoes he simply prints the money he needs and hands the freshly-printed notes to the cobbler. In fact, printing new money is so effortless that he decides to buy three new pairs of shoes instead of the one pair that he would have bought if he still needed to bake bread for a living. Consumption has therefore increased and so has the cobbler's income, but is it really possible that the economy is now stronger due to the baker's decision to become a counterfeiter?
Of course it isn't. The baker has, in effect, stolen the shoes because he has exchanged nothing for something. The difference between this theft and the more straightforward variety is that the initial victim of the crime (the cobbler) probably won't be directly and immediately disadvantaged, because there's a good chance that he will unwittingly have the opportunity of exchanging 'the nothing' (the money printed by the baker) for something. However, somebody, somewhere in the economy, will have to pay. For example, if the counterfeiting baker's increased consumption causes the cobbler to raise his prices then the cobbler's future customers will be amongst those who pay for the crime. Furthermore, the baker's counterfeiting will not be neutral on an economy-wide basis, with the gains of the baker and the cobbler (the initial recipients of the new money) being exactly offset by the losses of others. The reason is that the baker's counterfeiting changes the price signals that direct production within the economy. The overall economy becomes less efficient as a result.
Moving along, the false premise that the economy is driven by changes in consumption leads to many errors in thinking/judgment. As explained above, one of these is the notion that the economy can sometimes be helped by creating money out of nothing (the central bank and the commercial banks routinely create money out of nothing). Unfortunately, surreptitious theft can never be beneficial. We say "unfortunately" because if it really were possible to give the economy a sustainable boost by creating more money then poverty could be eliminated quickly and easily. Another error is the idea that the economy can be helped via an increase in government spending, as if the government has an inventory of stored wealth that it can intelligently invest at the appropriate time and as if every dollar the government spends doesn't have to first be stolen or borrowed from the private sector. Yet another is the idea that thrift is bad for the economy. Thrift, or spending less than you earn, is the foundation of real economic progress, because a sustained increase in per-capita production must stem from investment in the factors of production and this investment only becomes possible through abstaining from current consumption.
We can't include the Keynesian business cycle theory amongst this school's errors, because as far as we can tell there isn't one (a Keynesian business cycle theory, that is). Instead, we are supposed to accept that multi-year swings in the economy are the result of unpredictable changes in mysterious forces known as "animal spirits". If only people would stay happy and keep spending then the economy would power ahead indefinitely, even if much of the spending were wasteful.
When you begin with a false premise you are likely to arrive at a paradox. Not surprisingly, then, Keynesiansim is riddled with paradoxes. One example is the so-called "paradox of thrift", or, to put it in more general terms: what's good for individuals throughout the economy can, paradoxically, be bad for the economy as a whole. If Keynesians understood that saving is the foundation of economic progress they wouldn't arrive at this paradoxical conclusion. Another example is the concept of "depression economics", meaning the idea put forward by some high-profile Keynesian economists that one set of economic laws applies during normal times and a different set applies during depressions. Rather than admit that their pet theory is inconsistent and therefore probably wrong, they twist and turn in a dogged effort to make their theory fit the facts. Why do they do this? One explanation is that they adopt economic theories based on how well these theories mesh with cherished political ideals.
Believing in Keynesian economics is a bit like believing that everything in the universe revolves around the Earth. To enable real-world observations to fit with your theory you have to make unrealistic assumptions and undertake extreme logical contortions.
Eurozone debt crisis
update
The EU/ECB news from late last week wasn't dramatic, and neither was the market reaction to the news. However, there were some important developments, chief among them being the steps that the ECB has promised to take to support eurozone banks.
Not unexpectedly, the EU's political leadership has agreed to closer fiscal ties. To be more specific, the leaders of individual States have accepted that there will, in the future, be more rigid constraints on their respective budgets imposed by an inter-governmental organisation. At this stage they have agreed to draft a new treaty, with the details to be hashed out over the next three months. There were also agreements covering the European Stability Mechanism (ESM) and 200B euros of additional IMF funding (to be used to support financially-stressed eurozone governments). With regard to the former, the establishment of the ESM has been brought forward by one year to July-2012 and its financial resources have been capped at 500B euros. The representatives of most governments apparently wanted the ESM to have a banking licence, giving it the ability to greatly expand its financial capacity via the use of leverage, but Germany was against this idea.
As far as we can tell, the plans mentioned in the above paragraph achieve very little. They won't even buy much time. As mentioned in the first paragraph, however, the ECB has promised actions that do appear to be important.
The ECB cut its targeted interest rate from 1.25% to 1.00%, cut the required reserves of commercial banks from 2% to 1% (that's right, eurozone banks only have to maintain reserves equal to 1% of their deposits), and vowed to keep supporting the bonds of troubled eurozone governments via "sterilised" bond purchases. These are not the actions we specifically referred to as important, although the ECB's regular bond purchases are certainly helping to keep a lid on bond yields. The most important developments were the ECB's decisions to a) provide an UNLIMITED amount of debt financing to eurozone banks for a period of THREE YEARS, and b) accept lower-quality collateral as security for the loans it makes to banks.
The equity markets tanked when the ECB's plans were announced on Thursday, which suggests that the central bank's actions were initially perceived by the markets as not sufficiently inflationary. Maybe a lot of traders were hoping for a Bernanke-like QE and were therefore disappointed.
A Bernanke-like QE was never a realistic hope given the views of Germany's government and the rules that determine what the ECB can and can't do, but the ECB still managed to come up with a policy that could turn out to be very inflationary. In effect, the ECB is offering Europe's banking industry a huge subsidy at the expense of euro savers, because banks will be able to obtain an unlimited quantity of newly-created euros from the ECB at a cost of, say, 1% per year and use this new money to buy (for example) Italian government bonds yielding 6.5%. The extent to which the banks take advantage of this monetary gift is to be seen, but the inflationary risks are clear. Moreover, the way has been paved for large-scale monetisation of eurozone government bonds, with the monetisation being carried out by commercial banks with the support of the ECB rather than directly by the
ECB.
The Stock
Market
The Bloomberg article posted HERE
discusses the huge effect that Europe's debt crisis is having on the US stock market. According to this article:
"Never before has the euro influenced U.S. stocks as much as this year, a sign that American equities arenít going anywhere until Europeís credit crisis is solved.
The link between the Dow Jones Industrial Average and swings in the currency reached a record on Dec. 2, according to data compiled by Bloomberg. The so-called correlation coefficient showing how much two markets rise and fall in tandem hit 0.85, the highest level since the euro was founded in 1999, data on 60-day rolling averages show. A reading of 1 means assets are moving in lockstep."
The tight relationship between the euro and the US stock market is not news to us, but it's nice to be able to put some numbers to it.
The market volatility in response to ECB/EU news during the final two trading days of last week didn't change anything. The S&P500 ended the week just below resistance, having reached some sort of peak early in the week. Support lies about 3% below Friday's closing price -- at around 1220.
By the way, at the end of trading last week the S&P500 was almost dead flat on the year, so the net change over the next three weeks will determine whether 2011 is an up or down year.
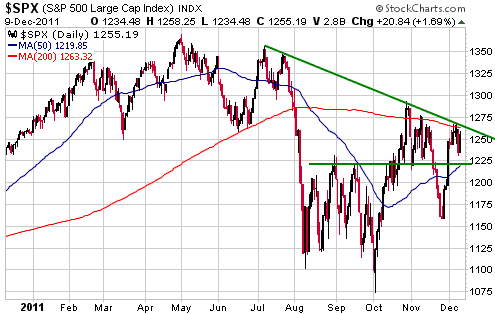
Both of the short-term scenarios mentioned in a previous TSI commentary remain plausible. The more bullish scenario involves the S&P500 consolidating over the next week or so and then surging into January. The less bullish scenario involves the S&P500 breaking above resistance almost immediately and reaching an important peak before Christmas.
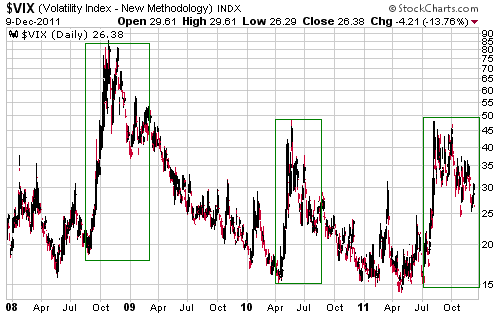
The following chart of the Volatility Index (VIX) paints a moderately bullish picture. In particular, if we compare this year's VIX spike with the ones that occurred in 2008 and 2010 we get the impression that volatility is now in an intermediate-term downward trend that probably won't bottom until the second quarter of 2012. This could mean that even if the market makes an important top within the coming month, the next major decline won't begin until April-May.
This week's
important US economic events
| Date |
Description |
| Monday Dec 12 | Treasury
Budget
| | Tuesday Dec 13 | FOMC
Announcement
Retail Sales
Business Inventories
| | Wednesday Dec 14 | Import
and Export Prices | | Thursday
Dec 15 | PPI
Empire State Manufacturing Survey
TIC Report
Industrial Production
Philadelphia Fed Survey
| | Friday Dec 16 | "Quadruple
Witching"
CPI
|
Gold and
the Dollar
Gold
The following daily charts show gold in US$ terms and euro terms. The patterns are similar, in that gold bullion has recently made sequences of lower highs and higher lows in terms of both the US$ and the euro. Furthermore, in terms of both currencies it has worked itself into a position where a breakout -- in one direction or the other -- will soon have to occur.
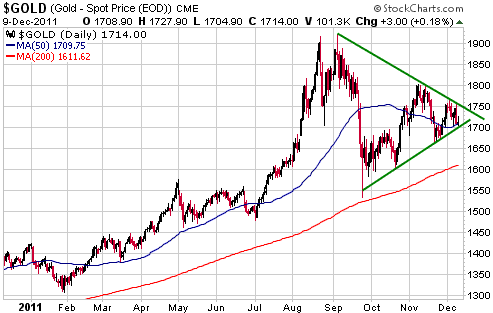
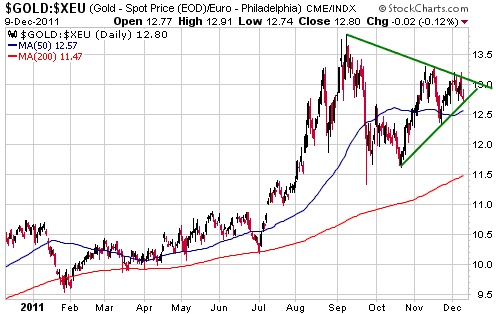
For investors, as opposed to short-term traders, the best buying opportunity would stem from a downside breakout. Specifically, if gold broke out to the downside from its contracting range and if this breakout were followed by declines to the mid-1500s in US$ terms and/or the mid-1100s in euro terms then the downside risk would be reduced to almost nothing.
Buying in reaction to an upside breakout would be riskier, because the breakout could turn out to be false and because gold bullion is expensive relative to most things right now. We expect that it will eventually become much more expensive due to increasingly-widespread concern about the stability of the financial system, but it's always better to buy low than to buy high.
Gold Stocks
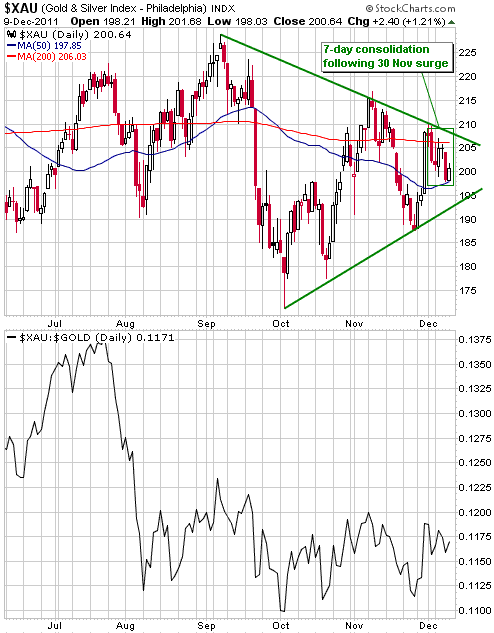
The following daily chart shows that the XAU rocketed upward on 30th November to just below resistance and then spent the ensuing 7 trading days partially retracing its 30th November gain. Consolidations within short-term upward trends typically last 5-8 trading days, so the short-term upward trend has probably either just resumed or will do so during the first half of this week. That's assuming the current pullback is a counter-trend consolidation rather than the start of a new downward leg. There is no guarantee that this assumption is correct, but based on sentiment and the price action it is reasonable.
The resumption of the short-term upward trend would be confirmed by a daily close above 210, whereas a daily close below 190 would indicate that the above-stated assumption is wrong.
The bottom section of the following chart shows that the XAU/gold ratio has moved sideways since early August. It should move to a new 2-month high (above 0.12) if/when the XAU breaks above 210.
Currency Market Update
Since all eyes are on the eurozone and the euro's reaction to the latest moves by Europe's politicians and central bankers, we thought we'd focus on the Canadian Dollar. The C$ peaked along with the stock market in July and then fell with the stock market to a bottom at the beginning of October. Interestingly, its performance over the past several months is similar to its performance in the months following the major stock market peak of October-November 2007. We have attempted to illustrate the similarities on the following chart.
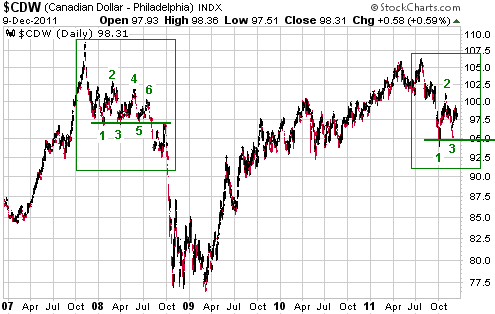
If the similarities continue then the C$ will spend the next 3-5 months chopping back and forth, with the low end of its range defined by support at 95 and the high end of its range defined by resistance at 101. It will then break out to the downside and plunge.
We obviously don't know if the C$ will continue to follow a similar path to the one it followed during 2007-2008. A lot will depend on the timing of the stock market's next major decline. What we do know is that a daily close below 95 would create a lot of downside potential. Furthermore, the longer the C$ consolidates above 95, the greater the downside potential following a break below 95.
Returning to the euro, we continue to believe that the huge speculative net-short position in euro futures creates enough rebound potential to offset the short-term downside risk associated with the debt crisis. The short position doesn't preclude a final news-inspired plunge over the next few weeks, but it means that even if such a plunge eventuated the euro would quickly return to its current level or higher as the 'shorts' took profits.
The next scheduled event of significance is this Tuesday's FOMC Meeting. If the Fed announces some additional inflation-promoting measures at the end of this meeting then the euro could surge along with equities and commodities.
As time goes by the markets are being influenced to an ever-increasing extent by the actions of policy-makers. This is good for speculators and bad for long-term investors.
Update
on Stock Selections
Notes: 1) To review the complete list of current TSI stock selections, logon at
http://www.speculative-investor.com/new/market_logon.asp
and then click on "Stock Selections" in the menu. When at the Stock
Selections page, click on a stock's symbol to bring-up an archive of
our comments on the stock in question. 2) The Small Stock Watch List is
located at http://www.speculative-investor.com/new/smallstockwatch.html
 Pinetree Capital (TSX: PNP). Shares: 137M issued, 158M fully diluted. Recent price: C$1.44 Pinetree Capital (TSX: PNP). Shares: 137M issued, 158M fully diluted. Recent price: C$1.44
PNP holds investments in a substantial number of junior resource companies, which explains why its stock price usually moves in lockstep with the TSX Venture Exchange Index (CDNX). Furthermore, due to the large sentiment-driven variations in its discount to net asset value*, the percentage changes in PNP's stock price tend to be much greater than the associated percentage changes in the CDNX. In other words, PNP trades like a leveraged play on the CDNX. The relationship between PNP and the CDNX is illustrated below.
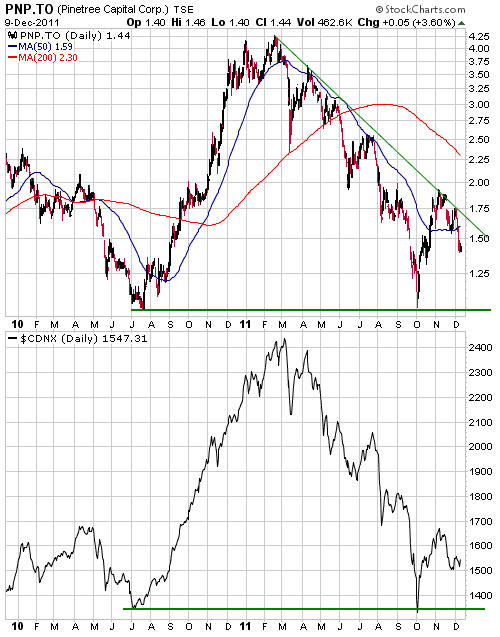
After they bottomed in early October and then rebounded, there was a good chance that both PNP and the CDNX would drop back to test their October lows in response to tax-loss selling. However, full tests of the October lows no longer appear likely.
Any additional weakness related to tax-loss selling should be out of the way by Christmas, so the coming fortnight should be a good time to accumulate junior resource stocks or the stock that performs like a leveraged play on the junior end of the resource sector (PNP, that is).
*We estimate that PNP is presently trading at a discount of around 50% to its net asset value.
Chart Sources
Charts appearing in today's commentary
are courtesy of:
http://stockcharts.com/index.html

|

