![]()
![]()
![]()
![]()
-- Weekly Market Update for the Week Commencing 12th December 2016
Big Picture
View
Here is a summary of our big picture
view of the markets. Note that our short-term views may differ from our
big picture view.
The BULL market in US Treasury Bonds that began in the early 1980s ended in early-2015, but there will be many years of topping action in bond prices and bottoming action in bond yields before major new trends get underway. (Last update: 29 June 2015)
The stock market, as represented by the S&P500 Index, commenced a secular BEAR market during the first quarter of 2000, where "secular bear market" is defined as a long-term downward trend in valuations (P/E ratios, etc.) and gold-denominated prices. This secular trend will bottom sometime between 2018 and 2020. (Last update: 29 June 2015)
A secular BEAR market in the US Dollar began during the final quarter of 2000 and ended in July of 2008. This secular bear market will be followed by a multi-year period of range trading. (Last update: 09 February 2009)
Gold commenced a secular bull market relative to all fiat currencies, the CRB Index, bonds and most stock market indices during 1999-2001. This secular trend will peak sometime between 2018 and 2020. (Last update: 29 June 2015)
Commodities,
as represented by the CRB Index, commenced a
secular BULL market in 2001 in nominal dollar terms. The first major
upward leg in this bull market ended during the first half of 2008, but
a long-term peak won't occur until 2018-2020.
(Last
update: 29 June 2015)
Copyright
Reminder
The commentaries that appear at TSI
may not be distributed, in full or in part, without our written permission.
In particular, please note that the posting of extracts from TSI commentaries
at other web sites or providing links to TSI commentaries at other web
sites (for example, at discussion boards) without our written permission
is prohibited.
We reserve the right to immediately
terminate the subscription of any TSI subscriber who distributes the TSI
commentaries without our written permission.
Outlook Summary
|
Market |
Short-Term (1-3 month) |
Intermediate-Term (6-18 month) |
Long-Term (2-5 Year) |
| Gold | N/A |
Neutral (21-Nov-16) |
Bullish |
| US$ (Dollar Index) | N/A |
Neutral (17-Aug-16) |
Neutral (19-Sep-07) |
| US Treasury Bonds (TLT) | N/A |
Neutral (21-Nov-16) |
Bearish |
| Stock Market (DJW) | N/A |
Neutral (14-Nov-16) |
Bearish |
| Gold Stocks (HUI) | N/A |
Neutral (21-Nov-16) |
Bullish |
| Oil | N/A |
Neutral (26-Oct-15) |
Bullish |
| Industrial Metals (GYX) | N/A |
Neutral (10-Oct-16) | Bullish |
4. Long-term views are determined almost completely by fundamentals and intermediate-term views
are determined by a combination of fundamentals, sentiment and technicals.
Last week's posts at the TSI Blog
The problem is a single central bank, not a single currency
An Australian gold producer sells high and buys low
Summary of current
thinking/positioning
1) Continuing to expect that the
overall corrections/downturns for gold and the associated mining indices
will extend into Q1-2017, but anticipating an intervening rebound. Unsure
if the rebound will get underway this week or be delayed until
early-January.
2) Expecting that 2017 will be a bullish year for
commodities. Maintaining long-term exposure to non-gold commodities while
acknowledging that the early-2016 lows could be tested in Q1-2017 prior to
the start of the aforementioned bullish period.
3) Expecting a
decline in the oil price to a January-February bottom and positioned for
this outcome via USO put options expiring in February. In addition to
being a speculation, these options have been purchased as a hedge against
short-term weakness in commodity-related equities.
4) Thinking that
government bonds have commenced a long-term bear market, but that the US
Treasury Bond is close to a short-term price bottom.
5) Expecting a
6-12 month extension of the equity bull market and looking for
opportunities to add to general non-US equity exposure, but maintaining a
very small short-term bearish speculation via QID (leveraged NDX bear
fund) call options expiring in January-2017.
6) Thinking that the
Dollar Index is close to a 1-2 month top, but that it will move to new
multi-year highs during the first quarter of 2017 and won't reach a major
top before the second quarter of 2017.
7) Maintaining a large cash
reserve in recognition of the short-term downside risk in almost all
equities (current cash percentage is about 40%).
Remembering the
Plaza Accord
The Plaza Accord was an
agreement between the governments of France, West Germany, Japan, the
United States and the United Kingdom to depreciate the US dollar in
relation to the Japanese Yen and German Deutsche Mark. The Accord was
signed on 22nd September, 1985, at the Plaza Hotel in New York City and
had some major effects. As is typically the case with large-scale
financial-market interventions by governments and central banks, some of
the biggest effects were both unintended and harmful.
The Plaza
Accord was a reaction to the strength of the US$ during the first half of
the 1980s, especially during the 2-year period from early-1983 to
early-1985. Rapid strengthening of the dollar relative to other major
currencies made life more difficult for some US-based manufacturers. (As
an aside, it also made life easier for almost everyone else, but most of
the economy isn't represented by high-paid lobbyists.) These manufacturers
banded together to put pressure on the US government to implement
protectionist measures, and coordinated intervention to weaken the dollar
was the settled-upon solution.
The US$ weakened considerably on the
foreign exchange (FX) market during the 2-year period following the
September-1985 signing of the Plaza Accord (PA), so on the surface the
international agreement achieved its intended purpose. However, there is
no way of determining how much of the dollar's weakness was due to the FX
interventions of the PA's signatories and how much was part of a natural
corrective process.
What we do know is that the dollar's relative
value was in a downward trend prior to the PA coming into effect.
Specifically, the following chart shows that when the PA was signed the
Dollar Index had been trending downward for 7 months and had already
fallen by 18% from its peak.
Considering the dollar's trend prior to the signing of the PA it's a
good bet that less than half of the Dollar Index's 1985-1987 decline was
due to the FX interventions stemming from the PA. In other words, it's a
good bet that the bulk of the dollar's decline was due to corrective
market forces stemming from the US currency's over-valuation. However,
regardless of their direct effects on currency exchange rates, the actions
taken by central banks in response to changes in FX rates during the
mid-to-late 1980s had far-reaching consequences.
For example, the
dollar's strength put downward pressure on prices in the US economy, which
prompted loose monetary policy from the Fed. This enabled rapid
money-supply growth (the year-over-year TMS growth rate was continuously
above 10% from mid-1985 to mid-1987 and got as high as 17% in early-1987),
which, in turn, fueled a rapid expansion of credit and a stock-market
bubble that burst in spectacular fashion in October-1987.
Japan
provides us with an even better example. The Yen had begun to strengthen
prior to the Plaza Accord, but, as illustrated below, when the agreed FX
interventions got underway its rate of increase accelerated in dramatic
fashion.
The accelerated strengthening of the Yen beginning in September-1985
led to aggressive monetary easing from Japan's central bank in an effort
to counteract the effect on domestic prices of the rising currency (as is
the case today, central bankers in the 1980s were dumb enough to believe
that falling goods-and-services prices are bad). This resulted in booming
asset markets in Japan, with both the property market and the stock market
soaring to absurd valuation levels (the following chart shows the
performance of the Nikkei225 stock index). Furthermore, the booming asset
markets attracted foreign investment, which reinforced the Yen's upward
trend.
The gigantic boom stemming from the interventions of Japan's
policy-makers during the mid-to-late 1980s naturally transmogrified into a
gigantic bust during the 1990s.
It could be argued that Japan is
still suffering from the effects of the policy errors of the 1980s,
including the policy error known as the Plaza Accord. This argument is not
valid, however, because if Japan's policy-makers had sworn-off their
interventionist ways following the 1985-1989 disaster then the economy
would likely have been positioned for a strong and sustainable recovery by
1993. Instead, they learnt nothing and ramped-up their meddling. In the
process they proved that if Keynesian 'remedies' are applied with
sufficient consistency and vigour in the aftermath of credit bubble, then
a genuine recovery can be postponed indefinitely.
Summing up, in
one important respect the Plaza Accord was similar to all other grand
schemes to manipulate markets and economies. It was the equivalent of a
giant spanner being thrown into the economic works.
Commodities
Oil and Gas
Below are daily price charts of oil, a commodity on which we are
short-term bearish and intermediate-term neutral, and natural gas (NG), a
commodity on which we are short-term neutral* and intermediate-term
bullish.
The oil price has moved up to near the top of its 6-month
range. There remains a bearish divergence between oil and the C$ that
points to a sizable decline in the oil price within the next two months,
but if the oil price breaks out to the upside in the near future (a solid
daily close above $52.50 would do it) then this short-term bearish
potential will be postponed. In this case, there could be a rise to the
vicinity of last year's high in the low-$60s before the start of a
meaningful decline.
If the oil price does manage to break out to
the upside in the near future it will probably be because of a further
increase in the speculative enthusiasm for growth-oriented 'plays'.
The NG price took off like a scared rabbit after successfully testing
support in the $2.50s a few weeks ago. We suspect that a several-week
consolidation will soon begin, but much higher price levels will probably
be reached within the next 6 months.
One reason to anticipate a
much higher NG price within the coming 6 months is the evidence that,
unlike the oil market, the supply situation in the NG market is 'tight'.
We are referring to the spread between different contract months in the NG
futures market, which shows that the market is in backwardation (prices
are higher in the nearer months than in the further-out months).
*We were short-term bullish on NG when its
price was near support in the $2.50s a few weeks ago, but the subsequent
near-vertical rise has significantly increased the risk and reduced the
potential reward.
Commodity-Related Equities
Non-gold commodity
stocks have done very well of late, with even the uranium-mining stocks
catching a bid over the past fortnight. Charts showing two examples from
the TSI Stocks List (a copper producer and a natural gas producer) are
displayed below.
If we are looking at a 6-12 month extension of the general equity bull
market, which seems likely, then non-gold commodity stocks should continue
to be strong for another 6-12 months. However, on a short-term basis the
risk is becoming uncomfortably high due to the impetuousness of some of
the recent buying.
Evidence of the impetuous buying is in the
performance of Northern Dynasty (NAK), a miner with a massive undeveloped
copper project in Alaska. This project will never get developed into a
mine and therefore offers no leverage to copper, but it is being promoted
and bought as if it offered huge leverage.
Evidence of the impetuous nature of the buying is also in the
infrastructure-spending story that is being touted to justify the rising
prices. The story that Trump's infrastructure spending plans will result
in large increases in the consumption of metals is nonsense. First, due to
budgetary constraints it's unlikely that these plans will ever come to
fruition. Second, even if the plans do come to fruition they won't make a
significant difference to the global consumption of metals such as copper.
Now, it's perfectly fine to profit from uninformed buying (profiting
from uninformed buying and uninformed selling is how we make a living),
but in such cases it's important to understand that the price gains you
are profiting from will ultimately prove to be unsustainable. The best way
to manage the risk while not taking too much money off the table too
quickly is to gradually scale out of positions when prices are rising
along steep trajectories. Positions can then be rebuilt during the ensuing
steep corrections if it is appropriate to do so based on longer-term
considerations.
We've left our industrial-commodity exposure
roughly unchanged in response to the recent price run-ups, with
profit-taking in some stocks mostly offset by purchases of other stocks.
However, it's likely that we will reduce our exposure if prices continue
to rise over the coming few weeks.
We are also open to making new
purchases if the right opportunities present themselves. For example, we'd
be buyers of Sprott Resource Corp. (SCP.TO) or Adriana Resources (ADI.V)
shares if we didn't already have sufficient exposure to this pair of
merging natural-resource companies, and we are looking for an opportunity
to add to our position in mid-tier copper producer Oz Minerals (OZL.AX).
The T-Bond is stretched
to the downside, but will make new lows next year
The following weekly chart shows
that the US T-Bond price has just dropped to its 200-week MA (the red line
on the chart) and that the T-Bond's weekly RSI (shown at the bottom of the
chart) is as low as it has been at any time over the past 15 years.
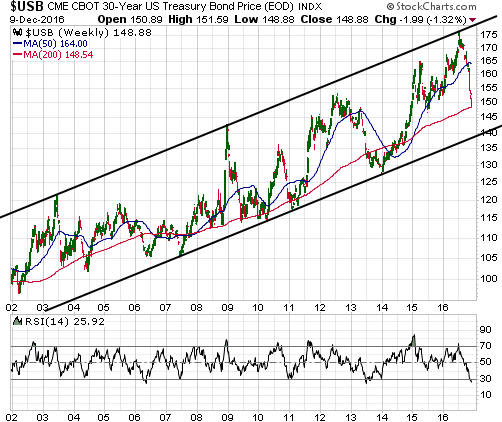
Our expectation has been, and still is, that the overall downward
trend will extend at least as far as the channel bottom near 140,
regardless of whether we are dealing with a new bear market or a
bull-market correction. However, the magnitude of the short-term decline
has exceeded our expectations.
With the decline having gone as far
as the 200-week MA without a significant counter-trend move, the
historical record now suggests two possible short-term paths. One is that
a multi-week and possibly even a multi-month rebound will get underway
this week as part of a "sell the rumour buy the news" reaction to the
Fed's announcement of a rate hike on Wednesday 14th December. The other is
that the price will continue to slide for a few more weeks, perhaps
bottoming (on a short-term basis) during the first half of January at
around 145.
The Stock Market
The US
The fundamental reason for last week's
stock-market strength
There doesn't have to be a fundamental
explanation for a single week's rise or fall in the stock market, as most
weekly fluctuations result from changes in sentiment. However, one
particular 'fundamental' stood out last week and possibly explains why an
upward trend that was looking tired suddenly became energetic.
The
explanation revolves around the US government's account at the Fed, called
the US Treasury General Account. When money goes into this account (due to
tax receipts and borrowing), the money is temporarily removed from the
economy. The money is then returned to the economy when it is spent by the
government.
As discussed in two blog posts (HERE
and
HERE) over the past few months and in the 17th October Weekly Update,
the government has been holding an unusually-large amount of money in its
Fed account and therefore causing monetary conditions to be a little
tighter than would otherwise be the case. Specifically, from November of
2015 through to November of this year the US government effectively
removed almost $400B from the US economy.
During the week ending
Wednesday 7th December they 'returned' $66B to the economy. It's possible
that this sudden monetary injection had a positive effect on the stock
market.
Current Market Situation
With everything that has happened it is remarkable that the NASDAQ100
Index (NDX) has still not broken above its September-October highs.
However, it would be 'grasping at straws' to view the NDX's inability to
confirm the new 2016 highs achieved by almost all other important US stock
indices as anything more than a short-term issue.
Of greater significance is the recent quick rise by the NYSE Composite
Index (NYA) to slightly below its 2015 all-time high. Refer to the top
section of the following chart for details. There's a chance that this
will turn out to be a long-term 'double top' for the NYA, but the
probability of such an outcome is low. There's a much higher probability
that the NYA's overall upward trend will extend well into next year,
although there is likely to be a sizable correction within the next two
months and if the correction begins within the next three weeks it could
create the false impression that a long-term double top has occurred.
The bottom section of the following chart illustrates the main reason
that the NYA's overall upward trend will probably extend well into next
year. It shows that the number of individual NYSE common stocks making new
52-week highs reached its highest level since Q2-2010 last Thursday. Even
more impressively, a greater number of NASDAQ stocks made new 52-week
highs last Thursday than on any other day over the past 20 years.
The implication is that the current rally in the US stock market is
extremely broad.
Broad stock-market rallies do not end in long-term tops or even
intermediate-term tops. Instead, long-term and intermediate-term tops are
generally (we'd say always, but there may be an exception or two somewhere
in the historical record) preceded by at least a few months during which
the rally becomes narrower, that is, at least a few months during which
the senior indices remain in a rising trend while the number of individual
stocks making new highs is in a falling trend. Examples that can be seen
on the above chart are the months leading up to the 2007, 2011 and 2015
peaks.
Broad stock-market rallies can, however, be interrupted by
steep short-term corrections. For example, the only time over the past 10
years when the number of NYSE common stocks making new 52-week highs was
greater than it was last Thursday was about a week before the beginning of
a steep correction in April-2010.
We expect that a steep short-term
correction will begin by early-January. We also expect that if the stock
market's overall upward trend continues for another 6-12 months, as seems
likely, then non-gold commodity stocks will be leaders to the upside.
Europe
Just a quick note to point out that the
EURO STOXX50 Index (STOX5E), the European equivalent of the Dow
Industrials Index, completed a major basing pattern -- composed of a
double bottom during February and June -- last week by closing above its
April high. We expected this to happen, but we were uncertain as to when
it would happen.
This week's
significant US economic events
[Notes:
1) The most important events
(to the markets) are shown
in bold. 2) A list of global economic events can be found
HERE]
| Date | Description |
| Monday December 12 | Treasury Budget |
| Tuesday December 13 | Import and Export Prices |
| Wednesday December 14 |
PPI Retail Sales Industrial Production FOMC Announcement Business Inventories |
| Thursday December 15 |
CPI TIC Report Housing Market Index |
| Friday December 16 |
Housing Starts "Quadruple Witching" |
Gold and the Dollar