|
-- Weekly Market Update for the Week Commencing
13th January 2014
Big Picture
View
Here is a summary of our big picture
view of the markets. Note that our short-term views may differ from our
big picture view.
In nominal dollar terms, the BULL market in US Treasury Bonds
that began in the early 1980s will end by 2013. In real (gold)
terms, bonds commenced a secular BEAR market in 2001 that will continue
until 2014-2020. (Last
update: 23 January 2012)
The stock market, as represented by the S&P500 Index,
commenced
a secular BEAR market during the first quarter of 2000, where "secular
bear market" is defined as a long-term downward trend in valuations
(P/E ratios, etc.) and gold-denominated prices. This secular trend will bottom sometime between 2014 and 2020.
(Last update: 22 October 2007)
A secular BEAR market in the Dollar
began during the final quarter of 2000 and ended in July of 2008. This
secular bear market will be followed by a multi-year period of range
trading.
(Last
update: 09 February 2009)
Gold commenced a
secular bull market relative to all fiat currencies, the CRB Index,
bonds and most stock market indices during 1999-2001.
This secular trend will peak sometime between 2014 and 2020.
(Last update: 22 October 2007)
Commodities,
as represented by the Continuous Commodity Index (CCI), commenced a
secular BULL market in 2001 in nominal dollar terms. The first major
upward leg in this bull market ended during the first half of 2008, but
a long-term peak won't occur until 2014-2020. In real (gold) terms,
commodities commenced a secular BEAR market in 2001 that will continue
until 2014-2020.
(Last
update: 09 February 2009)
Copyright
Reminder
The commentaries that appear at TSI
may not be distributed, in full or in part, without our written permission.
In particular, please note that the posting of extracts from TSI commentaries
at other web sites or providing links to TSI commentaries at other web
sites (for example, at discussion boards) without our written permission
is prohibited.
We reserve the right to immediately
terminate the subscription of any TSI subscriber who distributes the TSI
commentaries without our written permission.
Outlook Summary
Market
|
Short-Term
(1-3 month)
|
Intermediate-Term
(6-12 month)
|
Long-Term
(2-5 Year)
|
|
Gold
|
Bullish
(13-Jan-14) |
Bullish
(26-Mar-12) |
Bullish
|
|
US$ (Dollar Index)
|
Neutral
(13-Jan-14) |
Neutral
(18-Sep-13) |
Neutral
(19-Sep-07) |
|
Bonds (US T-Bond)
|
Bullish
(11-Dec-13)
|
Neutral
(18-Jan-12)
|
Bearish |
|
Stock Market
(DJW)
|
Bearish
(13-Jan-14)
|
Bearish
(28-Nov-11) |
Bearish
|
|
Gold Stocks
(HUI)
|
Bullish
(13-Jan-14) |
Bullish
(23-Jun-10) |
Bullish
|
|
Oil |
Neutral
(30-Jul-12) |
Neutral
(31-Jan-11) |
Bullish
|
|
Industrial Metals
(GYX)
|
Neutral
(24-Dec-13) |
Neutral
(06-Jan-14) |
Neutral
(11-Jan-10) |
Notes:
1. In those cases where we have been able to identify the commentary in
which the most recent outlook change occurred we've put the date of the
commentary below the current outlook.
2. "Neutral", in the above table, means that we either don't have a
firm opinion or that we think risk and reward are roughly in balance with respect to the timeframe in question.
3. Long-term views are determined almost completely by fundamentals,
intermediate-term views by
fundamentals, sentiment and technicals, and short-term views by sentiment and
technicals.
Employment and Investment
The monthly US employment report published last
Friday showed much weaker-than-expected jobs growth. Although this prompted some
moves in market prices, it doesn't tell us anything about how the US economy is
currently performing and, more importantly, it doesn't tell us anything about
how the US economy is likely to perform in the future. The reason is that
employment is very much a lagging indicator. In fact, employment never turns
lower until after coincident indicators confirm that a recession has begun.
Since a recession hasn't yet begun, there will almost certainly be some
improvement in the jobs data over the next few months.
Most investors are aware that the monthly change in the number of jobs is not a
useful economic indicator, but market participants pay a lot of attention to the
jobs number because the Fed's monetary policy is influenced by this number. It's
strange that the Fed pays so much attention to a lagging indicator when
determining policy, but, then again, the entire concept of a central bank is
nonsensical.
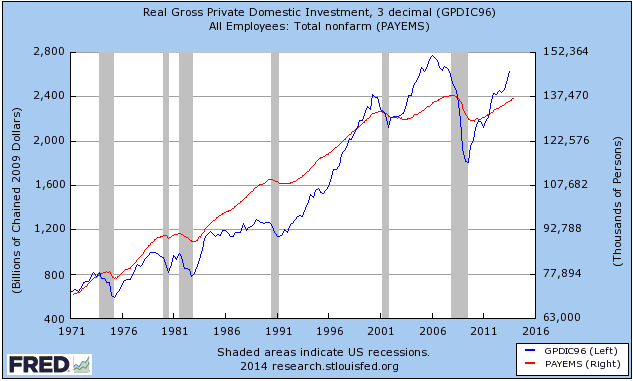
The following chart compares total non-farm US employment (the red line), a
lagging economic indicator, with gross real private sector investment (the blue
line), the most reliable leading US economic indicator we know of. The shaded
areas are the official recessions. Whereas employment never turns downward until
after a recession gets underway, recessions never get underway until after gross
real private sector investment makes a decisive turn to the downside. Investment
made a new high for the move last month, so it's a good bet that the start of
the next US recession is still at least several months away.
The Stock
Market
Most stock indices drifted sideways over the
first several trading days of the year and nothing overtly bearish has happened.
However, we have downgraded our short-term outlook to bearish, because:
1) The senior US and European stock indices are 'overbought'.
2) The positive seasonal force (the Xmas-NY seasonal tailwind) has come to an
end.
3) Sentiment is extremely optimistic.
Note that we are making a conscious effort to change our short-term market views
on all the major financial markets more quickly in response to changes in price
action, momentum and other short-term indicators. This should prevent us from
staying 'off side' for long when the market begins to trend counter to our
expectations, but it will also cause us to be 'whipsawed' more often.
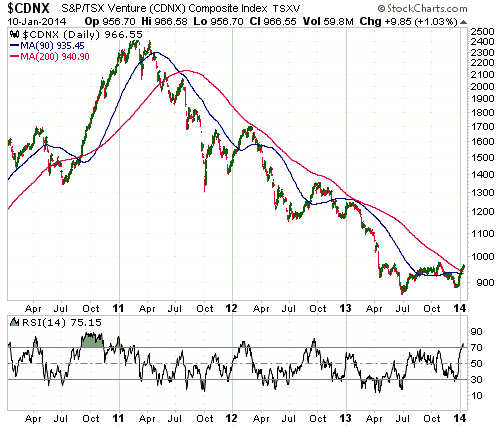
The TSX Venture Exchange Composite Index (CDNX) is one equity index that has
separated from the pack and made a significant move since the beginning of the
year. The CDNX's rebound doesn't yet look like much, but this is the first
rebound since H1-2011 that has taken the index above its 200-day MA (the red
line on the following chart). This is a bullish omen for small-cap Canadian
resource stocks. It is evidence that an intermediate-term upward trend has
begun.
If the CDNX has commenced an intermediate-term advance then corrections from now
on should hold above the 90-day MA (the blue line on the following chart).
This week's
important US economic events
| Date |
Description |
| Monday Jan 13 |
Treasury Budget | | Tuesday
Jan 14 |
Retail Sales
Import and Export Prices
Business Inventories | | Wednesday
Jan 15 |
PPI
Empire State Mfg Survey
Beige Book | | Thursday
Jan 16 |
CPI
TIC Report
Philadelphia Fed Survey
Housing Market Index
|
| Friday Jan 17 |
Housing Starts
Industrial Production
Consumer Sentiment |
Gold and
the Dollar
Gold
Gold Market Manipulation
Based on emails received from our readers we get the impression that our views
on market manipulation in general and gold market manipulation in particular are
not well understood. This is undoubtedly due to insufficient explanation on our
part, a failing that we now hope to address by outlining our views on the topic
in point form. Here we go:
1) For the purposes of this discussion, market manipulation means buying or
selling with the express purpose of causing the market price to move in the
desired direction.
2) All the financial markets are manipulated, including the gold market. This
has always been the case and always will be the case.
3) In all the major financial markets, prices are routinely manipulated in both
directions. By extension, there is no market in which the manipulation occurs in
a single direction.
4) There is no grand gold-price-suppression scheme involving central banks and
private banks. Most present-day central bankers don't care about the gold price,
and private banks are just as happy to make money being long during a gold price
uptrend as being short during a gold price downtrend. Also, most bullion-banking
business involves acting as an intermediary that makes money regardless of price
direction.
5) Nobody posting gold-related comments and articles on the internet knows the
total gold-market positioning of major banks such as JP Morgan.
6) Central bankers did care about the gold price during the 1960s and 1970s,
because at that time gold was either the official anchor of the global monetary
system or in the process of being demonetised.
For several years leading up to the 1971 severing of the official link between
the US$ and gold there was an effort to maintain the belief that the link would
remain, despite the US$ inflation of the period. This involved 'stabilising' the
gold market. After the link was eventually broken, policy-makers naturally
attempted to engender belief in the new floating-rate monetary system. Given
that most people at that time still viewed gold as a monetary anchor, this
attempt involved actions designed to marginalise gold and/or suppress the gold
price (which, by the way, failed in spectacular fashion).
Today, gold is generally viewed as a non-monetary commodity or a trading vehicle
or a portfolio diversifier or a store of value. It is not generally viewed as
money or as an important component of the monetary system. It is therefore
nonsense to cite examples of the gold market machinations of the 1960s-1970s as
evidence that central banks are currently going to great pains to suppress the
gold price.
7) None of the above is essential to our view that direct manipulation (buying
or selling with the goal of creating a 'false' price) can generally be ignored
when analysing the gold market. So, please don't email us with arguments to the
effect that central bankers still care greatly about the gold price or that
private banks have an incentive to prevent a large rise in the gold price. It
isn't relevant, because there isn't any evidence that gold performed worse over
the past 15 years than it should have done based on the
economic/financial-market backdrop along the way.
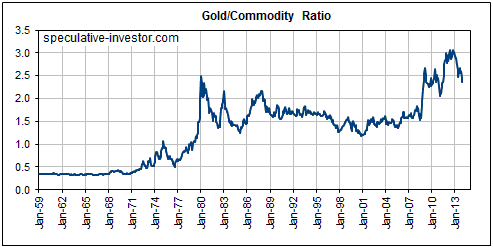
To support the above statement we cite the fact that during 2011-2012 the gold
price hit a 50-year high (and possibly an all-time high) relative to commodities
in general. Refer to the following long-term monthly chart of the gold/commodity
(gold/CCI) ratio for details. In other words, when gold was peaking in 2011-2012
it was not only at its highest level in history in terms of totally non-scarce
fiat currency, it was also at a multi-generational extreme relative to scarce,
valuable resources. Just how much more expensive should it have become, given
that at no time during the decade-long run-up to the 2011-2012 peak was there a
major outbreak of inflation fear?
Perhaps someone will argue that after trying and failing dismally to suppress
the gold price for many years, the 'banking cartel' finally figured out how to
do it in 2013.
However, a much better argument begins with the recognition that under the
current monetary system gold is a boom/bust asset whose value -- to use the
words of Jim Grant -- can best be understood as the reciprocal of confidence in
the senior central banks. Consequently, gold tends to be in bust mode during
economic booms and in boom mode during economic busts. That's why gold did very
well relative to most commodities during the global economic busts of 2001-2002
and 2008-2009, and why gold did very well during the euro-zone bust of
2010-2012. It's also why gold has done poorly relative to most commodities since
October of 2012. Since October of 2012 there has been superficial economic
stability and a growing belief that the senior central banks have everything
under control.
8) The lack of evidence that manipulation caused the gold price to perform worse
than it should have done over normal investment timeframes is no doubt why
manipulation-centric web sites and newsletters focus on extremely short
timeframes (often less than one day and sometimes only a few minutes).
9) Last Monday (6th January) there was a good example of the type of price
action that always has the manipulation-fixated gold commentators up in arms.
Gold suddenly dropped $25 at one point during the 6th January trading day, but
only traders who watch the market tick-by-tick in an effort to scalp a few
points here and there would have been affected. This is because the price ended
the day roughly where it began.
10) There is nothing wrong with manipulation of financial markets by private
participants in the markets (governments should never be involved). From an
ethical perspective, buying with the aim of boosting the price is no better or
worse than buying due to a belief that the market is under-valued or buying due
to a technical consideration such as the breaching of a resistance level.
Similarly, selling with the aim of depressing the price is ethically no better
or worse than selling due to a belief that the market is over-valued or selling
due to a technical consideration such as the breaching of a support level. The
bottom line is that one person's motive for buying/selling is not the business
of anyone else. We realise that governments say otherwise, but governments are
usually not models of ethical correctness.
11) High Frequency Trading (HFT) is not manipulation and, unless you consider a
small fraction of a percent to be significant, is unlikely to have a significant
effect on the prices at which you buy or sell.
12) Of all the above points, number 7 is the only one that really matters. As
far as we can tell, gold has done what it should have done over the past 15
years based on what was happening at the time in the major economies and
financial markets. Of particular relevance, it reached an all-time high relative
to other hard assets in response to the 2008-2009 plunge in global economic
confidence and the 2010-2012 fears that Europe's monetary union was about to
unravel. We under-estimated the extent to which economic and banking-system
confidence would be restored, but the central banks have only succeeded in
fueling another unstable boom that will probably turn to bust this year.
13) Direct manipulation of the gold market is not important. Indirect
manipulation of all the markets via interest rates, money supply and economic
statistics is very important.
Current Market Situation
Today we'll revisit gold's performance in euro terms.
As is the case with the US$ gold price, the euro-denominated gold price
(gold/euro) hasn't quite done enough up until now to confirm that a bottom is in
place. As illustrated below, gold/euro ended last week at a confluence of
resistance defined by two trend-lines and the 50-day MA.
Any significant additional price gain would clearly signal that a bottom was in
place, but at this stage there is nothing in gold/euro's price action to
differentiate the rebound of the past 2 weeks from the 2-3 week rebound that
occurred in October.
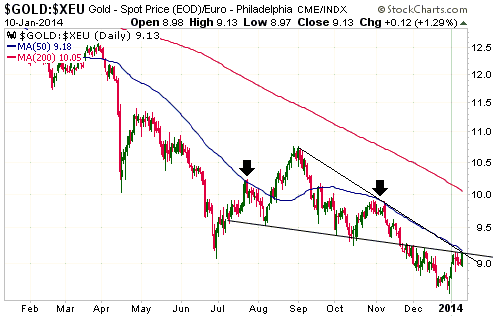
When gold/euro is in an intermediate-term upward trend it usually finds support
at its 50-day MA, so definitive evidence that a sustainable price bottom is in
place would take the form of a rally to well above the 50-day MA followed by a
pullback to the vicinity of this MA followed by a rally to a new high for the
move. However, this evidence would obviously appear with the price at a much
higher level.
From our point of view, breaching the resistance shown on the above chart would
be evidence enough.
A new 17-year high for the COMEX silver stockpile
The amount of silver in COMEX warehouses recently hit its highest level since
1997. Refer to the following Sharelynx.com
chart for details. Is the unusually high supply of silver in COMEX warehouses
bearish for silver?
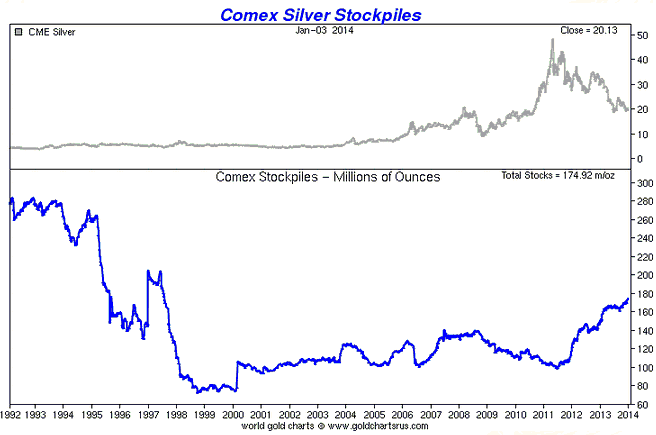
The answer to the above question is the same as the answer to the question: Is
the unusually low supply of gold in COMEX warehouses bullish for gold? In both
cases the answer is no. For both gold and silver, the level of the COMEX
inventory provides no useful information about the likely future price
performance.
To be consistent, however, the commentators who have cited the dwindling COMEX
gold inventory as a reason to be bullish on gold should cite the relatively high
silver inventory as a reason to be bearish on silver. They don't, of course.
Gold Stocks
2014 Forecast for the Gold Mining Sector
The assumption that underlies our 2014 forecast for the gold mining sector is
that the cyclical bear market has either ended or will end following a quick
spike to a new low in the near future. This is a big assumption, but it's a
reasonable one considering that the 2011-2013 decline was a) equal in magnitude
to the largest decline and longer than the longest decline of the 1960s-1970s
secular bull market, and b) almost equal in magnitude to and a lot longer than
the first major decline of the 1980-2000 secular bear market. Also of
importance, the Fed has been busily laying the groundwork for another
devastating economic bust that will no doubt be met by another flood of new
money.
With this assumption as our premise, for a clue as to what we can realistically
expect from the gold-mining sector over the year ahead we'll take a look at
weekly charts showing what happened following the three cyclical gold-stock bear
markets of the past 50 years that have the most in common with the 2011-2013
bear market.
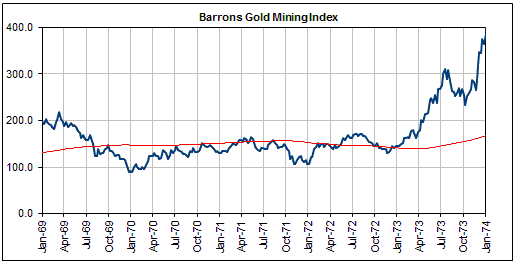
Our first chart shows the final 12 months of the 1968-1970 cyclical bear market
and the ensuing 4 years, using the Barrons Gold Mining Index (BGMI) as the
sector proxy. The red line on the chart is the 200-week MA.
Notice that the BGMI rebounded by about 50% to its 200-week MA during the first
6 months of its new bull market, but that after this initial surge it
essentially traded sideways for more than two years before commencing a huge
rally. In fact, a huge rally didn't get underway until about 3 years after the
bear-market bottom.
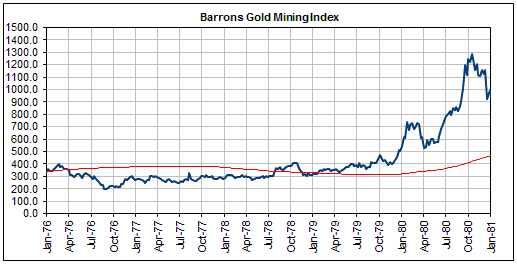
Our second chart shows the final 8 months of the 1974-1976 cyclical bear market
and the ensuing 4-and-a-bit years, again using the BGMI as the sector proxy.
In this case there was also a 50% surge within the first 6 months of the new
bull market, but due to having experienced a steeper decline it took the BGMI
about 2 years to return to its 200-week MA. Furthermore, as was the case during
the first half of the 1970s a huge rally didn't get underway until about 3 years
after the bear-market bottom.
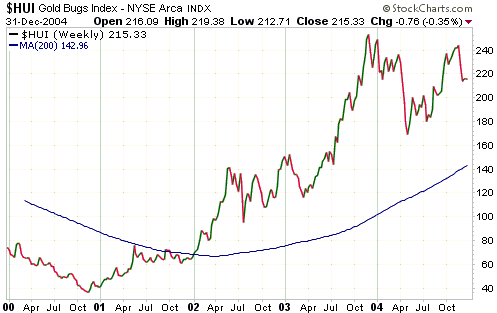
Our third chart shows the final year of the late-1990s cyclical bear market and
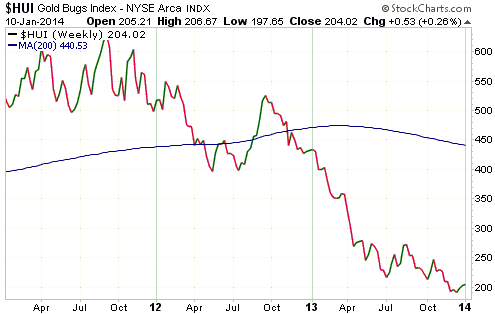
the ensuing 4 years, this time using the HUI as the sector proxy. The blue line
on the chart is the 200-week MA.
In this case the initial rebound was stronger (100% instead of 50%), but the
overall pattern during the first 12 months of the new bull market was similar.
Specifically, there was a rally lasting about 6 months followed by 6 months of
sideways trading. Note: The cyclical bull market that began in 2000 was
considerably stronger during its first few years than the cyclical bull markets
that began in 1970 and 1976, probably because it was the first cyclical bull
market in a new secular bull market.
With regard to the gold sector's performance during 2014, the message from the
historical record is that there will probably be a strong first half and a
choppy second half. The message about the longer-term outlook is that it could
be three years (early-2017) before the market takes off to the upside, but there
is no point looking that far ahead.
With regard to price targets, the historical cases discussed above suggest that
the HUI will trade at least 50% above its bear-market bottom at some point
during the year (most likely before mid-year). Also, in two of the cases the
upside during the first year of the bull market was limited by the 200-week MA
and in the other case the price high during the first year was well below the
200-week MA. This suggests to us that the 200-week MA could reasonably be viewed
as defining the MAXIMUM upside potential for the HUI during 2014. As illustrated
by the following weekly chart, the 200-week MA is presently at 440 and trending
downward.
Further to the above, our guess is that the HUI's 2014 high will be at least 300
and could be as much as 400.
Current Market Situation
The HUI hasn't yet closed above resistance at 207 and therefore hasn't yet
generated a preliminary signal that an important bottom is in place. However, we
are 'jumping the gun' and shifting our short-term gold-stock outlook to
"bullish". Our reasons are:
1. Substantial short-term upside will be in store IF the bear market has just
ended.
2. The charts of many individual gold stocks appear to be turning positive.
3. The bullish momentum divergence that we mentioned in previous commentaries
has persisted.
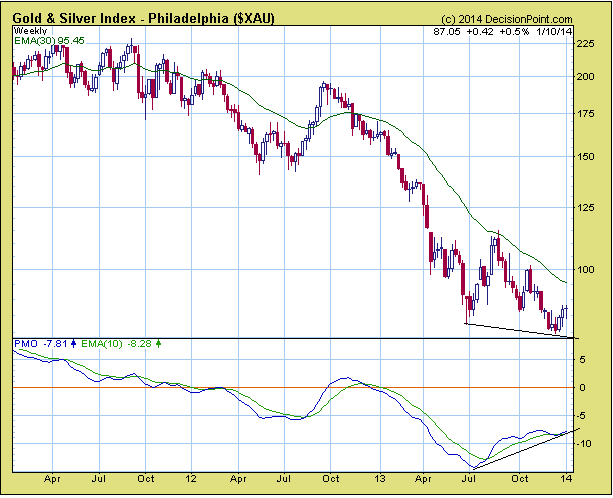
The bullish momentum divergence referred to in point 3 is illustrated by the
following weekly XAU chart from Decisionpoint.com. The chart shows that even
though price trended lower from its August rebound peak and made a new low in
December, Decisionpoint.com's Price Momentum Oscillator (PMO) continued to trend
upward.
The shift to "bullish" in our short-term gold-stock outlook prompts a similar
shift in our short-term gold bullion outlook.
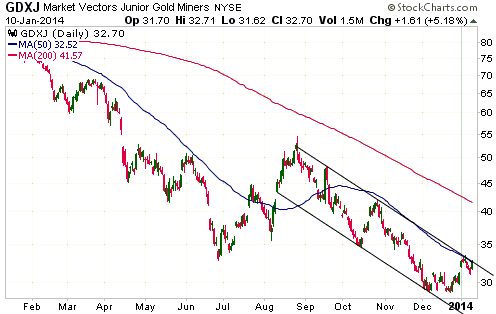
Like the US$ gold price, the euro gold price, the HUI and the XAU, the Junior
Gold Miners ETF (GDXJ) is very close to confirming an upward trend reversal. A
daily close above $33.40 (the high of the past fortnight) would do it.
Currency Market Update
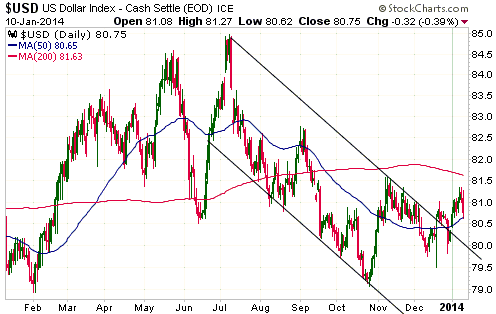
We have shifted our short-term Dollar Index outlook back to "neutral" (from
"bullish"). This has nothing to do with last Friday's employment news or the
pullback to the 50-day MA. It is partly to do with the performance of European
equities discussed in last week's Interim Update, partly to do with the
improving price action in gold-related investments, and partly to do with the
fact that sentiment and momentum are neutral.
Our guess is that the Dollar Index will remain within its 79.5-81.5 range for at
least another month.
Update
on Stock Selections
Notes: 1) To review the complete list of current TSI stock selections, logon at
http://www.speculative-investor.com/new/market_logon.asp
and then click on "Stock Selections" in the menu. When at the Stock
Selections page, click on a stock's symbol to bring-up an archive of
our comments on the stock in question. 2) The Small Stock Watch List is
located at http://www.speculative-investor.com/new/smallstockwatch.html
 Company
news/developments for the week ended Friday 10th January 2014: Company
news/developments for the week ended Friday 10th January 2014:
[Note: AISC = All-In Sustaining Cost, FS = Feasibility Study, IRR =
Internal Rate of Return, MD&A = Management Discussion and Analysis,
M&I = Measured and Indicated, NAV = Net Asset Value, NPV(X%) = Net
Present Value using a discount rate of X%, P&P = Proven and
Probable, PEA = Preliminary Economic Assessment, PFS =
Pre-Feasibility Study]
*Golden Star Resources (GSS) issued a press release to report its
Q4-2013 production and its production guidance for 2014.
GSS produced 75K ounces of gold in the final quarter of last year
from its two operating mines in Ghana (the Wassa and Bogoso
operations). This brought the total year's production up to 331K
ounces, which was in line with the latest guidance and a good result
considering the operational problems encountered at Bogoso during
the second quarter.
Last year's cash cost was around $1100/oz, which implies a total
production cost of at least $1400/oz and explains why GSS continues
to be cash-flow negative at the current gold price. The amount of
cash consumed by GSS during the final quarter of last year won't be
known until the company releases its financial statements on 20th
February, but we estimate that its financial position deteriorated
by about $10M during the quarter. It still has a healthy cash
reserve, but it will need a meaningful recovery in the gold price
within the next few quarters.
2014 guidance is for reduced production at a lower cost, meaning
that the company's management is opting for quality over quantity.
Specifically, the company expects to produce about 300K ounces of
gold at a cash cost of around $1,000/oz. This means that if the
guidance is achieved, the gold price will have to average $1,350/oz
or more for GSS to be genuinely profitable. An average gold price of
at least $1,350/oz is likely (our guess is that gold will average
about $1,500/oz during 2014).
Due to its substantial leverage to changes in the gold price and the
fact that its survival is not in question at this time, GSS could
become an excellent candidate for new buying AFTER the gold price
breaks above $1,300/oz. In the mean time we would favour gold
producers with lower risk, such as RIOM, EDV.TO and EVN.AX.
*Pilot Gold (PLG.TO) reported a set of drilling results from the
oxide-gold K2 Target at its TV Tower project (Turkey). To recap, at
this stage TV Tower is known to host a deep and relatively
high-grade gold-silver-copper zone at the KCD Target, a near-surface
zone of silver-only mineralization that partially overlies the
high-grade gold-silver-copper zone at the KCD Target, and the
shallow oxide-gold K2 Target located approximately eight kms south
of KCD.
Highlights from the K2 drilling results reported last week were 2.00
g/t Au over 35.0 m in one hole and 3.42 g/t Au over 17.4 m in
another hole. Considering that these results came from shallow
oxidised mineralisation, they are good. However, it's too soon to
know if they are financially significant for PLG.
There should be a steady stream of drilling news from PLG over the
months ahead. Also, an initial resource estimate for KCD should soon
be complete.
*Premier Gold (PG.TO) issued a press release that updated the
market on the status of its three exploration-stage gold projects,
two of which (Trans-Canada and Rahill-Bonanza) are located in
Ontario and one of which (Cove) is located in Nevada. According to
this press release there will be a steady stream of news from PG
during the first half of 2014, including drilling results from all
three projects and a PEA for the open-pit portion of the
Trans-Canada project's 7M-ounce Hardrock deposit.
*Rio Alto (RIOM) announced that Peru's government has approved
modifications to the existing environmental impact study for the La
Arena oxide gold mine. This allows RIOM to apply for permits for a
future (Phase 2) open pit sulphide copper/gold mine and construct an
18,000-tonne-per-day copper/gold flotation plant and concentrator.
The FS for the Phase 2 copper/gold sulphide project is currently
scheduled for completion in second quarter 2014.
The Phase 2 project provides RIOM with long-term organic growth
potential and long-term exposure to copper. Although we are
currently not bullish on copper's prospects, we expect that this
base metal will have commenced a new cyclical bull market by the
time that RIOM's Phase 2 development goes into production. Over the
next two years RIOM will be 100% focused on low-cost gold
production, which is exactly what we want.
List
of candidates for new buying
From within the ranks of TSI stock selections, below is a list of the best
candidates for new buying at this time.
1) AKG (last Friday's closing price: US$1.67). Assuming that the merger with PMI
Gold happens as presently proposed, buyers of AKG shares near the current price
are effectively getting two ready-for-construction 200K-oz/yr Ghana-based gold
projects for nothing.
2) EDV.TO/EVR.AX (last Friday's closing price: C$0.55).
3) EVN.AX (last Friday's closing price: A$0.59).
4) PLG.TO (last Friday's closing price: C$0.94).
5) RIO.TO/RIOM (last Friday's closing price: C$1.84/US$1.68) following a
pullback to the vicinity of the 50-day MA.
New
short-term trades
The safest -- and probably the best for most people -- way to 'play' the
short-term upside potential in the gold sector and the recovery in small-cap
resource stocks is to purchase GDXJ and place an initial stop just below the low
of the past two weeks. However, for the TSI List we are adding short-term
trading positions in two higher-risk/higher-reward stocks: AKG and EDV.TO. These
short-term positions are separate from the existing long-term positions in the
same stocks.
AKG has been a relatively weak stock over the past month, but this relative
weakness is solely due to a merger proposal that should benefit the company and
creates the potential for a catch-up move. At the same time, the company's large
cash reserve should limit the short-term downside from here.

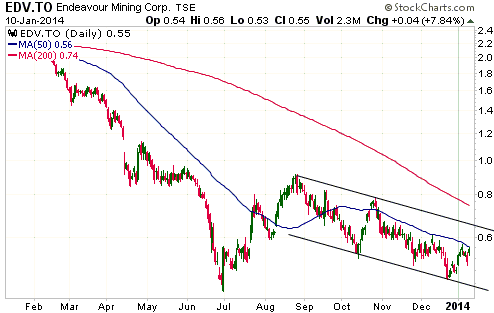
EDV.TO held up relatively well over the past few months and its December-2013
low looks like a successful test of its June-2013 low. A daily close above
C$0.70 would leave little doubt that an intermediate-term bottom was in place
and create a short-term target of C$1.00.
We are also adding a short-term trading position in one major gold stock: Gold
Fields Ltd (GFI). It looks like GFI successfully tested its December low last
Thursday.
Due to GFI's large decline during the final 5 months of 2013 it will now be able
to gain more than 50% before encountering meaningful chart-based resistance.
This is the short-term upside potential. Downside risk will be managed by
setting an initial sell stop at US$2.89.
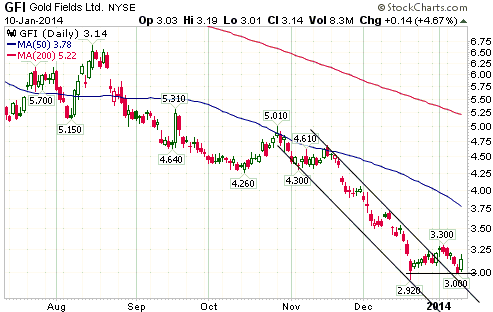
Chart Sources
Charts appearing in today's commentary
are courtesy of:
http://stockcharts.com/index.html
http://www.decisionpoint.com/
http://research.stlouisfed.org

|
