|
-- Weekly Market Update for the Week Commencing 13th February 2006
Big Picture
View
Here is a summary of our big picture
view of the markets. Note that our short-term views may differ from our
big picture view.
Bonds commenced a secular BEAR market in
June of 2003. (Last
update: 22 August 2005)
The stock market, as represented by the S&P500 Index, commenced a secular BEAR market during the first quarter of 2000. The rally
that
began in October of 2002 will end by the first quarter of 2006 and will
be followed by a substantial decline to a higher low (above the
Oct-2002 bottom) during the second half of 2006. The ultimate bottom of
the secular bear market won't occur until the next decade. (Last update: 12 December 2005)
The Dollar commenced a secular BEAR market during the final quarter of 2000. The
first major downward leg in this bear market ended during the first
quarter of 2005, but a long-term bottom won't occur until 2008-2010. (Last update: 28 March 2005)
Gold commenced a
secular bull market relative to all fiat currencies, the CRB Index,
bonds and most stock market indices during 1999-2001. The first major
upward leg in this secular bull market ended in December of 2003, but a
long-term peak won't occur until at least 2008-2010. (Last update: 13
February 2006)
Commodities, as
represented
by the CRB Index, commenced a secular BULL market in 2001. The first
major upward leg in this bull market will end during the first quarter of
2006, but a long-term
peak won't occur until at least 2008-2010. (Last update: 13 February 2006)
Copyright
Reminder
The commentaries that appear at TSI
may not be distributed, in full or in part, without our written permission.
In particular, please note that the posting of extracts from TSI commentaries
at other web sites or providing links to TSI commentaries at other web
sites (for example, at discussion boards) without our written permission
is prohibited.
We reserve the right to immediately
terminate the subscription of any TSI subscriber who distributes the TSI
commentaries without our written permission.
Outlook Summary
Market
|
Short-Term
(0-3 month)
|
Intermediate-Term
(3-12 month)
|
Long-Term
(1-5 Year)
|
Gold
|
Neutral
(5-Dec-05)
|
Bearish
(06-Feb-06)
|
Bullish
|
US$ (Dollar Index)
|
Bullish
(13-Feb-06)
| Bullish
(31-May-04)
|
Bearish
|
Bonds (US T-Bond)
|
Bearish
(11-Jan-06)
|
Bearish
(02-Jan-06)
|
Bearish
|
Stock Market (S&P500)
|
Neutral
(10-Jan-06)
|
Bearish
(05-Jan-05)
|
Bearish
|
Gold Stocks (HUI)
|
Neutral
(30-Nov-05)
|
Bearish
(06-Feb-06)
|
Bullish
|
General Commodities (CRB)
|
Neutral
(14-Nov-05)
|
Bearish
(23-Mar-05)
|
Bullish
|
Notes:
1. In those cases where we have been able to identify the commentary in
which the most recent outlook change occurred we've put the date of the
commentary below the current outlook.
2. "Neutral", in the above table, means that we either don't have a
firm opinion on which way the market will move or that we expect the
market to be trendless during the timeframe in question.
3. Long-term views are determined almost completely by fundamentals,
intermediate-term views by giving an approximately equal weighting to
fundmental and technical factors, and short-term views almost
completely by technicals.
The Velocity of Money
...whenever
the central bank creates a lot of new money out of thin air in an
effort to circumvent the need for production to precede consumption it
sets into motion what Frank Shostak refers to as an exchange of nothing
for something, an INEVITABLE consequence of which is a fall in the
purchasing power of money.
The Fed may well print a lot of new money, but what happens if the new
money is not spent? What happens if the velocity of money -- the rate
at which money changes hands in exchange for goods, services and
investments -- falls by enough to counteract the effect, on the
purchasing power of money, of the monetary inflation caused by the Fed?
Isn't it possible that we could end up with a situation where the Fed
is aggressively inflating the supply of money while the purchasing
power of money is INCREASING due to a general reluctance to spend the
money, that is, due to a fall in the velocity of money?
The short answer is no, it's not possible.
The slightly longer answer begins with the point that money doesn't
finance transactions, it facilitates them. For example, when a potato
farmer sells 5,000kg of potatoes for $20,000 and uses the proceeds to
purchase a new car the purchase of the car is being financed by the
farmer's production of potatoes, not by his accumulation of money.
Money has just acted as the medium of exchange, which, of course, is
all it is supposed to do. In this example, the purchasing power of
money can be expressed as follows: one dollar = 5,000/20,000 (0.25) kg
of potatoes or one dollar = 1/20,000 (0.00005) new cars. Furthermore, a
change in the supply of or the demand for potatoes, new cars or money
will change the rates at which these entities are exchanged. In other
words, if all else remains equal and the supply of money is increased
then more money will be required to purchase the same quantity of
potatoes and new cars*. The number of times that the same piece of
money changes hands within a certain period of time -- the so-called
"velocity of money" -- does not enter the equation.
The much longer and far more complete answer can be found in Frank Shostak's article at http://www.mises.org/story/918
The bottom line is that consumption can only be financed by production
-- either the current or past production of the consumer or, in the
case of a credit transaction, the current or past production of the
creditor. And whenever the central bank creates a lot of new money out
of thin air in an effort to circumvent the need for production to
precede consumption it sets into motion what Frank Shostak refers to as
an exchange of nothing for something, an INEVITABLE consequence of
which is a fall in the purchasing power of money. There is simply no
way around this basic economic truth. Furthermore, if enough people
come to believe that the central bank is going to continue the rapid
money creation well into the future then the rate at which money loses
its purchasing power will begin to EXCEED the rate at which new money
is being brought into existence due to people front-running the
expected future loss of purchasing power.
*This is an
over-simplification that would only apply if all transactions within
the economy involved potatoes and cars. In the real world there are
millions of different things being bought and sold every day, but the
point is that if the supply of money is increased while nothing else
changes then the purchasing power of money will fall in proportion to
the increase in money supply. In reality things are, of course,
constantly changing, which just means that an increase in the supply of
money will tend to have an uneven and difficult-to-pinpoint effect on
prices throughout the economy.
Updates to Big Picture Views
Gold
In
a world where currency inflation is pushing the prices of most
commodities and other assets higher it makes sense to take currency out
of the equation and look at how different asset classes are performing
relative to each other. If we do this we find that gold's performance
between the final quarter of 2000 and the final quarter of 2003 was far
more impressive than its performance since that time.
In the "Big Picture View" included at the top of every Weekly Market
Update we previously stated that the first major upward leg in gold's
long-term bull market ended in December of 2004.
The gold price has moved well above its December-2004 high over the
past 6 months, so either the second major upward leg in gold's
long-term bull market began during 2005 or our previous "Big Picture
View" was wrong and the first major upward leg has extended into 2006.
As far as the US$ gold price is concerned we think it is the latter
because the below chart reveals a very consistent upward trend starting
at the April-2001 low followed by an accelerated advance over the past
several months. Accelerated moves tend to occur during the CONCLUDING
stages of trends, so the chart of the US$ gold price paints a picture
of a single upward leg in the process of culminating.

In a world where currency inflation is pushing the prices of most
commodities and other assets higher it makes sense to take currency out
of the equation and look at how different asset classes are performing
relative to each other. If we do this we find that gold's performance
between the final quarter of 2000 and the final quarter of 2003 was far
more impressive than its performance since that time. For example, the
following charts of the gold/CRB ratio (the gold price relative to the
CRB Index) and the gold/GYX ratio (the gold price relative to the
Industrial Metals Index) suggest that the first major upward leg in
gold's long-term bull market actually ended during the final quarter of
2003 and that gold has, since then, been relatively weak. The gold/CRB
chart could be used to make the case that the second major upward leg
in gold's long-term bull market began in September of 2005, but there
is no evidence in the gold/GYX chart that a second major upward leg has
begun.
Our view is that the US$ gold price will complete the first major
upward leg in its long-term bull market during the first quarter of
this year. However, taking into account the performances of gold
relative to the non-US$ fiat currencies, commodities, and the major
stock market indices, as well as the performance of the AMEX Gold BUGS
Index, we think it makes the most sense to consider the first major
upward leg to have ended in December of 2003 and the second major
upward leg to have begun in September of 2005. In this case, the ending
of the FIRST major upward leg in the US$ gold price (Q1 2006?) will
probably coincide with the ending of the first rally in gold's SECOND
major upward leg when gold's performance is measured relative to most
other investments.
Further to the above, the Big Picture View at the top of the Weekly Market Update now reads as follows:
"Gold commenced a secular bull market relative to all fiat currencies,
the CRB Index, bonds and most stock market indices during 1999-2001.
The first major upward leg in this secular bull market ended in
December of 2003, but a long-term peak won't occur until at least
2008-2010."
Commodities
The CRB Index surprised us by moving above its March-2005 peak during
the second half of last year. Energy-related commodities lead the index
higher during the second and third quarters of 2005, after which metals
took over the leadership role.
Despite the strength in the 'energies' and the metals over the past 9
months, the CRB Index has only managed to exceed its March-2005 peak by
around 8%. If the stock market puts together a final surge into March
as per our current short-term forecast then the early-February peak in
the CRB Index might be tested or marginally exceeded before a
substantial correction gets underway. However, we think the rally in
the CRB Index that began during the final quarter of 2001 is
essentially complete. What we have seen over the past three years is
everything getting pushed upward by a rising sea of liquidity, but with
the bull markets in US stocks and real estate appearing to be on their
last legs the bull market in commodities is acutely vulnerable to a
large setback.
With reference to the following chart, a move below 320 will push the
CRB Index below the bottom of its long-term channel and confirm that an
important peak is in place.
The Stock
Market
Current Market Situation
...the Utility Index is CLOSE to generating a very bearish signal.
Leading indicators of the stock market and the economy -- the NDX/Dow
ratio and the yield-spread, for example -- suggest that the US stock
market is in the process of making an intermediate-term peak.
Furthermore, the fact that the gold sector has been a relative strength
leader over the past few months is a bad omen for the broad market
because it points to a growing recognition that gains in earnings are,
to a significant extent, being fueled by inflation. However, coincident
indicators suggest that we should continue to allow for a final stock
market rally over the coming 1-2 months that will likely result in the
S&P500 Index making a new high for the year while the NASDAQ100
Index remains below its January high.
Something to keep an eye on over the coming days/weeks is the Utility
Index. It didn't garner as much attention as the commodity,
homebuilding and technology sectors, but the utility sector has
probably had the most consistent upward trend in the US stock market
over the past three years. At the present time that upward trend is,
however, in jeopardy. Specifically, the Utility Index (see chart below)
peaked at the end of September-2005 and appears to have made a
secondary (lower) peak last month. Furthermore, it would only take an
additional decline of 3% to break the Utility Index below a short-term
trend-line, important lateral support at 400, the 200-day moving
average, and the long-term upward-sloping trend-line (not shown on the
below chart) that dates back to the Q1-2003 bottom. In other words, the
Utility Index is CLOSE to generating a very bearish signal.
An important risk
that we don't think is currently on the radar screens of many stock
market participants is the potential for a breakdown in the bond
market. From what we can gather, most stock market bears think
long-term interest rates will remain low and most stock market bulls
aren't giving much thought at all to the potential for rising bond
yields to interrupt the cyclical bull market in stocks. We plan to deal
with this topic in a future commentary.
This week's
important US economic events
| Date |
Description |
Monday Feb 13
| No important events scheduled
|
| Tuesday Feb 14
| Retail Sales
| | Wednesday Feb 15
| Net Foreign Purchases of US Securities
Capacity Utilisation
Industrial Production
| | Thursday Feb 16
| Import and Export Prices
Housing Starts
| | Friday Feb 17
| PPI
|
Gold and
the Dollar
Gold
Gold and the Fed
...there
could well be a period of a few months when the interest rate backdrop
becomes less favourable for gold even though the Fed is attempting to
loosen its monetary policy.
Whether the Fed's monetary policy is restrictive, accommodative or
neutral is not determined by the level of the Fed Funds rate or by the
current trend of the Fed Funds rate. It is, instead, determined by the
level of inflation expectations RELATIVE TO the level of the Fed Funds
rate. For example, monetary policy would become increasingly
restrictive while the Fed was CUTTING the Fed Funds rate if inflation
expectations were falling at a faster pace than the nominal short-term
interest rate controlled by the Fed; and monetary policy would become
increasingly accommodative while the Fed was HIKING the Fed Funds rate
if inflation expectations were rising faster than the nominal
short-term interest rate controlled by the Fed.
Further to the above, although gold is counter-cyclical and tends to do
relatively well when the Fed eases monetary policy in response to
economic weakness, the risk is that a general downturn in stock and
commodity prices will initially have the effect of making monetary
policy increasingly tight -- due to falling inflation expectations --
even if the Fed reacts to the downturn by cutting the Fed Funds rate.
There are good reasons to be supremely confident that under such
circumstances the Fed would eventually do enough to make its monetary
policy accommodative, but there could well be a period of a few months
when the interest rate backdrop becomes less favourable for gold even
though the Fed is attempting to loosen its monetary policy.
The aforementioned risk has been present throughout the past year, but
just because it hasn't yet caused a problem doesn't mean it is not
relevant. Gold's downside potential will, we think, be limited to
routine 10% (or so) pullbacks as long as the stock and commodity
markets continue to push higher, but we think that gold will be hit
during the INITIAL phase of a general downturn in stocks and
commodities. However, once the Fed panics and begins to overtly promote
inflation it is very likely that counter-cyclical gold will begin to
move up strongly while the cyclical markets continue to trend lower.
Current Market Situation
The following daily chart of April gold futures shows that short-term
support exists at around $548. A decisive daily close below this
support would be a preliminary sign that an intermediate-term peak was
put in place during the first week of this month.
The following weekly
chart of gold futures shows that there is good support at $540 and then
at $460-$480. The $500-$510 area should also offer support during a
decline because it coincides with a big round number and with former
long-term resistance (now support) defined by the 1983 and 1987 peaks.
If support at $540 is breached on a weekly closing basis then $500-$510 will probably be tested.
Our view is that if
the CRB Index and the S&P500 Index remain in intermediate-term
upward trends then a drop to test support at $500-$510 represents the
maximum downside risk for gold (it probably wouldn't even drop that
far). However, we expect intermediate-term declines to begin in the
stock and commodity markets within the next 1-2 months and therefore
think there's a significant chance of support at $460 being tested
within the coming 6 months.
Silver
Our view is that silver will spike up to $10-$11 before an
intermediate-term peak is put in place, but if the silver price closes
below the upper support level shown on the following weekly chart
(around $9.25) then we'd assume that an intermediate-term peak was put
in place at the beginning of this month when the March futures contract
hit $9.91.
Even if an intermediate-term peak is already in place we don't think
there's much chance that silver will experience anywhere near the same
magnitude of decline that it experienced following the April-2004 peak
because speculation in silver-related investments has been a lot more
subdued during the past 5 months than it was during the 5 months
leading up to the April-2004 peak. Our thinking is that IF an
intermediate-term decline is already underway then it will bottom near
support at $8.20.
Currency Market Update
The Dollar Index consolidated just above its 50-day moving average
during the first 4 days of last week and then put in an 'outside up'
day to breakout of its short-term channel. Last week's performance by
the US$ has convinced us that the late-January low will turn out to be
the ultimate low for the correction that began in November, meaning
that we think the Dollar Index's short-term downside risk is limited to
about 2 points. As a result we are upgrading our short-term US$ view
from "neutral" to "bullish".
In our opinion, the
major currency with the worst risk/reward as far as the coming 6 months
are concerned is the Canadian Dollar. The reason is that this currency
has been elevated by widespread enthusiasm for energy- and
metal-related investments and we expect this enthusiasm to wane over
the coming 2 quarters.
Aside from the US$, we think the major currency with the best
risk/reward as far as the next 6 months are concerned is the Yen
because the Japanese currency is oversold and under-valued and will, at
some point, experience a sharp recovery due to the unwinding of carry
trades.
Gold Stocks
In last week's Interim Update we wrote:
"Regardless of whether we
are seeing a pullback during an on-going intermediate-term advance or
the initial downward move of an intermediate-term decline, a short-term
bottom will probably be put in place within the coming week or so. The
difference is that if history is a useful guide then the initial
downward move in an intermediate-term correction would likely end with
the HUI in the 270s, whereas a pullback within an on-going
intermediate-term advance would likely bottom near the current level
(300-315)."
Since writing the above we've seen a rebound (on Thursday) followed by
a drop to new lows for the move on Friday, but nothing has really
changed. As noted on the following daily chart of the HUI, support at
around Friday's low should hold if the intermediate-term rally that
began last May is intact whereas additional downside of around 10% will
likely occur in the near future if the current decline is the first
downward step in an intermediate-term correction. Either way there's a
good chance that a short-term bottom will be put in place this week.
Update
on Stock Selections
 Below
is a daily chart of the nickel price covering the past 4 years. Nickel
was the leading industrial metal during 2002-2003, but since the first
quarter of 2004 its price has consolidated within a wide range while
the prices of copper, zinc, aluminium and lead have continued to
advance. Below
is a daily chart of the nickel price covering the past 4 years. Nickel
was the leading industrial metal during 2002-2003, but since the first
quarter of 2004 its price has consolidated within a wide range while
the prices of copper, zinc, aluminium and lead have continued to
advance.
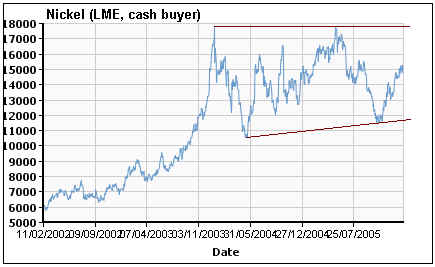
We expect all the
industrial metals to trade well below current levels within the next 6
months. Nickel, for instance, will probably move down to near the
bottom of its 2-year range (US$11,000/tonne or US$5.00/pound). For this
reason we were planning to retain core positions in some base metal
stocks in line with the secular bull market in this sector (in a
long-term bull market you should always be net-long), but weren't
intending to add any new base metal plays to the TSI Stocks List in the
near future. However, we've identified one stock that we think is worth
accumulating near current levels.
The stock is International Royalty Corp. (TSX: IRC). IRC is a royalty
company -- a company that invests money in early-stage mining ventures
in exchange for a percentage of the revenue that will be generated
if/when a mine is developed -- with a portfolio of over 60 projects
(potential future revenue streams). Almost all of these projects are at
the exploration stage and are therefore years away from providing IRC
with any revenue, but in a long-term bull market for metals these
projects have significant option value. One of IRC's projects is,
however, set to provide the company with substantial revenue beginning
this year. That project is the huge Voisey's Bay nickel deposit owned
by Inco.
IRC owns a royalty such that it will get paid 2.7% of the value of all
metals produced at Voisey's Bay, less certain deductions. Phase 1 of
Voisey's Bay has already begun to produce metal and production is
expected to ramp-up to the planned annual rates of 100M pounds of
Nickel and 70M pounds of copper over the coming months.
At current metal prices the Voisey's Bay royalty would provide IRC with
annual cash flow of US$23M (C$27M). For a company with a market
capitalisation of C$228M and an enterprise value (market capitalisation
+ net debt) of C$236M at Friday's closing price of C$4.00/share, this
is a significant amount of cash. It means that IRC is presently trading
at only 8.7-times the cash-flow that will be generated, beginning this
year, by ONE of its projects assuming current metal prices are
sustained. Alternatively, if we take a more conservative view and do
the cash-flow forecasts using our intermediate-term downside targets of
around US$5.25/pound for nickel and US$1.60 for copper, we find that
IRC is presently trading at around 10.8-times the cash-flow expected
from Voisey's Bay. This is still very reasonable given the upside
potential provided by the company's many other royalty projects and the
potential for base metal prices to move considerably higher during
2007-2010.
IRC had its Initial Public Offering (IPO) in February of 2005, so there
is only about 12 months of price history for the stock (the IPO price
was C$4.30). Over this period the stock appears to have established a
solid base at C$3.35-C$3.50, so this probably represents the maximum
downside risk over the coming months. Our suggestion, for those who are
interested in this stock, is to buy half a position near the current
level with the goal of buying the other half following a pullback to
the C3.50s.
We
mentioned Lion Selection Group (ASX: LSG) in a previous commentary. The
company trades in Australia and is, in effect, a closed-end fund that
invests in small (usually exploration-stage) gold and other metal
stocks. Buying LSG is a relatively low-risk way to obtain exposure to
small Australian-listed gold stocks.
If the correction in the gold sector continues then LSG will probably
become available near its long-term trend-line (see chart below), in
which case we would add it to the TSI Stocks List. Specifically, we
will add the stock to the List if it trades at A$1.85.
We will add major gold producer Kinross Gold (NYSE: KGC) to the Stocks
List if it trades at US$8.75 (a bit more than 10% below Friday's
closing price).
Last Thursday American Bonanza (TSX: BZA) announced an updated NI
43-101-compliant resource estimate for its Copperstone gold project in
Arizona. Copperstone now has a measured-and-indicated resource of
335,000 ounces plus an inferred resource of 66,000 ounces.
Given the amount of money and time that has gone into exploring
Copperstone over the past few years we thought the updated resource
estimate was disappointingly low. We were also disappointed that the
company has downgraded the current engineering work at Copperstone from
a "Pre-Feasibility study" to a "Preliminary Assessment".
As a result of the slower-than-expected progress at BZA's most
interesting project we've decided to exit the stock. The profit on the
trade was 45% based on our August-2005 entry at C$0.44 and Friday's
closing price of C$0.64.
BZA still has the potential to move up to around C$1.00 over the next
two months IF the overall positive trend in the gold sector remains
intact, but there's a limit to how many stocks we can follow and there
are a few junior gold stocks that currently aren't in the TSI Stocks
List that we think have better intermediate-term risk/reward ratios
than BZA. These other stocks will be introduced if/when their prices
drop to suitable levels for new buying.
We were stopped out of our short-term trade in Chesapeake Energy (NYSE: CHK) on Friday for a loss of 9%.
Chart Sources
Charts appearing in today's commentary
are courtesy of:
http://stockcharts.com/index.html
http://www.futuresource.com/

|