![]()
![]()
![]()
![]()
-- Weekly Market Update for 13th May 2019
Big Picture
View
Here is a summary of our big picture
view of the markets. Note that our short-term views may differ from our
big picture view.
The BULL market in US Treasury Bonds that began in the early 1980s ended in mid-2016, but there will be many years of topping action in bond prices and bottoming action in bond yields before major new trends get underway. A major decline in government bond prices will unfold during the 2020s. (Last update: 11 September 2017)
The stock market, as represented by the S&P500 Index, commenced a secular BEAR market during the first quarter of 2000, where "secular bear market" is defined as a long-term downward trend in valuations (P/E ratios, etc.), gold-denominated prices and inflation-adjusted prices. This secular trend will bottom in 2020 or later. (Last update: 11 September 2017)
A cyclical BEAR market in the US Dollar began in 2016-2017. (Last update: 11 September 2017)
Gold commenced a secular bull market relative to all fiat currencies, the CRB Index, bonds and most stock market indices during 1999-2001. This secular trend will peak in 2020 or later. (Last update: 11 September 2017)
Commodities,
as represented by the CRB Index, commenced a
secular BULL market in 2001 in nominal dollar terms. The first major
upward leg in this bull market ended during the first half of 2008, but
a long-term peak won't occur until 2020 or later.
(Last
update: 11 September 2017)
Copyright
Reminder
The commentaries that appear at TSI
may not be distributed, in full or in part, without our written permission.
In particular, please note that the posting of extracts from TSI commentaries
at other web sites or providing links to TSI commentaries at other web
sites (for example, at discussion boards) without our written permission
is prohibited.
We reserve the right to immediately
terminate the subscription of any TSI subscriber who distributes the TSI
commentaries without our written permission.
True
Fundamentals Summary
[Notes:
1) The date shown next to the current True Fundamentals Model (TFM) signal is
when the most recent change occurred. 2) Charts of the Gold and Equity
TFMs are included in the "Charts and Indicators" section of the TSI web
site]
| Market | True Fundamentals Model (TFM) |
| Gold (US$ Price) | Bullish (04 Jan 2019) |
| US Equity (SPX) | Bearish (19 Apr 2019) |
| Currency (Dollar Index) | Neutral (15 Mar 2019) |
| Commodities (GNX) | Bearish (01 Jun 2018) |
Last week's posts at the TSI Blog
What is GLD's gold inventory telling us?
Summary of current
thinking/positioning
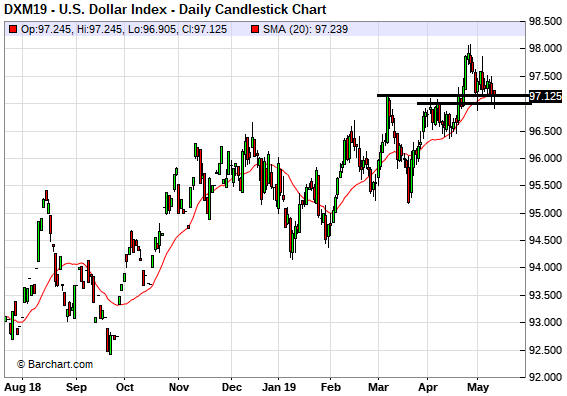
1) The Dollar Index (DX) is
precariously poised at support at 97. A sustained break below this support
would ignite tradable rallies in anti-dollar plays.
2) Gold, silver
and the associated mining indices should begin to rebound very soon. The
coming rebounds probably will be counter-trend reactions rather than new
multi-month upward trends, although a downward reversal in the DX could
lead to tradable strength in the gold sector.
3) Last week's
pullback in the US stock market was, we think, the first leg of a
significant correction. The short-term risk/reward is bearish, but the
intermediate-term upward trend probably isn't over.
4) There's a
good chance that a large T-Bond decline will commence before mid-year
following a test of the March high.
5) We are holding a cash
reserve of 30%-35%.
The old Keynesian
guidelines have been forgotten
Keynesian economic theory is
useless if the aim is to understand how the world of human production and
consumption works, but it is useful when attempting to figure out the
policies that will be implemented in the future. The reason is that
government and central bank policy-making is dominated by Keynesian ideas.
One of the most prominent Keynesian ideas is that changes in
aggregate demand drive the economy. This leads to the belief that the
government can keep the economy on a steady growth path by boosting its
deficit-spending (thus adding to aggregate demand) during periods when
economic activity is too slow and running surpluses (thus subtracting from
aggregate demand) during periods when economic activity is too fast.
To further explain using an analogy, in the Keynesian world the
economy is akin to a bathtub filled with an amorphous liquid called
"aggregate demand". When the liquid level gets too low it's the job of the
government and the central bank to top it up, and when the liquid level
gets too high it's the job of the government and the central bank to drain
it off. Keynesian economics therefore has been called "bathtub economics".
The real-world economy is nothing like a bathtub, but that doesn't seem to
matter.
In any case, the point we now want to make is that in the
US the traditional Keynesian guidelines are no longer being followed. Gone
are the days of ramping-up government deficit-spending in response to
economic weakness and running surpluses or at least reducing deficits when
the economy is strong. These days the US federal government applies
non-stop Keynesian-style stimulus and regularly exhorts the central bank
to do the same. So, debt-financed tax cuts were implemented in 2017 when
the economy seemed to be performing well, and now, with the unemployment
rate at a generational low, the stock market near an all-time high and GDP
growth chugging along at around 3%/year, the US government is planning a
US$2 trillion infrastructure spending spree and the executive branch
of the government is demanding that the Fed cut interest rates from levels
that are already very low by historical standards.
In other words,
although the 'Keynesian bathtub' appears to be almost over-flowing, the US
government is pushing for more demand-boosting actions. The strategy is
now full-on 'stimulus' all the time. That's part of why it doesn't make
sense to be anything other than long-term bullish on "inflation" and
long-term bearish on Treasury bonds.
Commodities
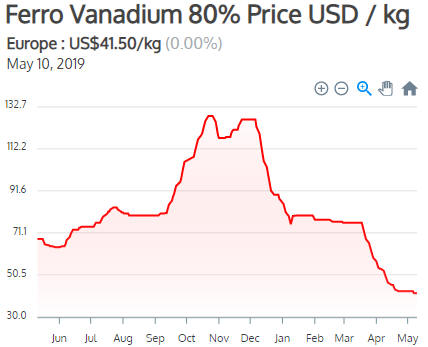
The Vanadium-Niobium
Substitution
The price of vanadium extended its relentless
slide over the past few weeks, but one sign that the decline might be
almost over is that ferro-vanadium now trades at a discount to
ferro-niobium, a potential substitute.
As explained in the article
by PCY's Michael Drozd linked
HERE, niobium can sometimes be used instead of vanadium as a
steel-strengthening additive. Here's an excerpt from the article:
"In
something known as high strength low alloy (HSLA) steel, a minor addition
(many times less than 0.5%) results in a large increase in strength. HSLA
steels are used in building structures (structural steel), automotive
frames, airplane fuselages (aluminum alloys), and jet engines (titanium
alloys). All of these alloys use vanadium. There are some uses of alloys
(such as rebar, reinforcing bars that are part of concrete structures)
that can use the "periodicity" of a metal (elements in the same column of
the periodic table sharing chemical and alloying properties) to substitute
for the metal above or below it on the periodic table. This is the case
for vanadium and niobium, as they are both in column 5B and so have
similar properties.
The difference between vanadium HSLA steel and
niobium HSLA steel derives from the manufacturing process and the quality
control. Vanadium steel can be manufactured at a lower temperature due to
better grain size formation. Niobium rebar has to be raised to a higher
temperature and be cooled under much more stringent conditions so as to
maintain metal quality. Additionally, niobium rebar can be more brittle
(cracks form earlier) than vanadium rebar. This means that after proper
alloy development, it is possible to substitute one metal for the other.
These substitute alloys have slightly different properties, and the
particular alloy has to be vetted to determine whether the differences are
minor. Usually, as the molecular weight increases, the elements in the
group become less viable as a substitute -- because the molecules become
too large. So niobium HSLA alloys may be more brittle than vanadium
alloys, but this brittleness may be acceptable since the tensile strength
(the maximum load that a material can support without fracture when
stretched, divided by the original cross-section area of the material) may
be a more important property than the lateral stability or shear strength.
(Shear strength is a material's ability to resist forces that can cause
parts of the internal structure of the material to slide against each
other. Adhesives tend to have high shear strengths.)"
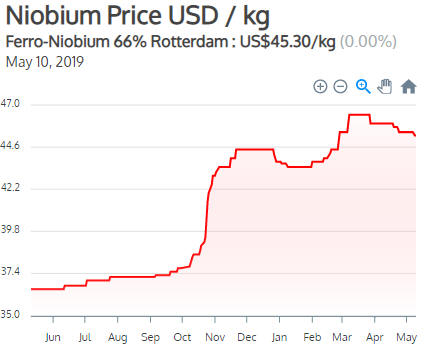
The
following charts show that the ferro-vanadium price has fallen from a peak
in the high-US$120s/kg last November to US$41.50/kg at the end of last
week, and that over the same period the ferro-niobium price has risen
slightly -- from the low-$40s/kg to US$45.30/kg. (Note: We normally show
charts of the vanadium pentoxide (V2O5) price, which has fallen from a
peak in the low-US$30s/pound last November to US$10.50/pound at the end of
last week.)
We expect that the battery industry will become the main driver of the
vanadium price within the next 5 years, but right now vanadium demand is
dominated by the metal's use in steel alloys. Consequently, for the time
being we must consider the niobium price when assessing the sustainability
of an upward or downward price move in the vanadium market.
Interestingly, even though the vanadium price keeps making new 12-month
lows, some vanadium mining stocks are showing signs of having bottomed a
few weeks ago. For example, vanadium producer Largo Resources (LGO.TO)
made at least a multi-week bottom on 22nd April -- one day after it was
highlighted as a potential trade in a TSI commentary. If LGO can close
above C$2 it will signal that a short-term bottom is in place and that a
rebound to the 200-day MA (currently at C$2.80) is possibly underway.
The Grains are incredibly cheap
The US-China
trade war has been the main driver of price weakness in the grain markets
over the past 12 months, but the tariffs-related reduction in Chinese
demand for US agricultural products only extended a well-entrenched trend.
As illustrated by the following weekly chart of the iPath Grains ETN
(JJGTF), grain prices have trended relentlessly downward since Q3-2012.
Furthermore, JJGTF has fallen by almost 20% since early this year despite
being at a depressed level prior to the start of its latest short-term
plunge.
We are long-term bullish on the grains due to the expected effects of
climate change (global cooling) on the production of these commodities,
but we have not been interested in buying direct exposure to grain prices
via funds such as JJGTF. As explained in previous commentaries, the best
way to obtain LONG-TERM exposure to grains and other food commodities is
via the stocks of fertiliser producers such as Mosaic (MOS) and Nutrien
(NTR), weekly charts of which are displayed below. We think it makes sense
to average into these stocks on weakness.
The stock price of NTR
has held up well, but there has recently been plenty of weakness in MOS.
This has a lot to do with Vale's iron-ore tailings dam disaster in Brazil
in January. A knock-on effect of this disaster has been the suspension of
mining at MOS's Brazilian phosphate operations while the company
implements plans to meet new regulatory requirements.
There's a
risk that MOS will test major support at US$20-$22 before making a
sustained reversal to the upside.
The Stock Market
Current US Market
Situation
Last week the news backdrop was decidedly
negative, with the US-China trade conflict unexpectedly getting ramped up
and the Uber IPO being a flop (Uber listed in the US on Friday and ended
the session about 8% below its IPO price).
The negative
trade-related news began on Sunday 5th May with a Trump 'tweet'. Trump
threatened to hike existing tariffs on $200B of imported Chinese goods
from 10% to 25% on Friday 10th May and impose 25% tariffs on all remaining
imported Chinese goods at a later date if China's government didn't cave
to US government demands. Unsurprisingly, China's government didn't cave,
so existing tariffs have been hiked and the process of adding new tariffs
has been started. There was some damage control from both governments late
in the week, however, in the form of Xi sending Trump a "beautiful letter"
(Trump's words) on Thursday and the US Treasury secretary announcing on
Friday that on-going US-China trade talks had been constructive.
There is still a high probability that a US-China trade deal will happen
within the next few months, but at the same time there's a high risk that
brinkmanship by the negotiators will lead to additional stock market
volatility in the short-term.
Despite entering last week
'overbought' and 'overbullish', the US stock market held up well last week
in the face of the negative news. For instance, the S&P500 (SPX) and the
NASDAQ100 (NDX) managed to hold above their respective 50-day MAs on a
daily closing basis. Even the relatively-weak Russell2000 SmallCap Index
(RUT) failed to give a daily close below nearby moving-average support.
Refer to the following charts for details.
What we have at the moment isn't really a correction; it's just a
4%-5% pullback from an 'overbought' extreme to initial support. It will
become a genuine correction if last week's lows are taken out.
We
think there's a high risk of a genuine correction that results in the
senior indices dropping by 10% or more from their early-May highs, but
anyone trading this market from the short side should be aware of the
possibility that good news on the trade front will hit with no warning.
US bank stocks are better longs than shorts
It's time to delve a little deeper into the relative value being offered
by the US banking sector. This is a topic we first broached a week ago, at
which time we wrote:
"...we suspect that the up-turn in the
BKX/SPX ratio from its March low (refer to the bottom section of the
following chart) has staying power. This is linked to our expectation that
long-term interest rates will rise over the next 6-12 months and to bank
stocks being attractively valued, on average, relative to the broad
market. Consequently, although it is not a trade we plan to do we like the
idea of simultaneously going long KBE (the Bank ETF) and short SPY."
Here's an updated version of the chart mentioned in the above excerpt:
To further explain, we think that two fundamental influences will
result in bank stocks being relatively strong over the next 6-12 months.
The first is rising long-term interest rates relative to the interest
rates that banks pay to their depositors and other creditors. That is, our
outlook for interest rates points to greater profits for the traditional
banking business.
The second reason to expect outperformance by
bank stocks over the intermediate-term is the low relative valuation of
the average bank stock. We can demonstrate this low relative valuation in
two ways, the first being via a long-term chart of the BKX/SPX ratio (the
Bank Index divided by the S&P500 Index).
The following chart shows
the performances of the BKX and the BKX/SPX ratio since 1995. Notice that
although the BKX is not far below its all-time high, the BKX/SPX ratio has
barely recovered at all since the Global Financial Crisis. It is not far
from a 25-year low and only slightly more than a third of its peak in the
early-2000s.
The other way that we can demonstrate the banking sector's low
relative valuation is to cite P/E ratios. The average 12-month trailing
and forward P/E ratios of the five largest US banks (JP Morgan, Bank of
America, Citigroup, Wells Fargo and Goldman Sachs) are 10.4 and 9.0,
respectively. These are roughly half the equivalent S&P500 P/E ratios.
Now, it possibly would be reasonable for banks to trade at such
depressed relative valuations if a major liquidity crisis were brewing in
the banking industry. At this time, however, this is no sign of such a
risk.
As evidence we point to the following chart of the
LIBOR-UST3M spread (the 3-month rate at which banks lend to each other
minus the 3-month rate that the US government pays). In the early stage of
a banking crisis some banks become concerned about the financial positions
of other banks and begin to restrict credit, causing 3-month LIBOR to rise
relative to the 3-month T-Bill yield. With the LIBOR-UST3M spread
currently at the bottom of its 15-year range, that clearly isn't the case
right now.
We reiterate that it could make sense to simultaneously go long KBE
(the Bank ETF) and short SPY for an intermediate-term trade.
This week's
significant US economic events
[Notes:
1) The most important events
(to the markets) are shown
in bold. 2) A list of global economic events can be found
HERE]
| Date | Description |
| Monday May-13 | No important events scheduled |
| Tuesday May-14 | No important events scheduled |
| Wednesday May-15 |
Retail Sales Industrial Production Business Inventories |
| Thursday May-16 |
Housing Starts Building Permits |
| Friday May-17 | Consumer Sentiment Index |
Gold and the Dollar