


--
Weekly Market Update for the Week Commencing
13th August 2018
Big Picture
View
Here is a summary of our big picture
view of the markets. Note that our short-term views may differ from our
big picture view.
The BULL market in US Treasury Bonds
that began in the early 1980s ended in mid-2016, but there will be many years
of topping action in bond prices and bottoming action in bond yields before
major new trends get underway. A major decline in government bond prices will
unfold during the 2020s. (Last update: 11 September 2017)
The stock market, as represented by the S&P500 Index,
commenced
a secular BEAR market during the first quarter of 2000, where "secular
bear market" is defined as a long-term downward trend in valuations
(P/E ratios, etc.), gold-denominated prices and inflation-adjusted prices. This secular trend will bottom
in 2020 or later.
(Last update: 11 September 2017)
A cyclical BEAR market in the
US
Dollar
began in 2016-2017.
(Last
update: 11 September 2017)
Gold commenced a
secular bull market relative to all fiat currencies, the CRB Index,
bonds and most stock market indices during 1999-2001.
This secular trend will peak in 2020
or later.
(Last update: 11 September 2017)
Commodities,
as represented by the CRB Index, commenced a
secular BULL market in 2001 in nominal dollar terms. The first major
upward leg in this bull market ended during the first half of 2008, but
a long-term peak won't occur until 2020 or later.
(Last
update: 11 September 2017)
Copyright
Reminder
The commentaries that appear at TSI
may not be distributed, in full or in part, without our written permission.
In particular, please note that the posting of extracts from TSI commentaries
at other web sites or providing links to TSI commentaries at other web
sites (for example, at discussion boards) without our written permission
is prohibited.
We reserve the right to immediately
terminate the subscription of any TSI subscriber who distributes the TSI
commentaries without our written permission.
True
Fundamentals Summary
[Notes:
1) The date shown next to the current True Fundamentals Model (TFM) signal is
when the most recent change occurred. 2) Charts of the Gold and Equity
TFMs are included in the "Charts and Indicators" section of the TSI web
site]
|
Market |
True Fundamentals Model (TFM) |
|
Gold (US$ Price) |
Bearish (20 Jul 2018) |
|
US Equity (SPX) |
Bearish (29 Jun 2018) |
|
Currency (Dollar Index) |
Bullish (27 Apr 2018) |
|
Commodities (GNX) |
Bearish (01 Jun 2018) |
Last week's posts at the TSI Blog
A different look at the US yield curve
Summary of current
thinking/positioning
1) Contrary to what we expected,
the Dollar Index (DX) has broken out to the upside. Unless the breakout is
quickly invalidated this should lead to significant additional US$
strength over the coming few weeks.
2) Upward reversals still have
not been signaled in the gold and silver markets, leaving the door open to
new 2018 lows prior to meaningful rallies getting underway. In fact, new
2018 lows probably will occur as soon as this week.
3) The
gold-mining indices have extended their downward trends, but are yet to
experience a capitulation. This creates the risk that a speculative
capitulation lies ahead. We have substantial exposure to the gold-mining
sector and have hedged against this short-term risk via GDX put options.
4) There are numerous divergences within the US stock market and
last week the SPX again reversed course after touching its channel top.
With monetary conditions tightening, the short-term downside risk appears
to be high.
5) Most industrial commodities probably will remain in
correction mode for another 1-3 months. Also, after being relatively
strong for the bulk of the past 12 months the oil market looks set to be
relatively weak for the next few months.
6) The T-Bond price should
have an upward bias (meaning: the T-Bond yield should have a downward
bias) for at least the next two months.
7) We are holding a cash
reserve of around 30% and looking for opportunities to build up this
reserve.
Commodities
Is it time to bet
against the oil price?
The short answer to the above
question is yes, but a better opportunity would be created by a rebound to
$70-$71.
Although it made a higher high in early-July, for all
intents and purposes the price of oil (West Texas Intermediate Crude) has
been in correction mode since late-May. However, the oil market correction
has been mild while the industrial-metals markets have experienced
substantial sell-offs. This opens up the possibility that the oil price
will make a catch-up move to the downside within the coming few months. A
daily close below $66 (roughly, the bottom of the channel drawn on the
following daily chart) would warn that such a move had begun.
The futures curve indicates that the physical supply-demand situation
(the fundamental backdrop) remains supportive of the oil price, albeit not
as supportive as it was a few months ago. As long as physical supply is
tight relative to demand there shouldn't be anything more bearish than a
correction within a longer-term upward trend, but note that a bull-market
correction could result in the price dropping as low as the mid-$50s.
Furthermore, there is no guarantee that the fundamental backdrop will
remain supportive.
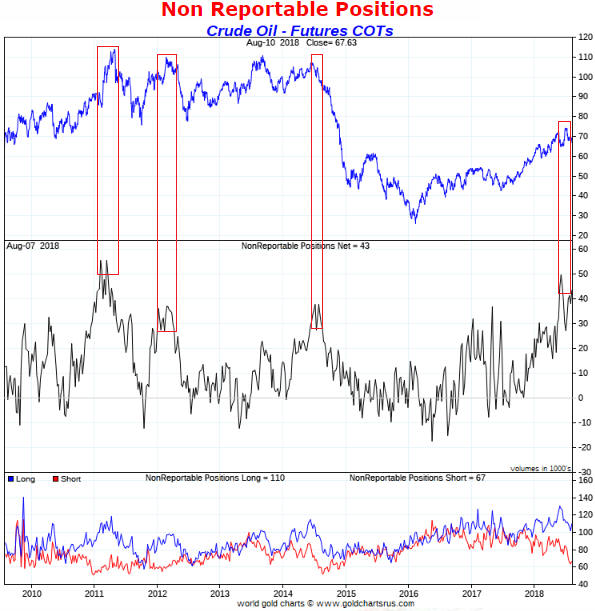
In addition to oil's current high price
relative to other industrial commodities there are currently two reasons
to focus on oil's short-term downside potential. The first is that the
"NonReportable" traders of oil futures (the proverbial dumb money)
recently experienced a surge of bullish enthusiasm. As illustrated by the
following chart, something similar happened near important price tops in
2011, 2012 and 2014. The second is that the Dollar Index has just broken
out to the upside.
Further to the above, it could make sense for speculators to take a
bearish oil position. As mentioned at the start of this discussion a
better entry point would be established by a near-term rebound to $70-$71,
but if the position is being averaged into the timing of the initial foray
won't be critical.
We caution that it is always risky to bet
against oil by purchasing a leveraged bear fund or shorting the futures.
The reason is that this is a market that can always rocket higher in
reaction to 'out of the blue' news such as a 'blow-up' in the Middle East.
A protective stop may not help in such a situation.
We will be
making the bet in our own account by purchasing USO January-2019 put
options, and we possibly will add a USO January-2019 put option to the TSI
List if the oil price rebounds to around $70 in the near future. Note that
until the channel drawn on the above chart is breached there will be an
outside chance of the oil price rebounding far enough to test its
early-July high as part of a developing top.
A 26-year low
for the natural gas price
In the US the natural gas (NG)
price is very low by long-term historical standards, but it is nowhere
near as low as it was in early-2016 and it has been gradually rising since
intermediate-term support was tested in February of this year. In some
parts of the world the NG price is actually high at the moment due to
minimal local supply and surging demand. In Canada, however, the NG price
hit a 26-year low during the second quarter of this year. Considering the
huge monetary inflation that has occurred, it's extraordinary that the
price of an increasingly-popular natural resource has just made a
generational low in nominal currency terms.
Here is a long-term
chart of the AECO (Alberta Energy Company) NG price, that is, the Canadian
NG price. The chart ends at April-2018 and doesn't show the new
multi-decade low that was achieved in May.
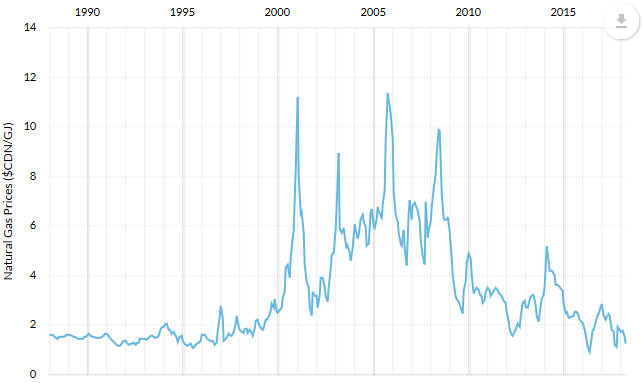
Chart source:
http://economicdashboard.alberta.ca/NaturalGasPrice
Remarkably,
some Canadian NG producers are still finding ways to be profitable in the
current market environment. This is made possible by a low production
cost, astute hedging and being able to sell some oil and/or NG liquids at
relatively high prices. Peyto Energy (PEY.TO), which we mentioned in the
25th July Interim Update, is one such company.
PEY just reported
its 54th consecutive quarter of profitability. Furthermore, during the
first half of this year PEY managed to reduce its net debt by $62M while
paying $67M of dividends to shareholders.
Being very profitable
and paying out sizable dividends (the current yield is almost 7%) hasn't
done anything good for PEY's stock price, though. As illustrated by the
chart displayed below, the price of a PEY share is languishing near an
8-year low and is down by almost 75% over the past two years. Not
surprisingly, therefore, the past two years has also been a dismal time
for the more marginal Canadian NG producers such as Petrus Resources
(PRQ.TO), a TSI stock.
In a bearish market environment sometimes
even the best companies get taken out back and shot, whereas in a bullish
market environment it is not uncommon for turkeys to soar like eagles.
With Canadian and US natural gas storage levels at the low end of
historical ranges, PEY's management expects a significant jump in prices
heading into winter and has adjusted the company's hedging and drilling
plans accordingly. If this expectation is correct then the beaten-down
Canadian NG stocks stand a good chance of rebounding strongly over the
next 6 months.
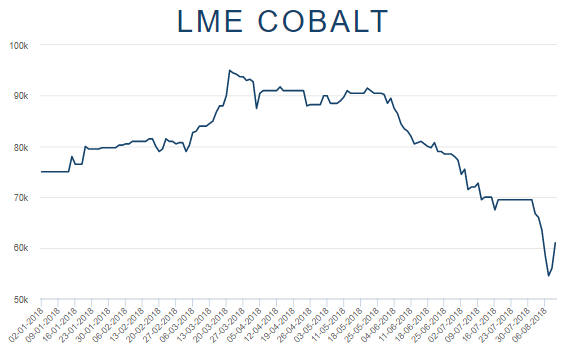
Cobalt turns volatile
The
cobalt price ended the month of July at US$69,500/tonne and ended the 7th
August LME trading session at US$54,500/tonne. This means that it dropped
20% during the first 5 trading days of August, an extremely fast move for
this market. By 9th August it had recovered to $61,000/tonne. Therefore,
it's fair to say that we are getting some wild swings in the cobalt price.
The amount of cobalt in EV batteries is being reduced to 10% or less,
but due to the exponential growth in EV production over the years ahead
there is still likely to be a large increase in the demand for cobalt. We
therefore expect the cobalt price to make new highs within the next few
years, regardless of whether the recent plunge and sharp rebound in the
cobalt price marked the end of the correction that began in March.
The Stock Market
The US
Last week the SPX again reversed after rising to its channel top. The
channel top now coincides with the January-2018 all-time high (2873).
Closing a day above 2873 would be an important breakout and could/should
be viewed as a signal to exit short-term bearish speculations.
A
daily close below 2750 would take the SPX through the bottom of its
channel and open the door to a fast decline to below the February low.
The NDX reversed course over the final two days of last week after
rising for seven days in a row to slightly beneath its July high. A daily
close below 7200 would signal that an 'interesting' decline had begun.
Last week's conclusion still applies: "...the US stock market has
large short-term downside potential, but the potential is yet to be
confirmed by the price action."
Europe
European financial stocks, as represented by the iShares MSCI Europe
Financial ETF (EUFN), have been under pressure and trending downward since
late-January. The downward trend was driven in part by the travails of
Deutsche Bank (DB).
They were in recovery mode from late-June
through to early-August, but last week there was a sudden increase in the
downward pressure in response to the goings-on in Turkey and the crash of
Turkey's currency. It looks like the downward trend is about to extend and
that EUFN is a reasonable candidate for a short-term bearish speculation,
especially if it rebounds to around $20.50.
The iShares Italy ETF (EWI) is an even better candidate for a
short-term bearish speculation, ideally following a rebound to around
$28.50. EWI captures Italian political risk in addition to a significant
amount of European banking-sector risk. It also appears to have completed
a major topping pattern.
This week's
significant US economic events
[Notes:
1) The most important events
(to the markets) are shown
in bold. 2) A list of global economic events can be found
HERE]
| Date |
Description |
|
Monday Aug-13 |
No important events scheduled |
|
Tuesday Aug-14 |
No important events scheduled |
|
Wednesday Aug-15 |
Retail Sales
Industrial Production
Business Inventories |
|
Thursday Aug-16 |
Housing Starts |
|
Friday Aug-17 |
Consumer Sentiment |
Gold and the Dollar
Gold
Sentiment
Gold's COT situation continues
to improve. It is not as bullish as it was at the late-2015 multi-year price
bottom, but it is more bullish than at any time over the past 2.5 years.
Furthermore, as mentioned in last week's Interim Update the Consensus-inc
Bullish Sentiment Index for gold recently hit a 14-year low.
At the same
time, silver's COT situation is slightly bearish. In the silver futures market
the open interest has just risen to a 3-year high (important price lows tend to
coincide with low open interest). Also, the gross speculative long position in
silver futures is larger now than it was in mid-May, when the price was about $1
higher and important support levels were intact.
There's a strong
tendency for the silver price to follow the gold price, so gold-market sentiment
is more important than silver-market sentiment. However, silver's COT situation
is muddying the waters.
The next major gold
rally
During the first three quarters of 2016 we were open to the
possibility that a new cyclical gold bull market got underway in December of
2015, but over the past 18 months we have been consistent in our opinion that
the December-2015 upward reversal in the US$ gold price did NOT mark the start
of a bull market. Since late-2016 there have been some interesting rallies in
the gold price, but at no time has there been a good reason to believe that we
were dealing with a bull market. That's still the case. The question is: what
will it take to set a new cyclical gold bull market in motion?
The simple
answer is that it will take a US equity bear market. However, this is not a
practical answer because in real time there often will be no way of
differentiating the first 6-9 months of an equity bear market from an
intermediate-term bull-market correction. The most practical answer we can come
up with is that it will take an upward reversal in the yield curve.
It
has become popular to argue that due to extraordinary monetary policy the yield
curve is not as important as it was in the past, but we strongly disagree. In
our opinion the yield curve is, if anything, more important now -- in the face
of extraordinary monetary policy -- than it has ever been.
The potential
for the US yield curve to invert in the not-too-distant future is a red herring.
Except to the extent that it influences the psychology of senior Fed officials,
whether or not the curve inverts is neither here nor there. It's the reversal
from 'flattening' to 'steepening' that matters, regardless of whether the
reversal happens before or after the curve inverts.
If the next major
reversal of the yield curve is driven primarily by falling short-term interest
rates then it will signal the onset of an economic bust. An economic bust would
naturally coincide with an equity bear market and the start of a gold bull
market. On the other hand, if the next major reversal of the yield curve is
driven primarily by rising long-term interest rates then it will signal the
onset of an inflationary blow-off that likely would go hand-in-hand with a
powerful 1-2 year rally in the gold price and the prices of most other
commodities.
Last week the 10yr-2yr yield spread, a proxy for the US
yield curve, fell to within 2 basis points of the 10-year low reached in
mid-July. Therefore, at this time there is no sign of an upward reversal.
Current Market Situation
Last
Friday's upside breakout in the Dollar Index didn't faze the gold market. That's
because the US dollar's strength was driven by fear that European banks could be
facing huge losses relating to their exposure to Turkey. However, as the days go
by gold's performance since its 19th July bottom at $1210 is looking more like a
consolidation and less like a base. This suggests that new lows for the year
will be seen prior to the start of a tradable rally.
It's still the case
that a daily close above $1240 will be required to signal a short-term trend
reversal. However, the 20-day MA acted as a barrier last week so a daily close
above this MA (presently at $1226) could be viewed as an early-warning signal
that a reversal is in the works.
Silver
The silver price has moved sideways since
breaking below an important lateral support level in mid-July. This price action
suggests that silver will trade below its mid-July low before reaching a
multi-month price bottom.
As previously advised, a daily close above
$15.80 would confirm that a short-term price bottom is in place.
Gold Stocks
Some individual gold-mining stocks have
suffered large price declines over the past few weeks, but for the sector as a
whole, as represented by the most popular indices and ETFs, there has not yet
been anything close to a capitulation.
For example, the following daily
chart shows that GDX, which is probably the most important of the gold-mining
ETFs, has drifted downward on low volume over the past few weeks. Even the break
below obvious lateral support at $21.00 didn't lead to downward acceleration or
a significant pick-up in volume.
For
another example, here is a daily chart of the iShares S&P/TSX Global Gold Index
ETF (XGD.TO), the Canadian equivalent of GDX. Over the past few weeks XGD has
drifted downward on low volume from the top to the bottom of its narrow 6-month
range. This is not what a gold-sector capitulation looks like.
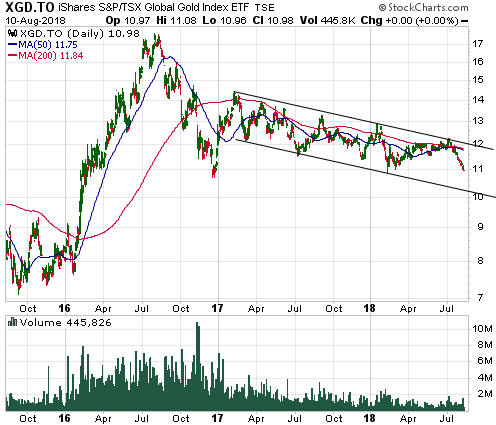
What we've witnessed over the past few weeks is not a capitulation, but a
gradual loss of interest.
As pointed out in last week's Interim Update,
tradable rallies can start in the absence of capitulation. For example, all of
the 1-2 month rebounds that happened over the past 18 months began without a
preceding capitulation. It's just that if a 'deck-clearing' decline hasn't
happened and the market hasn't signaled an upward reversal then there will be a
risk that such a decline will happen in the near future. Also, a capitulation
would set the stage for something more interesting on the upside than a 1-2
month rebound.
As to what a reversal signal would look like, we covered
that in last week's Interim Update. Nothing of significance changed over the
final two days of the week, so this comment still applies:
"Due to
having breached obvious support at $21.00, to signal a reversal all GDX would
have to do now is close a day at $21.50 or higher. Doing so would mark the
preceding downside breakout as false. However, the downside breakout suggests a
short-term target of $18.50 and the breakout should be respected until/unless it
proves to be false."
With regard to the performance of the
gold-mining sector relative to gold bullion, the following chart shows the
unbroken sequence of declining tops and bottoms in the HUI/gold ratio since
early last year. In mid-July we wrote that the HUI/gold ratio had to hold above
its 150-day MA (the green line on the chart) to avoid perpetuating the pattern
of the preceding 18 months, but it failed to do so. The pattern suggested that a
decline to a new 2-year low would occur prior to the next meaningful rally.
A new 2-year low is almost in place, but note that a much better set-up for
a rally would be created by a plunge to well below the March low than by a
decline to a marginal new low.
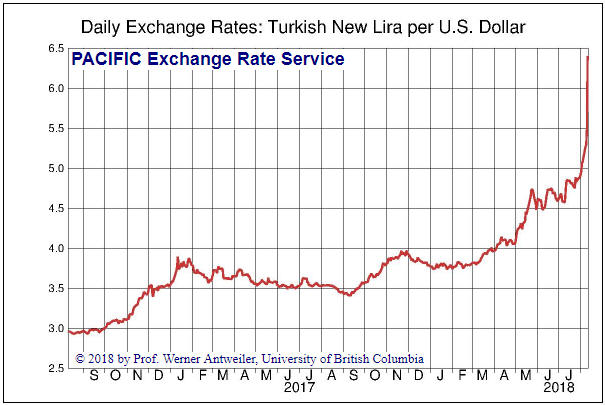
The Currency Market
The biggest news last week was
the crash in the Turkish Lira (TRY). As illustrated by the following chart,
Turkey's currency has lost about 30% of its value against the US$ since the end
of July (a rising line on the chart indicates a weakening Lira).
In
the 28th May Weekly Update, we wrote:
"If we had to place a bet today
on which globally-significant currency would be the world's weakest over the
coming 12 months we would pick the Turkish Lira. The main reason relates to
governance.
Recep Erdogan, Turkey's president, is aggressively
consolidating power and clearly is striving to be the country's dictator. He is
very much against the actions that would have to be taken to rein-in inflation
and stabilise the currency, and if he is successful in the elections scheduled
for 24th June [it turned out that he was successful] he will have greater
influence over the actions of the central bank."
'Erdogan risk'
(with a healthy dose of 'Trump risk')
moved to centre stage last week, prompting the currency collapse illustrated
above. However, the primary concern of the major financial markets wasn't the
brewing crisis in Turkey per se but the potential effect of this crisis on
Europe's banks. Some European banks have loaned substantial sums to Turkey-based
businesses and will have major problems if the tanking TRY leads to large-scale
loan defaults. That, in essence, is why the euro plunged and the Dollar Index
(DX) surged on Friday 10th August.
As evidenced by the daily chart
displayed below, on Friday the DX broke above the top of its rising wedge and
also achieved a solid weekly close above intermediate-term lateral resistance at
95.
As is always the case in such situations, there's a chance that last
Friday's breakout will prove to be a false signal. But as is also always the
case, it's prudent to assume that the breakout will be sustainable until it
proves otherwise. Proving otherwise would require a daily close below 95 for the
DX or a daily close above 1.16 for the euro.
If Friday's breakout was the
'real thing' then there could be a sharp rise in the DX over the coming 3-5
weeks -- similar to what happened between late-April and late-May. Also, unless
the breakout is quickly invalidated it will be evidence that the DX's bull
market did not end last year.
The Australian Dollar (A$) and the Swiss
Franc (SF) are the currencies we have focused on for anti-US$ short-term trades.
This was on the expectation that the DX would not do what it has just done,
which is break above resistance. The A$ broke out to the downside along with the
euro on Friday, but the following chart shows that the SF's double bottom is
intact. The SF is benefiting from a flight away from the euro and from the
unwinding of carry trades.
Due
to last Friday's market action, most anti-US$ short-term trades should be
exited. A reasonable argument can be made for retaining long SF positions, but
only if tight stops are used.
Note that when speculating on market
outcomes by purchasing out-of-the-money options, by the time there is clear
evidence that the position is wrong there often won't be much value left to
salvage by selling the position. That's certainly the case with regard to the
FXA (A$) September $80 call options that we added to the TSI List a few months
ago.
Updates
on Stock Selections
Notes: 1) To review the complete list of current TSI stock selections, logon at
http://www.speculative-investor.com/new/market_logon.asp
and then click on "Stock Selections" in the menu. When at the Stock
Selections page, click on a stock's symbol to bring-up an archive of
our comments on the stock in question. 2) The Small Stock Watch List is
located at http://www.speculative-investor.com/new/smallstockwatch.html
 Company
news/developments for the week ending Friday 10th August 2018:
Company
news/developments for the week ending Friday 10th August 2018:
[Note: AISC = All-In Sustaining Cost, FS = Feasibility Study, FY = Financial
Year, IRR = Internal Rate of Return, ISR = In-Situ Recovery, MD&A = Management
Discussion and Analysis, M&I = Measured and Indicated, NAV = Net Asset Value,
NPV(X%) = Net Present Value using a discount rate of X%, NSR = Net Smelter
Return, P&P = Proven and Probable, PEA = Preliminary Economic Assessment, PFS =
Pre-Feasibility Study]
*Almaden Minerals (AAU)
published its financial statements for the June-2018 quarter, revealing that the
company had C$11.3M of working capital at 30th June. Although this is only about
C$1M less than it had at the end of the preceding quarter, during the
intervening period the company raised about C$9M via a private placement at
C$1.00/share. This means that the company consumed about C$10M of cash during
the latest quarter.
The high quarterly cash burn was due to the company
making its final payment on the second-hand mill it agreed to purchase three
years ago. This payment accounted for C$6.1M of the quarter's cash expenditure.
The aforementioned working capital amount should be enough to fund AAU
through FS completion and submission of the Environmental Impact Assessment for
the company's flagship Ixtaca gold-silver project in Puebla State, Mexico. Both
of these milestones are expected to happen before year-end.
We continue
to expect that AAU will receive a takeover bid soon after completion of the FS
and environmental permitting.
*Continental Gold (CNL.TO)
published its financial results for the June-2018 quarter.
At 31st March
the company had working capital of US$41M (down from $69M at 31st December and
$45M at 31st March), long-term debt of US$120M (up from $48M at 31st December
and $73M at 31st March) and undrawn credit of US$125M.
The company has
available financing (working capital plus undrawn credit) of $166M. Although
this should be enough to cover the remaining mine capex and working capital
requirements, we expect that for risk management purposes a US$20M-$40M equity
financing will be done within the next 6 months.
*Cobalt
27 Capital (KBLT.V) has been hit hard in the stock market over the past
two months, as have most other cobalt plays. This is primarily a reaction to the
downward correction in the cobalt price, although in KBLT's case the decline was
helped along by a large, discounted equity financing.
We have updated our
KBLT valuation to reflect the change in the cobalt price. Our previous valuation
(refer to the 18th June Weekly Update) of C$17.80/share was based on a cobalt
price of US$88,000/tonne (US$40/pound). At US$65,000/tonne for cobalt our
estimate of fair value for KBLT drops to C$13.80/share.
Currently, cobalt
is trading at around US$61,000/tonne. We haven't re-done our valuation at this
lower price, but it would be in the C$12.50-C$13.00 range.
Although the
fundamental value of a KBLT share has dropped significantly, the share price has
dropped a lot more. By our reckoning, at Friday's closing price of C$6.35 the
shares are trading at about half of their underlying value.
*Premier
Gold (PG.TO) published its quarterly financial results for the June
quarter.
PG's quarterly financial performance tends to be lumpy, meaning
that there tend to be large swings in cash flow and earnings from one quarter to
the next. This is the nature of its business. The company has two operating gold
mines, only one of which (Mercedes) has steady production. The other (South
Arturo) sometimes produces a lot and sometimes produces almost nothing, all in
accordance with the long-term mine plan. Also, the company makes a significant
investment in its portfolio of exploration-stage projects every quarter.
For the June quarter PG reported a loss of US$7.7M. More importantly, its net
cash position (working capital minus long-term debt) decreased by about US$11M.
At US$56M the net cash position remains very healthy, though, and the
contribution of the Mercedes mine is expected to be far more positive during the
second half of the year than it was during the first half.
Due to the
costs associated with the ramp-up of new small-scale mines at South Arturo we
expect that the company will be cash-flow negative over the remainder of this
year, but not sufficiently so to put a large dent in its net cash position. The
company should be strongly cash-flow positive during 2019.
In addition to
being affected by sector-wide weakness, PG's stock price may have been pressured
downward recently by the major change to the Vanguard Precious Metals Fund
(VGPMX). VGPMX is a $2.3B fund that until about two weeks ago was focused on
precious metals (PM) stocks. As explained at
https://investor.vanguard.com/mutual-funds/precious-metals-changes, the fund
is changing its name, coming under new management and shifting its focus away
from PM stocks. We understand that Vanguard holds or held several million PG
shares, so PG could be one of the PM stocks that is being unloaded by the new
manager of the fund formerly known as VGPMX.
Stock price declines caused
by the forced liquidation of an ETF or a mutual fund never concern us, because
such declines are invariably retraced. Also, as is probably the case with the
VGPMX change, they can be evidence that market sentiment is close to bottoming
out. The declines that concern us are the ones that happen in reaction to
worsening company-specific fundamentals. For example, Alio Gold (ALO) was down
by 17% on Friday in reaction to a disastrous quarterly report.
*Petrus
Resources (PRQ.TO) published its financial results for the June quarter
and the first half of 2018.
During the quarter the company's net debt
(long-term debt minus working capital) dropped from C$144M to C$143M, meaning
that the company added about C$1M of cash to its balance sheet. Net debt was
C$146M at the start of the year, so C$3M of cash was added to the balance sheet
during the first half. Quarterly production averaged about 9,200 boe/day, which
was about 1,400 boe/d lower than the March quarter. The lower production was a
planned response to the extremely low natural gas price in Canada.
The
company's book value at 30th June was C$2.76/share. This is down from
C$3.08/share at the end of last year.
Considering the commodity-price
environment, PRQ's financial performance was satisfactory over the first half of
this year. However, the company will struggle to do more than tread water until
there is a substantial rebound in the Canadian natural gas price.
*US Gold Corp. (USAU) has been very quiet over the past few
months, both in the stock market and in terms of company news. However, assay
results from step-out drilling currently underway at the company's Copper King
gold-copper project in Wyoming should be available next month.
List
of candidates for new buying
From within the ranks of TSI stock
selections the best candidates for new buying at this time, listed in
alphabetical order, are:
1) AAU (last Friday's closing price: US$0.65)
2) CNL.TO (last Friday's closing price: C$3.64)
3) PG.TO (last
Friday's closing price: C$2.12)
4) PRQ.TO (last Friday's closing price:
C$0.85)
5) SBB.TO (last Friday's closing price: C$1.38)
The above
list is limited to five stocks. It will sometimes contain less than five, but it
will never contain more than five regardless of how many stocks are attractively
priced for new buying.
Chart Sources
Charts appearing in today's commentary
are courtesy of:
https://stockcharts.com/
http://www.goldchartsrus.com/
https://www.lme.com/
Pacific
Exchange Rate Service
