|
-- Weekly Market Update for the Week Commencing 13th September 2004
Big Picture
View
Here is a summary of our big picture
view of the markets. Note that our short-term views may differ from our
big picture view.
Bond yields (long-term interest
rates) bottomed in June of 2003 at around 4.2% and will move considerably higher during
2004 and 2005. (Last update: 12 January 2004)
The stock market rally that
began in October of 2002 ended during the first half of 2004. The October-2002
bottom (775 for the S&P500) will be tested during 2005. (Last update: 12 July 2004)
The Dollar made an
intermediate-term
bottom in February of 2004 and will move higher into the first half of 2005. A long-term
bottom won't occur until
2008-2010. (Last update: 26 July 2004)
Gold made an intermediate-term
peak during the first half of 2004, but a long-term peak won't occur until 2008-2010. (Last update: 12 July 2004)
Commodities, as represented
by the CRB Index, made an intermediate-term peak during the first
half of 2004, but a long-term
peak won't occur until 2008-2010. (Last update: 12 July 2004)
Copyright
Reminder
The commentaries that appear at TSI
may not be distributed, in full or in part, without our written permission.
In particular, please note that the posting of extracts from TSI commentaries
at other web sites or providing links to TSI commentaries at other web
sites (for example, at discussion boards) without our written permission
is prohibited.
We reserve the right to immediately
terminate the subscription of any TSI subscriber who distributes the TSI
commentaries without our written permission.
More on the "synthetic dollar short" theory
In a very detailed article at http://www.gold-eagle.com/editorials_04/norcini091104.html
Dan Norcini argues, as we have done at TSI on three occasions over the
past six months, that the "synthetic dollar short" theory* doesn't hold
much water. However, although the aforementioned article makes many
good points and arrives at the same conclusion as us we think it misses
the main point and contains a critical error. The error we are
referring to is Mr Norcini's contention that the multitude of dollar
negatives that exist today would prevent the US$ from strengthening if
the US experienced deflation, while the missing main point is that the
probability of the US experiencing genuine deflation (a sustained
contraction in the total supply of money and credit) within the
foreseable future is EXTREMELY low. And by the way, it is absolutely
vital to understand that falling prices are not related to deflation in
any way unless the CAUSE of the falling prices is a contraction in the
total supply of money and credit.
As far as we are concerned there is no question that the US$ would
strengthen and the US$ gold price would weaken if the US experienced
genuine deflation. What must be appreciated is that the US$ is weak due
to inflation and the effects of inflation. For example, the massive US
trade deficit is simply an effect of inflation. Therefore, if the US
moved from inflation to deflation then the factors that have been
pushing the dollar lower would start to diminish and would, if the
deflation persisted, eventually disappear. It is also worth mentioning
that the reduction in the foreign demand for US assets during a period
of dollar deflation would probably be offset by a surge in the demand
for US Government debt. This is because the US Government is an
institution with unlimited access to dollars and, hence, an institution
that will never be unable to meet its NOMINAL dollar obligations. In
other words, under the current monetary system there will never be any
DIRECT default risk in US Government debt, just the risk of indirect
default via inflation, so during a period of genuine deflation the
demand for treasuries would soar.
The important question to ask, therefore, is: What is the probability
of the US experiencing genuine deflation over the next several years?
As explained repeatedly in TSI commentaries over the past 5 years, we
think the probability is close to zero. The reason is that in the
unlikely event of a contraction in US household debt -- we say
"unlikely" because although it is feared that US consumers are now
close to their collective debt limit such fears have emerged during
every decade since the 1950s and yet the total debt has invariably
continued to expand -- the Fed stands ready, willing and able to
monetise anything and everything in order to ensure that the supply of
dollars continues to grow. After all, the Fed, not the US consumer, is
the primary source of inflation (chronic inflation didn't exist in the
US before the Federal Reserve was created).
On a side note, whenever we mention our view that the Fed has the power
to prevent deflation we always receive a few questions along the lines
of "But what about Japan? If a central bank can prevent deflation then
why was the BOJ unable to stop the deflation in Japan during the 1990s?"
Sidestepping, for now, the point that Japan did NOT experience
deflation during the 1990s, the Japanese chose not to go down the path
of massive debt monetisation. Instead, the bad loans were essentially
left in place and government spending programs were implemented with
the aim of stimulating growth. However, based on the way the US
monetary authorities have reacted to every economic/financial crisis of
the past 15 years there should be little doubt that any future debt
problem that poses a serious threat to the US economy will be monetised
out of existence. And that the situation will be handled in this way
regardless of the adverse consequences for the dollar and long-term
economic growth prospects. In any case, we are starting to wonder just
how far the US of today will have to diverge from Japan of the 1990s in
order to bring an end to the idea that the US is following the Japanese
path.
In summary, the main point doesn't revolve around whether the dollar
will strengthen or weaken IF the US enters a prolonged period of
genuine DEFLATION. Instead, it revolves around whether or not the Fed
will remain committed to INFLATION. Our view, as you know, is that it
will.
*"...the
idea is that during a period of intense deflation, American citizens
who have managed to amass significant amounts of indebtedness will
attempt to reduce their debt by selling their goods or possessions in
an attempt to raise cash with which to pay off their debts. This will
result in increased demand for dollars as people will tend to hoard
cash as the deflationary spiral worsens. In a deflationary environment
of falling prices, the purchasing power of the U.S. Dollar will
actually increase since falling prices will allow holders of cash to
actually obtain more goods for the same amount of money. The claim is
that this increased demand for dollars will result in the dollar
actually strengthening much to the consternation and surprise of many
who are expecting a severe decline in the dollar." From "The Synthetic Short Dollar Theory Weighed in the Balance" by Dan Norcini
The shorter the term the greater the uncertainty
The shorter the
timeframe the greater the role played by emotions, technical factors,
news events, and just pure randomness, and the lesser the role played
by valuation. What this means is that on a daily, weekly, or even
monthly basis, the markets can do almost anything.
Long-term trends are, however, dictated primarily by valuation and once
these trends are set in motion they ALWAYS continue until valuation has
reached an extreme. For example, if we accept that the US stock market
embarked on a secular bear trend in 2000 -- and there's a huge amount
of evidence to support the view that it did -- then the trend is not
going to end until the average stock becomes extremely under-valued as
indicated by ratios such as price/sales, price/earnings and price/book.
Similarly, the dollar's long-term downward trend is not going to end
until the dollar has become under-valued as indicated by the US having
a monthly trade SURPLUS. And of course, the direction of gold's
long-term trend will be up as long as the direction of the dollar's
long-term trend is down.
Commodities
Outlook
We are currently long-term bulls on commodities, as we have been for
the past three years, and expect that the CRB Index will move well
above its 1980 peak later this decade. In fact, we think the CRB Index
has a reasonable chance of challenging its 1980 peak by the middle of
next year.
We have, however, been intermediate-term bears on commodities since
early this year. For example, in the 8th March Weekly Update we said:
"...in order for the
overall advance [in commodity prices] to continue it will need to be
punctuated by a multi-month correction; and as far as we are concerned
the most likely time for such a correction is the second and third
quarters of this year. There are three reasons for this. First,
although there is no evidence that peaks are already in place, some
commodities (the industrial metals and soybeans, for example) are
presently making what look like blow-off moves to the upside. Second,
money-supply trends predict a substantial slow-down in US economic
growth over the coming two quarters. Third, the US$ is likely to
experience a substantial rally from whatever low it makes over the
coming 3 months."
We subsequently mentioned a target of 240-250 for the above-cited
correction in the CRB Index, but like the stock market the CRB has been
surprisingly resilient and has simply drifted lower without much
momentum (downward moves have, to date, halted in the 260s). As we
think is also the case with the stock market, IF the CRB is going to
break to new lows for the year then it will need to do so during the
seasonally-weak September-October period. Otherwise, the next breakout
of consequence will probably be to the upside.
Current Market Situation
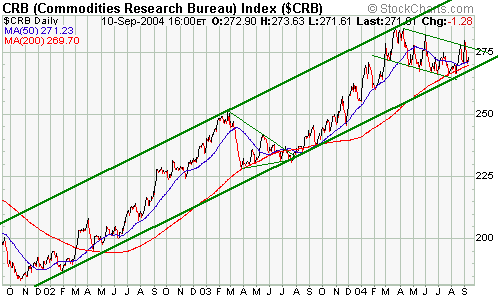
The below chart shows that the CRB Index has climbed higher within the
confines of a well-defined channel over the past three years. Note that
in late February of 2003 the CRB was at the channel top and its 50-day
moving average was well above its 200-day MA, but then a 5-month
consolidation occurred that took the index back to its channel bottom
and the 50-day moving average back to near the 200-day MA. Also, note
that something similar has happened over the past 5 months.
Now, even though we expect the bull market in commodities to continue
for much of this decade it is extremely likely that the CRB Index will
break below its channel bottom at some stage over the next two years.
This is because a channel as steep as this one is unlikely to extend
throughout a secular bull trend. As far as the coming 3-9 months are
concerned, though, an ability to hold within the channel during any
further short-term weakness would be a good sign.
The Stock
Market
The Dow in terms of Gold
In nominal terms the US stock market has oscillated within a trading
range for much of this year following last year's strong upward trend.
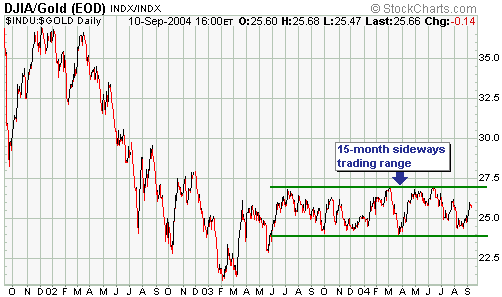
The below chart of the Dow/gold ratio shows that in real terms,
however, it has traded sideways since the middle of LAST year.
Our view is that a recovery high is in place for the Dow/gold ratio and
that when a breakout from its trading range eventually occurs it will
be to the downside. In other words, we expect that if the nominal Dow
Industrials Index makes a new recovery high over the coming 6 months
that most of the gains will be due to inflation and not to any 'real'
progress.
Recovery in housing
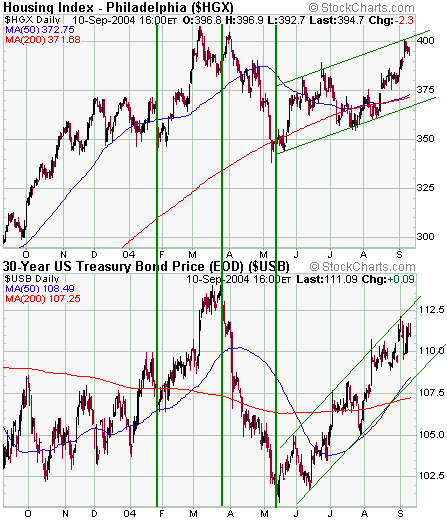
As recently as 6 weeks ago the Philadelphia Housing Index (HGX) -- an
index comprising the stocks of homebuilding companies -- appeared to be
forming a large head-and-shoulders top. However, a strong rebound has
since invalidated the aforementioned topping pattern and resulted in a
move back to near the all-time highs reached earlier this year. When
bearish patterns resolve bullishly it is something worth noting.
As has been the case with other interest-rate sensitive sectors of the
stock market, the key to the recovery in the homebuilding stocks has
been the 4-month rally in the bond market. The below chart comparison
of the HGX and the T-Bond price shows what we mean (it shows that the
HGX and the bond price have been moving in synch with each other).
The upshot is that the interest-rate sensitive sectors of the market
aren't likely to come under much pressure until the T-Bond price drops
below its short-term channel bottom and aren't likely to take-out their
May lows until bonds do the same. This, in turn, suggests that the next
substantial decline in the stock market will be similar to the one that
occurred during April-May in that it will go hand-in-hand with a sharp
fall in the bond market.
By the way, and as we also noted in the Interim Update with reference
to the Dow Utility Average and the Real Estate iShares (two other
interest-rate sensitive sectors), the Housing Index is extended on a
short-term basis and is therefore likely to pullback over the coming
weeks.
Current Market Situation
Over the past few months it has been apparent that the extreme weakness
in the influential and economically-sensitive semiconductor sector
would spread to the rest of the market OR that selling within the
semiconductor sector would dry-up, thus removing the chip stocks as a
source of downward pressure. Judging by the market action over the
final two trading days of last week the latter might have happened.
It's generally not a good idea to get enthused by powerful 1-2 day
advances during bear markets because they happen quite often and are
seldom the precursors to multi-month rallies. However, two things
happened last week to make us seriously consider the possibility that
the semiconductor stocks have bottomed for the year. First, Texas
Instruments, one of the world's largest and most important chip-makers,
reduced its sales forecast and, in response, the stock market bid-up
its shares by 15% over the ensuing two days. This, in turn, was a huge
departure from the market's reactions to previous bad news. Second, the
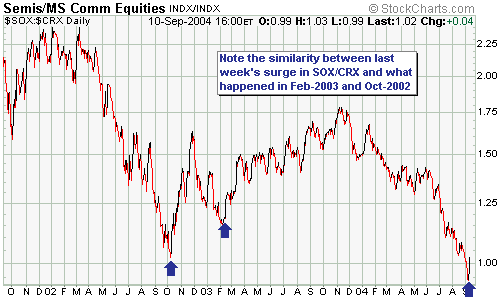
below chart shows that there has just been a large and potentially
significant upward spike in the SOX/CRX ratio (the Semiconductor Index
divided by the Commodity-Related Equities index).
In last week's
Interim Update we spoke of the odds being evenly matched as to whether
a breakout from the market's trading range of the past 6 months would
be to the upside or the downside. However, in light of the
above-mentioned relative strength in the SOX and the fact that the
NASDAQ100 Index has just confirmed the multi-week highs recently
achieved by the S&P500 and the Dow, we now think the odds favour an
upside breakout.
As also discussed in the latest Interim Update, if there is an upside
breakout over the coming few months we think it will result in a
similar outcome to the upside breakout that occurred in November of
1972; that is, it will likely result in a major peak being put in place
within three months of the breakout. Interestingly, 1972 was not only
an election year but was an election year during a secular bear trend
(like now) in which the incumbent Republican president was re-elected
(like now?).
With volatility indices near their lowest levels of the year there's a
good chance of a pullback over the coming 1-3 weeks, but it's now
likely that any pullback will make a higher low. As such, we don't
expect to be recommending any more bearish speculations until at least
the first quarter of next year.
New Investment/Trading Ideas
Our view continues to be that most investors will be best served by
maintaining a high proportion of cash and limiting equity market
exposure to the gold sector and, to a lesser extent, non-gold commodity
stocks. However, it is possible that an intermediate-term rally in
equities commenced last month so those with a 3-6 month timeframe might
consider adding some 'long' exposure to the stock market. In this
respect, one option would be to purchase some exposure to the
semiconductor sector via the Semiconductor HOLDRS Trust (AMEX: SMH).
The 'semis' have been the main recipients of selling pressure over the
past 8 months and are therefore likely to bounce back strongly if
market participants become more willing to take-on risk.
A reasonable approach for speculators interested in playing a
continuation of the recent stock market rebound would be to take an
initial position in SMH near the current level of $30 with the aim of
buying a second position during a pullback over the coming few weeks.
Another option would be to purchase exposure to several Asian stock
markets using various exchange traded funds (ETFs). This is a
speculation that should work well over the next few months if the US
stock market continues to rebound and should also work well for
investors with a 2-5 year timeframe because the Asian markets are
generally supported by attractive fundamentals. Once again, a
reasonable approach would be to take an initial position now with the
aim of averaging in during future weakness.
In one of the next two commentaries we'll present some charts and
discuss the pros and cons of the Asian markets. In the mean time, below
(in no particular order) are some Asian funds that we think look
interesting.
Japan: iShares Japan (AMEX: EWJ)
Malaysia: iShares Malaysia (AMEX: EWM) or The Malaysia Fund (NYSE: MF).
The Malaysia Fund is presently selling at a 7% discount to its net
asset value* and offers a 4% yield.
Taiwan: iShares Taiwan (AMEX: EWT)
India: The India Fund (NYSE: IFN)
Thailand: Thai Capital Fund (AMEX: TF), which is currently selling at a 9.6% discount to net asset value*.
*Note: The discount/premium to net asset value at which an ETF is trading can be found at http://www.etfconnect.com/
This week's
important US economic events
| Date |
Description |
| Monday Sep 13 | No significant events |
| Tuesday Sep 14 | Current Account Balance for Q2 2004
Retail Sales
|
| Wednesday Sep 15 | Industrial Production
|
| Thursday Sep 16 | CPI |
Friday Sep 17
| No significant events
|
Gold and
the Dollar
Current Market Situation
The Dollar
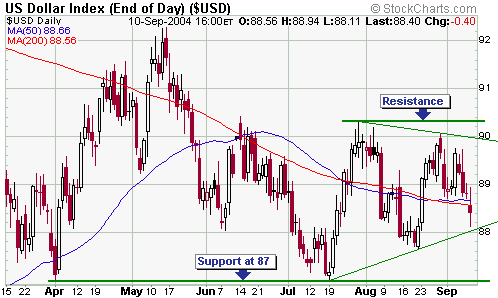
The Dollar Index closed below its 50- and 200-day moving averages on
Friday (see chart below), a modestly bearish development but not
something that has great significance because the dollar has been
oscillating around its 200-day MA since May. In other words, Friday's
action was just a continuation of the pattern of the past several
months.
Critical support for the Dollar Index lies at 87. A daily close below
87 wouldn't negate our intermediate-term bullish view on the dollar but
it would suggest that we were going to get a full test of the February
low (around 84.50) before the next phase of the dollar's recovery got
underway.
So, what would negate our intermediate-term bullish view on the dollar?
Based on the way the currency market has behaved over the past several
months, if we saw evidence that the current dollar-positive TREND in
interest rate differentials had reversed course or that the dollar was
no longer reacting to small changes in short-term interest rates then
we would probably have to abandon our current view. In this regard,
Friday's weakness in the dollar wasn't an issue because what we saw,
once again, was the sort of counter-intuitive response to "inflation"
news that has characterised the currency market over the past 18
months. This, in turn, simply confirms how important small changes in
short-term interest rates (or interest rate expectations) are to
currency exchange rates right now.
To further explain the above comment, a low PPI -- something that most
commentators on the markets and the economy incorrectly consider to be
a sign of low inflation -- should be a POSITIVE for the dollar (the
strongest currencies tend to have the lowest inflation rates). However,
over the past 18 months, and especially over the past 6 months, the
dollar has tended to rise in response to signs of higher inflation and
fall in response to signs of lower inflation. The reason is that few
large traders in the currency markets, including those that are up to
their eyeballs in US$ carry trades, believe that the price indices
reported by the US Government bear any resemblance to reality. Rather,
the significance of the official price indices and other so-called
inflation data is the effect they have on the actions of the Federal
Reserve. In other words, if the US Government reports a low PPI or CPI
it doesn't mean that inflation is low but it could well result in a
slower pace of official rate increases. For the same reason, gold has
tended to rally in response to news of low inflation and fall in
response to news of higher inflation.
Gold
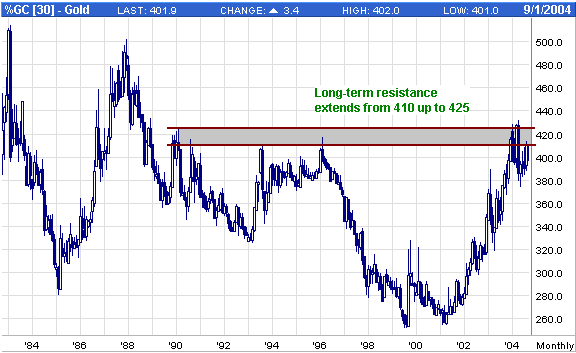
There have been no significant changes in gold's short-term technical
situation over the past week so we've included, below, a long-term
monthly chart of the gold price. The chart shows the long-term
resistance that will need to be decisively breached in order to provide
belated confirmation of gold's secular bull market. It's possible that
such confirmation will occur this month, although the more likely
outcome is that it will occur next year.
Gold Stocks
It was a minor negative that most of the major gold stocks closed near
their session lows on Friday, but apart from that the price action
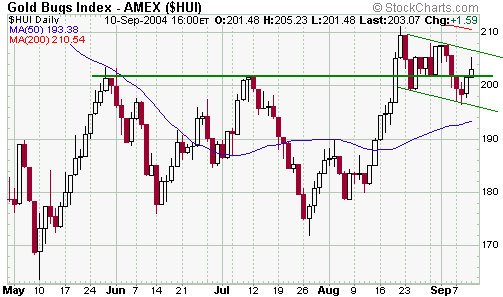
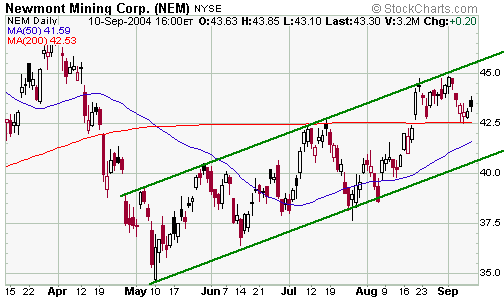
remains quite constructive. For example, the below charts show that the
AMEX Gold BUGS Index (HUI) has spent the past three weeks edging lower
in what looks like a bullish flag while NEM appears to have just
completed a successful 'test' of its 200-day moving average.
We continue to expect
that the HUI will drop back to test its May low during
October-November. It would, however, make sense to us if it first
surged up to around 220, the reasons being that:
a) The chart patterns of both the HUI and the XAU suggest the likelihood of more upside in the near-term
b) The recent consolidation in the gold market has not been accompanied by any weakness in the HUI/gold ratio (see chart below)
c) Sentiment towards gold and gold stocks does not yet appear to be
bullish enough to support a substantial pullback. However, it is likely
that a decisive move by the HUI above its 200-day moving average
(currently at 210.5) would instill the sort of optimism that typically
occurs near a significant peak
Update
on Stock Selections
 In
the 6th September Weekly Update we made the following comment with
regard to the "stop work" directive issued by the Government of Eritrea
to Nevsun Resources (TSX: NSU) and two other companies exploring for
minerals in that country: In
the 6th September Weekly Update we made the following comment with
regard to the "stop work" directive issued by the Government of Eritrea
to Nevsun Resources (TSX: NSU) and two other companies exploring for
minerals in that country:
"The first thing that
occurred to us when we read the above press release was that the
Eritrean Government wanted to 'agree' a higher equity stake in the
projects owned by Nevsun, Sunridge and Sanu (the government is
currently entitled to a 10% stake in Nevsun's Bisha project) and that
the letter instructing the companies to stop work was sent in order to
improve the government's negotiating position. On further reflection,
though, a more likely possibility is that work has been halted due to
security concerns."
If the information in Doug Casey's article at www.321gold.com (http://www.321gold.com/editorials/casey/casey091004.html)
is accurate, and we are not certain that it is, then our first reaction
was the correct one. In any case, as mentioned in last week's e-mail
alert we would not be buyers OR sellers of NSU until more details are
known about the fate of the Bisha project.
With the stock price in the low-C$2.00 area the company's market value
is underpinned by its cash and its development-stage project in Mali.
However, there are a lot of under-valued exploration/development-stage
gold stocks in the world right now, but the one thing that
differentiates NSU from the pack is its Bisha project in Eritrea.
 We
think that averaging down can be a good idea, but only if it is done as
part of a pre-determined strategy. For example, if you plan to invest
$12,000 in a stock via 3 purchases of $4,000 at different times as
opportunities arise then your second and third purchases may well
result in averaging-down your cost per share. Once you have made your
full $12,000 investment, though, we generally wouldn't consider it
prudent to buy more of the stock simply because the stock price drops.
The reason is that an important aspect of good risk management is to
set limits and then stick to those limits. We
think that averaging down can be a good idea, but only if it is done as
part of a pre-determined strategy. For example, if you plan to invest
$12,000 in a stock via 3 purchases of $4,000 at different times as
opportunities arise then your second and third purchases may well
result in averaging-down your cost per share. Once you have made your
full $12,000 investment, though, we generally wouldn't consider it
prudent to buy more of the stock simply because the stock price drops.
The reason is that an important aspect of good risk management is to
set limits and then stick to those limits.
Speaking of averaging down, if you currently don't have a full position
in the stock then now would be a good time to average down in Metallic
Ventures (TSX: MVG). By the same token, if you have no position in the
stock then now would be a good time to start averaging in. There were
fundamental reasons for the sell-off in MVG over the past few months
but the weakness in the stock price appears to be totally out of
proportion to any adverse fundamental developments. This, we think, is
partly due to the general lack of investment demand for junior gold
stocks and partly due to the exit of a large shareholder.
 Due to the addition of Gold Fields Limited (GFI) to the TSI Stocks List
last week we had to change the risk ratings for many of the other
stocks in the List. The reason is that our risk rating is relative,
that is, it doesn't indicate how risky we think a stock is but rather
how risky we think a stock is relative to other stocks in the TSI List.
Therefore, in order to slot GFI into the List with the lowest risk
rating (GFI is a major gold producer with a diverse range of
high-quality gold-producing assets) we had to shift most other ratings
downward one notch.
Chart Sources
Charts appearing in today's commentary
are courtesy of:
http://stockcharts.com/index.html
http://www.futuresource.com/

|

