|
-- Weekly Market Update for the Week Commencing 13th October 2008
Big Picture
View
Here is a summary of our big picture
view of the markets. Note that our short-term views may differ from our
big picture view.
Bonds commenced a secular BEAR market in
June of 2003. (Last
update: 22 August 2005)
The stock market, as represented by the S&P500 Index, commenced
a secular BEAR market during the first quarter of 2000, where "secular
bear market" is defined as a long-term downward trend in valuations
(P/E ratios, etc.) and gold-denominated prices. This secular trend will bottom sometime between 2014 and 2020. (Last update: 22 October 2007)
The Dollar commenced a secular BEAR market during the final quarter of 2000. The
first major downward leg in this bear market ended during the first
quarter of 2005, but a long-term bottom won't occur until 2008-2010. (Last update: 28 March 2005)
Gold commenced a
secular bull market relative to all fiat currencies, the CRB Index,
bonds and most stock market indices during 1999-2001. This secular trend will peak sometime between 2014 and 2020. (Last update: 22 October 2007)
Commodities, as
represented
by the CRB Index, commenced a secular BULL market in 2001. The first
major upward leg in this bull market ended during the second quarter of
2006, but a long-term
peak won't occur until at least 2008-2010. (Last update: 08 January 2007)
Copyright
Reminder
The commentaries that appear at TSI
may not be distributed, in full or in part, without our written permission.
In particular, please note that the posting of extracts from TSI commentaries
at other web sites or providing links to TSI commentaries at other web
sites (for example, at discussion boards) without our written permission
is prohibited.
We reserve the right to immediately
terminate the subscription of any TSI subscriber who distributes the TSI
commentaries without our written permission.
Outlook Summary
Market
|
Short-Term
(0-3 month)
|
Intermediate-Term
(3-12 month)
|
Long-Term
(1-5 Year)
|
Gold
|
Bullish
(30-Jun-08)
|
Bullish
(12-May-08)
|
Bullish
|
US$ (Dollar Index)
|
Neutral
(10-Sep-08)
| Neutral
(22-Sep-08)
|
Neutral
(19-Sep-07)
|
Bonds (US T-Bond)
|
Neutral
(14-Jul-08)
|
Bearish
(22-Sep-08)
|
Bearish
|
Stock Market (S&P500)
|
Neutral
(02-Jun-08)
|
Bullish
(08-Oct-08)
|
Bearish
|
Gold Stocks (HUI)
|
Bullish
(30-Jun-08)
|
Bullish
(12-May-08)
|
Bullish
|
| Oil | Neutral
(03-Sep-08)
| Neutral
(22-Sep-08)
| Bullish
|
Industrial Metals (GYX)
| Neutral
(18-Jun-08)
| Neutral
(22-Sep-08)
| Bullish
|
Notes:
1. In those cases where we have been able to identify the commentary in
which the most recent outlook change occurred we've put the date of the
commentary below the current outlook.
2. "Neutral", in the above table, means that we either don't have a
firm opinion or that we think risk and reward are roughly in balance with respect to the timeframe in question.
3. Long-term views are determined almost completely by fundamentals,
intermediate-term views by giving an approximately equal weighting to
fundmental and technical factors, and short-term views almost
completely by technicals.
Inflation Update
True Money Supply (TMS) was
roughly unchanged during the one-week period ending 29th September (the
latest week for which broad money supply info is available), as was M2.
This surprised us given that the Fed aggressively expanded reserve bank
credit over the same period. It probably means that it will be another
week or two before the broader money supply measures reflect the
dramatic money pumping carried out by the Fed during the final week of
September, but a less likely alternative is that the steps being taken
by the Fed will give a hefty boost to bank reserves while not having
much effect on the total amount of money in the economy.
If the additional money provided by the Fed to financial corporations
under various new funding facilities does not eventually make its way
into the real economy then the new money won't affect prices. This is
one of the arguments currently being made by the deflation forecasters.
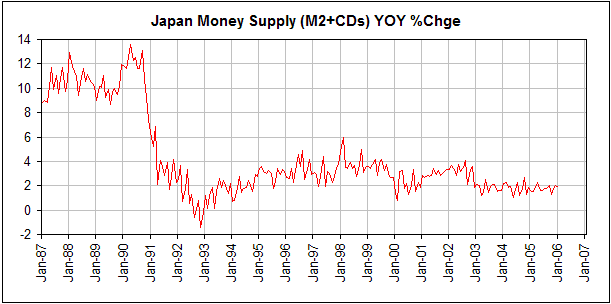
In Japan during the 1990s, for example, the central bank seemed
incapable of promoting much monetary inflation. As evidenced by the
following chart, Japan's year-over-year M2 growth rate plunged during
1990 and then oscillated between 0% and 4% for the next 15 years. There
were times when the Bank of Japan (BOJ) created a lot of bank reserves,
but these additional reserves didn't translate into large increases in
total money supply.
The Fed has already
been far more aggressive on the monetary inflation front than the BOJ
ever was. Moreover, the Fed is not leaving anything to chance in its
efforts to inflate; that is, it is not relying solely on the collective
ability/desire of banks to act as the transmission mechanism for
getting new money into the economy. Instead, via the Commercial Paper
Funding Facility established last week the Fed will soon start
providing new money directly to NON-financial corporations by
purchasing the Commercial Paper issued by these corporations. This will
be separate from, and in addition to, the money pumped into the system
via the other recently established inflation facilities. Also, the US
Treasury has decided to follow the UK's lead and directly purchase the
shares of banks and other financial corporations, despite the fact that
President Hoover tried a similar policy move in 1932 without success.
How will the purchase of these bank shares be financed? Most likely, by
the Treasury providing bonds to the Fed in exchange for newly created
money.
We will be monitoring TMS and M2 more closely than usual over the next
few weeks because the current situation is a good test of our theory
that a motivated central bank will always be able to increase the money
supply (refer to the 29th March 2006 Interim Update for an explanation
of why the BOJ was NOT very motivated to inflate). If, for example, the
Fed were able to push TMS's year-over-year growth rate into double
figures (from its current level of 7%) and keep it there for a few
months despite the credit contraction, then deflation forecasts would
once again have been proven wrong or premature.
The Stock
Market
Panic, or something else?
We sometimes wonder how it is that a market can plunge day after day
after day. You'd think, for example, that by the time the Dow had
fallen from 14,000 to 10,000 almost everyone who was likely to panic
would already have done so, and that the few remaining holdouts would
have immediately exited once psychological support at 10,000 was
breached. And yet, after closing at around 10,300 on Friday 3rd October
with most fear indicators already near historical extremes, the Dow
began to drop at the average rate of 500 points per day for 5 days in
succession, eventually bottoming out (for now) at 7,883 on Friday
morning. When Thursday's session ended with the Dow at 8,579, who could
possibly have been left to panic? In other words, who dumped the large
quantity of shares that caused the Dow to drop by 700 points from
Thursday's close to Friday's low?
The answer is: margin clerks.
It is not so much that people continue to panic day after day after
day, it's that after prices drop a long way the decision of some
shareholders to sell becomes involuntary. Specifically, people who
bought shares using margin will find themselves in the position where
continuing to hold is no longer an option. The decision to sell will,
in effect, be taken out of their hands and put into the hands of others
whose sole concern is that every client always has the requisite margin
within their account. It's part and parcel of the global de-leveraging
process, and it led to a crescendo of selling in the stock market last
week.

Margin clerks
couldn't care less about value, so once margin-related selling begins
to dominate there is no telling how far the market price of a company
will drop below the fair value of its underlying business. That's how
we can end up in the situation where many small companies are being
'valued' by the stock market at less than the amount of cash they have
in the bank, and where many large commodity-producing companies with
rock-solid balance sheets are trading at less than 5-times earnings.
Natural gas producer Chesapeake Energy (NYSE: CHK) is a good example of
a stock whose recent trading has been dominated by margin-related
selling. Furthermore, in this case a lot of the selling has been done
by the company's CEO (refer to http://biz.yahoo.com/ap/081010/chesapeake_energy_ceo_stock.html?.v=2
for details). It seems that Aubrey McClendon, Chesapeake's CEO, had
pledged his 33M-share stake in the company as security for a margin
loan and was forced to liquidate the entire position in response to the
stock-price decline. There is no doubt that McClendon's selling greatly
exacerbated the decline.
In the above-mentioned example, an extremely knowledgeable insider and
a rabid bull on the company's prospects was left with no choice other
than to sell. He made the mistake of buying/holding shares on margin.
Had he been 'unmargined' he could have weathered the storm.
Many similar stories have recently played out across the world of
commodity-related equities, leading to valuations that are now
extremely low. The stage has therefore been set for spectacular
rebounds in the stocks of commodity producers once the broad market
reaches a short-term bottom.
Current Market Situation
That was a week for the record books. For example, the VXO moved above
100 on Friday and ended the week at 86. This was almost double the
previous high of the past 20 years. Also, the number of NYSE stocks
making new 52-week lows on Friday was more than double the highest
level ever recorded prior to last week, and the proportion of stocks
above their 200-day moving averages dropped to 1%.
At Friday's low of 840 the S&P500 Index was down by 23.6% over the
course of the week. It then recovered some lost ground, but still ended
with a weekly loss of 18.2%.
At Friday's low the S&P500 Index was down by 45% from its
October-2007 peak, which means that the current bear market now ranks
with the biggest of the past century.
Taking into account the magnitude of the decline, the length of the
decline and the economic backdrop, the closest parallel with the
present still appears to be 1937-1938. The 12-month decline from the
1937 peak to the 1938 trough amounted to about 50% and proved to be the
first downward leg in a cyclical bear market that wouldn't reach its
ultimate bottom until 1942. (Note: the 1942 low was not far below the
1938 low) The 1937-1942 cyclical bear market was, in turn, the second
and final downward leg in the secular bear market that began in 1929.
So, did the market bottom on Friday?
We don't know. Over the past two decades there have been some very
important turning points between the 9th and the 12th of October, most
notably the end of the 1990 bear market, the end of the 2000-2002 bear
market, and the end of the 2003-2007 bull market, so this would be a
good time for a bottom. However, there is no evidence in the credit and
currency markets that the financial situation is about to become less
stressed. In particular, the 3-month LIBOR -- the rate at which banks
outside the US lend to each other -- ended the week near its high for
the move (4.82%) while the 3-month Treasury Bill yield dropped to
almost zero, reflecting one of the biggest spreads in history between
the short-term borrowing cost of the US Treasury and the short-term
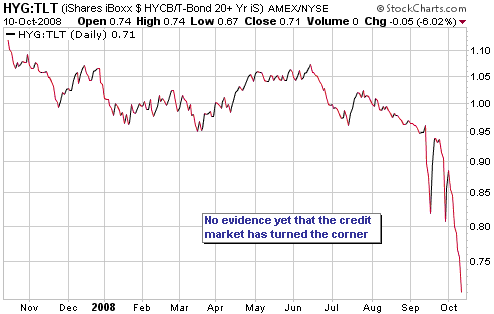
borrowing cost of private banks. Also, the following chart shows that
HYG/TLT, a ratio measuring the level of confidence in corporate debt,
is still in a steep downward trend. Lastly, the Yen and the US$, the
currencies that benefit from the global de-leveraging, were strong on
Friday while the growth-oriented A$ was again very weak.
There's a good chance
that the initial rally following the bottom will be explosive, with the
S&P500 Index gaining 15-20% within the space of two weeks. However,
there's also a good chance that the bottom will be tested before a
multi-month advance gets underway.
Valuations
Despite its recent sharp decline the overall US stock market is still
not genuinely cheap, although valuations are now substantially more
attractive than they have been at any other time over the past decade.
Throughout the world there are, however, many stock markets that are
now genuinely cheap. That is, many markets have reached valuations that
are typically associated with the ends of major bear markets. For
example, the stock markets of Hong Kong, Singapore, France and Germany
now have single-digit P/E ratios and 5%+ dividend yields. At its
current valuation of around 10-times earnings, 6-times cash flow and
1-times book value, Japan's stock market is also very cheap right now.
Earnings will probably be lower over the next 12 months than they were
over the past 12 months; but just as estimates of future earnings
shouldn't be used to justify the high valuations that prevail near the
ends of bull markets, estimates of future earnings shouldn't be used to
justify low valuations near the ends of bear markets. The fact is that
major bear markets end when valuations become low based on historical
earnings.
Cause and Effect, Part 2
In the 29th July Interim Update, under the heading "Cause and Effect", we wrote:
"...it's political
pragmatism, not economic pragmatism that counts in the minds of those
whose overriding goal is victory at the next election; and APPEARING to
do something to help millions of voters will almost always be the
politically astute path even if the 'helpful' actions are likely to
make the economy much weaker in the long run.
Policy-makers generally
won't perceive the need to take drastic actions to help during the
early stages of a bust, partly because they won't have any idea how bad
things are going to get and partly because they will want to create the
impression that the initial signs of weakness constitute nothing more
than a routine correction to an on-going boom. Usually, therefore,
officialdom's initial response to the boom-to-bust transition will be
relatively minor -- designed more to re-energise the boom than to
alleviate the pain of the bust. However, the further the prices of the
former boom-time investments fall and the more obvious it becomes that
a major trend reversal has taken place, the more frantic the actions of
policy-makers will become.
Like market sentiment,
the counter-cyclical actions of policy-makers -- actions taken to
counteract the prevailing cyclical economic/financial trends -- almost
always follow market prices. For example, in the same way that market
sentiment will tend to reach a bearish extreme at an important price
low, the actions of policy-makers will tend to reach fever pitch as the
price approaches the END of an extended decline. When the price
eventually and inevitably reverses upward the illusion is thus created
that the bearish sentiment, or the actions of policy-makers, CAUSED the
reversal. The intrepid policy-makers can then take a bow for having
saved the day, as if the overall market would have gone to zero if not
for their courageous actions."
We are currently witnessing the introductions of new policies on almost
a daily basis in an effort to stem the stock market's decline and
'unfreeze' the credit markets, and it's a virtual certainty that
policy-makers will continue to try new things in an increasingly
frantic manner until something appears to work. However, it should now
be clear to most rational observers that when the immediate crisis
abates and the stock market stabilises it will not be because
policy-makers have "pulled a rabbit out of the hat".
This week's
important US economic events
| Date |
Description |
Monday Oct 13
| No important events scheduled
| | Tuesday Oct 14 | No important events scheduled
| | Wednesday Oct 15
| PPI
Retail Sales
Fed's Beige Book
| | Thursday Oct 16
| CPI
Net foreign purchases of US securities
Industrial Production
Capacity Utilisation
| | Friday Oct 17
| Housing Starts
|
Gold and
the Dollar
Gold
Current Market Situation
The December gold contract keeps testing, and getting repelled by,
resistance at $920. It broke above this resistance early on Friday, but
as soon as it became clear that the breakout was not going to 'stick'
the price dropped quickly.
It is possible that
the gold market will weaken once the immediate financial crisis abates
and the stock market stabilises, although a decline in
safe-haven-related gold buying could be offset by the effect of a
pullback in the US dollar (since the dollar is also likely to weaken
once the immediate financial crisis abates). Once the crisis goes into
remission the gold sector of the stock market should begin to
out-perform gold bullion.
The gold market is in a similar position now to where it was at this
time last week, so we'll repeat the following suggestion from the 6th
October Weekly Update:
"Our suggestion is that
investors use additional weakness over the coming days to add to
positions in physical gold. Specifically, we would be buyers in the
low-800s and, although we don't expect the price to get that low, in
the vicinity of last month's low (around $740)."
The Gold Lease Rate
There has recently been a lot of chatter on the internet about gold
lease rates. As evidenced by the following kitco.com chart, gold lease
rates have risen sharply over the past month.
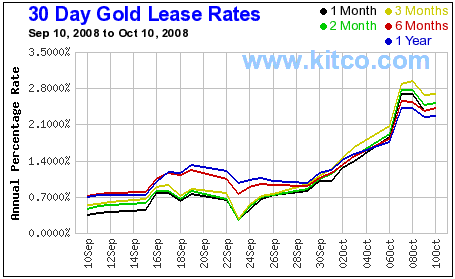
The gold lease rate
should really be called the gold interest rate, because it is the
interest rate charged by central banks for gold loans made to their
bullion-bank customers. The recent surge in the gold interest rate
almost certainly reflects the reduced willingness of central banks to
lend their gold, which, in turn, reflects the reduction in confidence
that is plaguing the entire credit market. Private banks aren't keen to
lend money to other private banks because they are worried about
default risk, and central banks aren't keen to lend gold to private
banks for the same reason. Central banks will happily lend huge
quantities of fiat currency because they can 'print' as much of the
stuff as they want at zero cost, but they are less willing to lend gold
because they can't print gold.
The gold lease/interest rate hasn't featured in our gold market outlook
in the past because it always seemed to us that it didn't have any
predictive ability. The surge in gold interest rates over the past few
weeks tells us that the credit markets are 'freezing up', but we
already know this by following other interest rates.
Apart from telling us what we already know based on other indicators,
what does the recent surge in the gold interest rate mean to us?
First, we don't know what, if anything, it means regarding the likely
future price of gold, although we are quite sure that it doesn't have
bearish implications.
Second, it suggests that central banks have NOT been attempting to
suppress the gold price by increasing physical supply; rather, central
banks appear to have boosted the gold price to some extent over the
past several weeks by removing physical supply from the market.
We will start to pay more attention to the gold interest rate if it
remains near its current elevated level or continues to move higher
after LIBOR begins to trend lower, because such an outcome would point
to a longer-term bullish change in the structure of the gold market.
Specifically, it would suggest that Western central banks were
beginning to view their gold reserves as indispensable insurance rather
than as remnants of a bygone era or assets that should be mobilised to
generate income.
Gold Stocks
Friday was another very disappointing day for those of us who are long
gold stocks, with the HUI dropping like a rock and making a new closing
low for the move. The only positive is that it remained above Monday's
intra-day low.
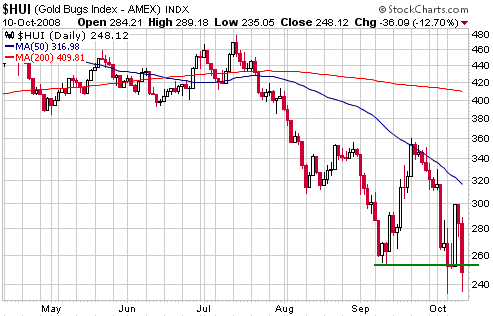
The price action
continues to disappoint while the underlying fundamentals continue to
improve. In particular, the determinant of gold-mining profit margins
is the difference between the gold price and the cost of mining gold,
and this difference is increasing thanks to gold's recent strength
relative to gold-mining inputs. For example, one of the two biggest
costs for most gold mining operations is the cost of energy, and the
following chart of the gold/oil ratio suggests that gold has completed
a major 'double bottom' relative to oil. Our guess is that gold will
gain another 50-100% relative to oil over the coming year in response
to the global slowdown, thus accelerating the upward trend in
gold-mining profit margins.
Gold producers should soon begin to see a bottom-line benefit from
gold's strength relative to other commodities, forcing the stock market
to take notice. We would therefore direct most new buying towards
companies with current production. As noted in last week's Interim
Update: "...the most obvious
candidates for new buying within the ranks of junior and mid-tier gold
stocks are New Gold (AMEX: NGD), Northgate Minerals (AMEX: NXG), and
Western Goldfields (AMEX: WGW). Each of these stocks is very
under-valued and each company has significant unhedged current
production and a strong balance sheet."
The exploration-stage stocks should also benefit because their
gold-in-the-ground will become more valuable, although these stocks
might not do much until after the producers have established upward
trends.

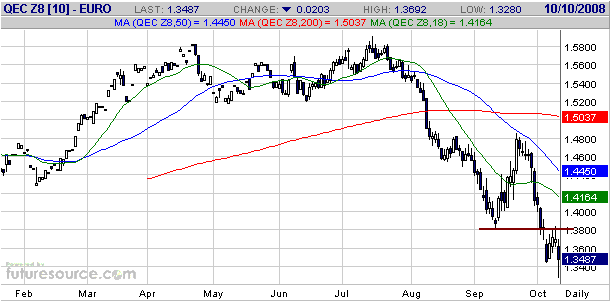
Currency Market Update
Below is a daily chart of December euro futures.
The euro traded at a new low for the year last Friday, although it
managed to end the week slightly above Monday's closing low. A daily
close above 1.38 would suggest that a short-term bottom was in place.
On a very short-term basis the euro is being pressured lower by the
financial crisis and the rush to 'de-lever' associated with the crisis.
It is therefore likely to rebound once the immediate crisis abates.
However, we are not optimistic about the euro's intermediate- or
long-term prospects. There is considerable political risk associated
with both the euro and the US$ due to the actions being taken by
monetary authorities in a desperate effort to restore stability, but
the euro remains over-valued on a purchasing power basis and
encompasses the added risk that some members will decide to break away
from the Monetary Union.
In summary, we think the inflation risk is higher in the US, but this
is offset by the euro's over-valuation and the distinct possibility
that as economic conditions continue to deteriorate the European
Monetary Union will fracture.
For information only:
Late last week we switched about half of our cash reserve from US
dollars to Australian dollars after the AUD/USD rate plunged to the
mid-0.60s. Our plan is to shift this cash back to US dollars following
a rebound in the A$ to the mid-to-high 0.70s. This is not something we
would do in a leveraged way via the futures market because the daily
oscillations are too wild to enable appropriate risk management.
Update
on Stock Selections
(Note: To review the complete list of current TSI stock selections, logon at http://www.speculative-investor.com/new/market_logon.asp
and then click on "Stock Selections" in the menu. When at the Stock
Selections page, click on a stock's symbol to bring-up an archive of our comments on the stock in question)
 Resolute Mining (ASX: RSG). Shares: 278M issued, 280M fully diluted (excluding the current rights issue). Recent price: A$0.74 Resolute Mining (ASX: RSG). Shares: 278M issued, 280M fully diluted (excluding the current rights issue). Recent price: A$0.74
RSG announced on Friday that it was raising about A$50M via a 1-for-3
rights issue at A$0.55/share, with rights to purchase the new shares
being issued to shareholders of record at 20th October (shareholders
will receive one right for every three shares held).
Although RSG will be raising money at a huge discount to recent market
prices for the stock, this method of fund raising does not dilute the
interests of existing shareholders who exercise their rights. This is
actually the fairest way for the company to raise money because
although it reduces the underlying value per share it also allows
shareholders to reduce their average purchase cost by the same amount.
This compares favourably with the equity financings undertaken by most
North American resource companies, which generally involve small groups
of 'preferred' investors being offered cheap shares at the expense of
all other shareholders.
The only problem with the just-announced RSG offering is that the
A$0.55 rights can only be exercised by shareholders with Australian or
New Zealand addresses. Other shareholders will have their rights sold
and receive the proceeds of the sale.
In our opinion, Friday's very negative market reaction to the rights
issue has created another good opportunity to accumulate RSG shares.
RSG is on track to produce 400K ounces of gold next year and 500K
ounces in 2010.
Lion Selection (ASX: LST). Shares: 190M issued, 196M fully diluted. Recent price: A$1.34
Instead of returning cash to shareholders via a simple cash return as
originally planned, LST's management has decided to return the cash via
an off-market buy-back of shares with the purchase price of the shares
being set at a small discount (less than 5%) to net asset value (NAV).
The revised method of returning cash to shareholders is a really bad
idea. The main problem with this new proposal is that the calculated
NAV substantially understates the true value of the company's assets.
This is firstly because the accounting value attributed to the Cracow
gold mine already understated the true value of this asset prior to the
recent huge rise in the A$ gold price and now dramatically understates
the true value. Secondly, the current market value of LST's stake in
Indophil Resources is less than half the value that should eventually
be realised for this asset.
The other problem with the new proposal is that shareholders who want
to receive a cash return will not be able to control how much cash they
get because the amount returned to each shareholder that participates
in the buy-back will be determined by the number of shares offered by
other shareholders. How, then, does a shareholder that wants to retain
a stake in the company decide how many shares to offer as part of the
buy-back plan?
As we said, this is a really bad idea and we will definitely be voting
against it. What the company should do is return the cash that it
currently has to shareholders via a simple cash return, and then return
additional cash in the future as FULL VALUE is realised for its assets.
LST is a buy near its current price (A$1.34) because even though the
published NAV understates the true value of the company's assets, the
current share price is more than 20% below the published NAV.
Chart Sources
Charts appearing in today's commentary
are courtesy of:
http://stockcharts.com/index.html
http://www.futuresource.com/
http://www.kitco.com/

|
