|
-- Weekly Market Update for the Week Commencing
13th October 2014
Big Picture
View
Here is a summary of our big picture
view of the markets. Note that our short-term views may differ from our
big picture view.
In nominal dollar terms, the BULL market in US Treasury Bonds
that began in the early 1980s ended in 2012. In real (gold)
terms, bonds commenced a secular BEAR market in 2001 that will continue
until 2018-2020. (Last
update: 20 January 2014)
The stock market, as represented by the S&P500 Index,
commenced
a secular BEAR market during the first quarter of 2000, where "secular
bear market" is defined as a long-term downward trend in valuations
(P/E ratios, etc.) and gold-denominated prices. This secular trend will bottom sometime between 2014 and 2020.
(Last update: 22 October 2007)
A secular BEAR market in the Dollar
began during the final quarter of 2000 and ended in July of 2008. This
secular bear market will be followed by a multi-year period of range
trading.
(Last
update: 09 February 2009)
Gold commenced a
secular bull market relative to all fiat currencies, the CRB Index,
bonds and most stock market indices during 1999-2001.
This secular trend will peak sometime between 2014 and 2020.
(Last update: 22 October 2007)
Commodities,
as represented by the Continuous Commodity Index (CCI), commenced a
secular BULL market in 2001 in nominal dollar terms. The first major
upward leg in this bull market ended during the first half of 2008, but
a long-term peak won't occur until 2014-2020. In real (gold) terms,
commodities commenced a secular BEAR market in 2001 that will continue
until 2014-2020.
(Last
update: 09 February 2009)
Copyright
Reminder
The commentaries that appear at TSI
may not be distributed, in full or in part, without our written permission.
In particular, please note that the posting of extracts from TSI commentaries
at other web sites or providing links to TSI commentaries at other web
sites (for example, at discussion boards) without our written permission
is prohibited.
We reserve the right to immediately
terminate the subscription of any TSI subscriber who distributes the TSI
commentaries without our written permission.
Outlook Summary
Market
|
Short-Term
(1-3 month)
|
Intermediate-Term
(6-12 month)
|
Long-Term
(2-5 Year)
|
|
Gold
|
Neutral
(03-Oct-14) |
Bullish
(26-Mar-12) |
Bullish
|
|
US$ (Dollar Index)
|
Bearish
(27-Aug-14) |
Neutral
(29-Sep-14) |
Neutral
(19-Sep-07) |
|
US Treasury Bonds (TLT)
|
Neutral
(18-Aug-14)
|
Neutral
(18-Jan-12)
|
Bearish |
|
Stock Market
(DJW)
|
Bearish
(07-Apr-14) |
Bearish
(28-Nov-11) |
Bearish
|
|
Gold Stocks
(HUI)
|
Neutral
(30-Sep-14) |
Bullish
(23-Jun-10) |
Bullish
|
|
Oil |
Neutral
(02-Jun-14) |
Neutral
(31-Jan-11) |
Bullish
|
|
Industrial Metals
(GYX)
|
Neutral
(17-Feb-14) |
Neutral
(15-Sep-14) |
Bullish
(28-Apr-14) |
Notes:
1. The date shown below the current outlook is when the most recent outlook change occurred.
2. "Neutral", in the above table, means that we either don't have a
firm opinion or that we think risk and reward are roughly in balance with respect to the timeframe in question.
3. Long-term views are determined almost completely by fundamentals,
intermediate-term views by
fundamentals, sentiment and technicals, and short-term views by sentiment and
technicals.
Introducing the TSI Blog
The TSI service has gingerly taken a step into the 21st Century
via the creation of a blog. The blog is located at
http://tsi-blog.com/.
The blog was set up for three main purposes. Firstly, for fun.
Secondly, to promote the TSI subscription service. Thirdly and most
importantly, as an avenue for us to make brief comments on
interesting developments/news/other-things that for one reason or
another don't justify TSI commentary space. For example, if we
notice something regarding a market or a non-TSI stock that we think
is noteworthy but not necessarily deserving of coverage in a TSI
newsletter, from now on we'll be able to use the blog to comment.
For another example, we plan to occasionally use the blog to comment
on non-financial topics that aren't appropriate for the newsletter.
Time will tell, but we expect that posting at the Blog will be
irregular. There could be periods when there is a lot going on and
we do a post every day, but our initial goal is to average only two
posts per week, one of which will be a modified short excerpt from a
TSI commentary. Therefore, if you are interested in tracking our
blog posts then the most efficient way to do so is to submit your
email address in the "Follow blog via email" section on the
right-hand side of the page. That way you will automatically be
notified whenever something new is published.
We didn't want the blog to be a blank sheet when it first went
on-line, so as we set it up over the past two months we've been
populating it with modified excerpts from TSI commentaries. That's
why it currently contains about 20 posts dating back to August.
Commodities
Oil
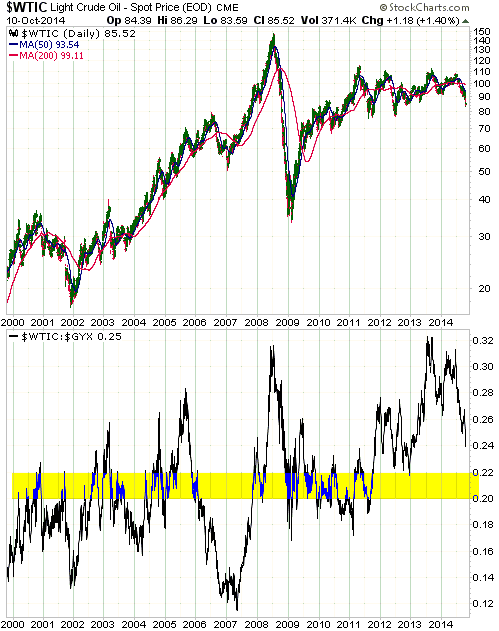
Even though the oil market appeared to be well supplied, prior to the past few
months the oil price had held up remarkably well. Whereas most commodities had
been in downward trends since 2011, the top section of the following chart shows
that the oil price had essentially traded sideways. As illustrated by the bottom
section of the following chart, this resulted in the oil/GYX ratio (oil relative
to industrial metals) hitting a multi-decade high in 2013 and still being near
its multi-decade high in mid-2014. The only way that we could make sense of this
relative strength in the oil price in the face of abundant oil supply was to
assume that the oil price contained a sizable geopolitical risk premium.
Recently, the oil price has fallen sharply in what we consider to be a catch-up
move. The catalyst for the move could be increasing supply from Saudi Arabia,
but the simple fact is that oil's relatively high valuation made it acutely
vulnerable to evidence of increasing supply or falling demand.
Even after its recent substantial weakness, the oil price is still about 10%
above its 15-year average relative to the Industrial Metals Index. Furthermore,
the Industrial Metals Index probably hasn't bottomed.
We suspect that the oil market is close to a short-term bottom, but that it will
fall an additional 10%-20% before making an intermediate-term bottom. However, a
sustained decline below $70/barrel is very unlikely because a lot of the US'
shale-oil production and Canada's oil-sands production would be uneconomic below
$70.
Copper
When the copper price spiked below $3.00 during the first quarter of this year
and then quickly moved back above this long-term support level we thought that
it signaled the end of copper's bear market. The copper price has since remained
above $3.00, but we no longer believe that the bear market is over. Due to the
performances of other commodities and other markets, most notably the gold,
equity and currency markets, it is likely that there will be at least one more
decline to a new multi-year low in the copper market.
Similar to what happened during 2000-2002, copper's final price low is likely to
occur well after gold's final price low. It therefore probably won't be
appropriate to get enthusiastic about copper's intermediate-term upside
potential until after we get definitive evidence that gold has made a sustained
turn to the upside.
 The Stock
Market
The US Market
The S&P500 Index (SPX) ended last week at its 200-day MA and slightly above
important lateral support at 1900. A daily close below 1900 is needed to signal
a short-term top and provide preliminary evidence of a major top.
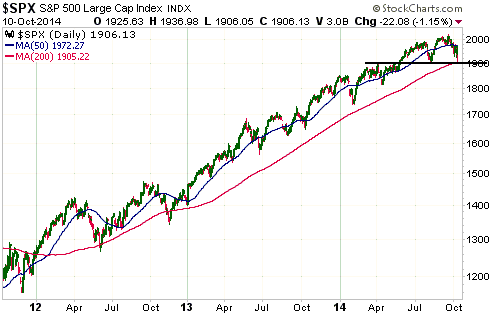
The SPX has not yet done anything significantly bearish, but bearish signals are
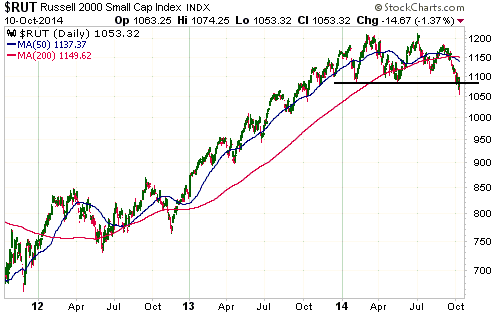
clearly being generated elsewhere. For example, the Russell2000 SmallCap Index
(RUT) has broken below important support defined by this year's lows, which is
preliminary evidence of a major top and a sign that there will be additional
downside of around 10% within the next three months even if a major top is not
in place.
For another example, for the first time in three years the NYSE Composite Index
(NYA) has closed below the low of its preceding short-term pullback. The
quantity of individual NYSE stocks making new 52-week lows also points to a
material difference between the current decline and any of the other declines of
the past three years.
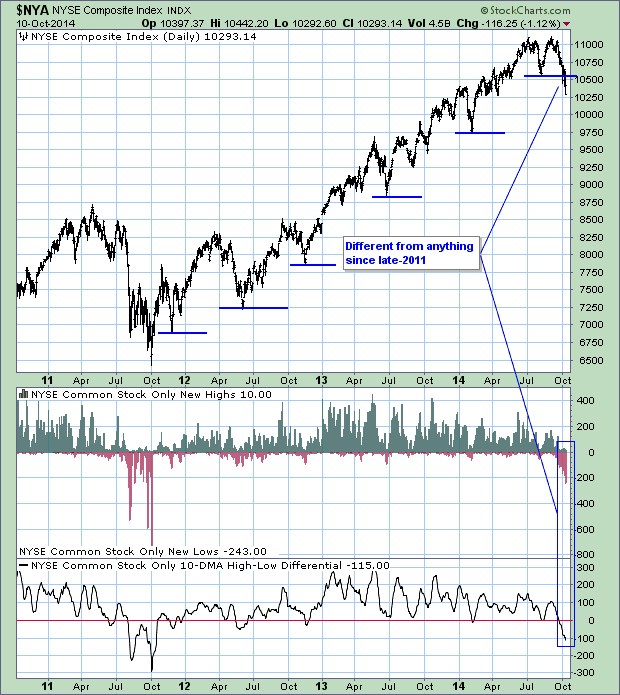
We therefore have preliminary evidence that a bear market has begun and that
additional weakness is likely before a short-term bottom is put in place. At the
same time, the market has fallen far enough over the past few weeks and is now
sufficiently 'oversold' to create the potential for a multi-day rebound.
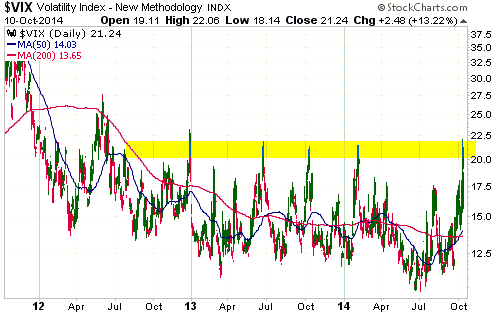
The potential for a multi-day rebound is suggested by the following chart of the
Volatility Index (VIX). The VIX, which tends to move inversely to the S&P500,
has risen to the top of a 2-point range that has limited all of its advances
since mid-2012. This could usher-in some short covering and another round of
'dip buying'.
We'll take the evidence as it comes, but what we would like to see is enough
additional weakness over the days immediately ahead to break the SPX decisively
below 1900 before a short-term bottom is put in place. A 2-4 week rebound to a
lower high in November would then create another good opportunity to establish
or add to bearish speculations.
Small-Cap Canadian Stocks
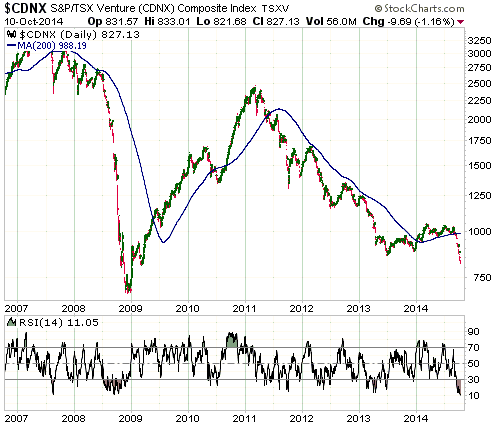
The TSX Venture Exchange Composite Index (CDNX) is a proxy for small-cap
Canadian stocks, especially small-cap resource stocks. The following daily chart
shows that the CDNX has plunged over the past few weeks and is now trading at
its lowest level since early-2009. The chart also shows that the CDNX's daily
RSI is as low as it got during the 2008 crash.
The CDNX appears to be headed for a major bottom during the final quarter of
this year. Bear in mind, though, that a) the 2008 low for the CDNX's RSI
occurred well before the 2008 low in CDNX's price, b) the small-cap stocks
represented by the CDNX will be pressured by tax-loss selling over the final two
months of the year, and c) the gold sector is the only commodity sector that
stands a good chance of bucking a major downward trend in the broad stock
market.
This week's
significant US economic events
(The most important events are shown
in bold)
| Date |
Description |
| Monday Oct 13 |
No important events scheduled
US bond market closed, stock market open | | Tuesday
Oct 14 |
No important events scheduled | | Wednesday
Oct 15 |
PPI
Retail Sales
Empire State Mfg Survey
Fed's Beige Book
Business Inventories | | Thursday
Oct 16 |
Industrial Production
Philadelphia Fed Survey
Housing Market Index
TIC Report
|
| Friday Oct 17 |
Housing Starts
Consumer Sentiment |
Gold and
the Dollar
Gold
Gold's 'fundamentals' are becoming more bullish due to the weakening US stock
market
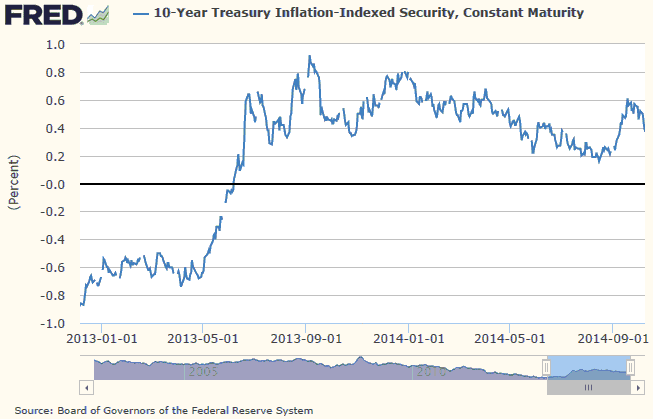
The highest daily close for the S&P500 Index was on 18th September. This was
also a short-term top for the TIPS yield, a proxy for the real interest rate (we
think that the TIPS yield accurately indicates the trend, but not necessarily
the level, of the real interest rate).
Since 18th September the Dollar Index has gained significant additional ground,
but the gold price is roughly unchanged (it was around $1220 then and is around
$1220 now). One reason for gold's ability to hold its ground in the face of a
rise in the Dollar Index is the decline in the real interest rate, which is
linked to the decline in the stock market. This is one specific way in which a
falling stock market can create a more bullish environment for gold.
The following chart shows that the 10-year TIPS yield rose from mid-August
through to 18th September (putting downward pressure on gold) and has since
pulled back a little (providing some support for gold).
Another specific way in which a falling stock market is linked to an
increasingly-bullish environment for gold is that a general decline in equity
prices is often associated with widening credit spreads.
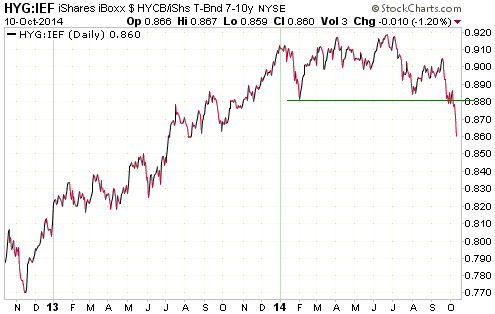
We usually display a chart of the HYG/TLT ratio (junk bonds relative to 20+ year
Treasury bonds) to show what's happening to credit spreads, but in this case
we'll use the HYG/IEF ratio (junk bonds relative to 7-10 year Treasury bonds).
The reason is that whereas the HYG/TLT and HYG/IEF ratios have always trended in
the same direction prior to this year, they diverged during the first half of
this year and during this period the HYG/IEF ratio was the more accurate
indicator of what was actually happening to spreads between high-risk and
low-risk bonds.
The following chart shows that the HYG/IEF ratio has fallen sharply since
mid-September, which is when the S&P500 Index made its peak. A decline in the
HYG/IEF ratio reflects a general widening of credit spreads.
Current Market Situation
Support at US$1180 has held for now, but an upward trend reversal hasn't yet
been signaled. A daily close above $1234 (last week's high) would do it.
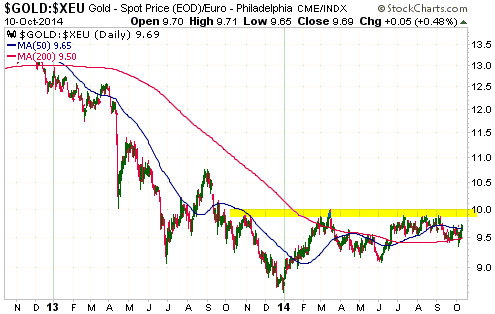
Although the TSI commentaries usually focus on the US$-denominated gold price,
we pay almost as much attention to the euro-denominated gold price (gold/euro).
It's worth pointing out that gold/euro is currently in a very different position
to the US$ gold price. Whereas gold is close to a 12-month low in US$ terms, in
euro terms it is not far from a 12-month high. In fact, it would only take a 4%
rise from here in the euro-denominated gold price to create a major upside
breakout and signal the start of a new bull market for gold in euro terms.
Gold Stocks
Why is gold mining such a crappy business?
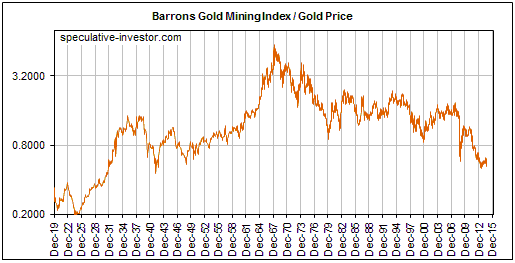
That gold mining has generally been a crappy long-term investment for almost
five decades is evidenced by the following chart. The chart, much of the data
for which were provided by Nick Laird of
www.sharelynx.com, shows the ratio of the Barrons Gold Mining Index (BGMI)
and the US$ gold price from 1920 through to the present*. More specifically, it
shows that, relative to gold bullion, the group of gold-mining stocks
represented by the BGMI has been in a secular decline since 1968 and is now
close to its lowest level since 1948. The question is: Why have gold mining
stocks performed so poorly for so long relative to the metal?
To answer the question we are going to draw on the Keynote speech recently
delivered by Doug Pollitt of Pollitt & Co. at the Denver Gold Forum. A
transcript of the speech can be read -- and should be read by anyone interested
in gold mining investment --
HERE. This speech contains some eye-opening facts about the gold sector's
operational performance and an important insight that, we think, explains why
the gold-mining business has generated sub-par returns over a very long period.
Hint: It isn't because the people who manage gold-mining businesses are, on
average, dumber than the people who manage other commodity-production
businesses.
Before getting to the root cause of the problem it's worth emphasising that the
generally poor long-term performance of gold mining stocks stems from the
generally poor long-term performance of gold mining businesses. In other words,
although the swings in market sentiment are partly responsible for the swings in
the BGMI/gold ratio shown in the above chart and although speculative sentiment
towards gold mining is probably near a low ebb at this time, the lousy
stock-market performance isn't primarily due to excessive pessimism on the part
of share traders/investors. We are, after all, talking about a trend that has
been in place for several decades, not something that just sprung up over the
past two years. Instead, the lousy stock market performance is a rational
response to the lousy returns generated by the underlying businesses. Currently,
for example, with the gold-mining sector near its lowest level since 1948
relative to gold bullion, the stocks of most senior and mid-tier gold producers
don't look cheap based on traditional measures of business health such as
profitability and free-cash-flow generation.
Two pieces of information from the above-linked speech highlight the poor
performance of the gold-mining industry. We are referring to the charts labeled
Figure 9 and Figure 10 on page 5. Figure 9 compares the retained earnings of the
gold sector with the retained earnings of the oil and base-metals sectors, and
indicates that over the past 15 years there were large increases in the retained
earnings of oil and base-metal companies versus almost no increase in the
retained earnings of gold-mining companies. This is despite a huge increase in
the gold price. Figure 10 reveals that the production per share of the gold
mining industry fell by about 35% over the same 15-year period while the
production per share of the oil industry rose by about 30%.
The explanation for why gold mining has been a crappy business was mostly, but
not fully, addressed in the above-linked speech. The rest of the explanation was
provided by Morgan Poliquin, who is one of about three gold-mining CEOs with a
good grasp of economic theory (Morgan is the CEO of Almaden Minerals (AAU)). It
goes like this:
1. Gold is the premier counter-cyclical asset. When the financial/banking system
appears to be in trouble or it is widely feared that central banks are playing
fast and loose with the official money, the stock and bond markets are perceived
to be less attractive and gold-related investments are perceived to be more
attractive.
2. Gold to the stock and bond markets is like an ant to an elephant, so the
aforementioned shift in investment demand results in far more money making its
way into gold-related investments than can be used efficiently.
3. Geology exacerbates the difficulty of putting a flood of new money to work in
an efficient manner in the gold-mining industry, in that lucrative gold deposits
are more difficult to find and are usually not as scalable as, for example,
copper deposits, iron-ore deposits and oil deposits. By "not as scalable" it is
meant that whereas a higher commodity price will often create an opportunity to
expand an existing industrial-metals mine or oil-sands operation, that's usually
not the case with a gold mine.
4. The new money flooding into the gold sector will be attracted to the
companies showing the most growth. Due to the considerable amount of time,
effort and risk involved in finding an economic gold deposit and then developing
it into a mine, the quickest and easiest way to achieve the sort of growth for
which the market brays is via M&A (mergers and acquisitions). However, whenever
there is a surge in M&A activity, many of the purchases and business
combinations will prove to be ill-conceived. Furthermore, the companies with
solid cash-generating operations and high returns on investment that don't play
the 'growth-at-any-cost-by-M&A' game will get swallowed by the companies that
do.
5. The new money flooding into the gold sector will also tend to make large
deposits more desirable, even if the deposits are in risky locations and are
unlikely to ever be economic as a result of their low grades or problematic
metallurgy.
6. Due to the issues noted above, the gold-mining sector experiences a lot more
mal-investment than other commodity sectors. In the same way that the
mal-investment fostered by the Fed's monetary inflation has caused the US
economy to effectively stagnate over the past 15 years, the bad investment
decisions fostered by the periodic floods of money towards gold mining have made
the industry inefficient. Putting it another way, just as the busts that follow
the central-bank-caused economic booms tend to wipe out all the gains made
during the booms, the gold-mining industry experiences a boom-bust cycle of its
own with similar results. The difference is that the booms in gold mining
roughly coincide with the busts in the broad economy.
7. Not coincidentally, the problems for the gold-mining industry began at around
the same time that central banks in general and the Federal Reserve in
particular became free to inflate the money supply and manipulate interest rates
without any rigid restrictions. The time was the early-1970s, when the US$ was
untethered from gold.
Gold producers have taken steps to become more efficient over the past 18 months
and have liquidated many of the mal-investments of the preceding boom. This
paves the way for dramatic strength in the shares relative to the bullion during
at least the first year of the next bull market in gold-related investments, but
it's a virtual certainty that the surging demand for gold during the coming
economic bust will lead to yet another round of massive mal-investment in the
gold-mining industry.
The bottom line is that gold mining is doomed to remain a crappy business as
long as the current monetary system is in place. This means that it will
periodically be the recipient of a flood of new money, prompting a great deal of
unproductive investment and TEMPORARILY generating huge returns for gold-stock
investors.
*The chart uses weekly data since 1960 and monthly data
prior to 1960. Also, the chart uses BGMI data beginning in 1938 and the share
price of Homestake Mining (HM) scaled to the BGMI prior to that.
Current Market Situation
When a deeply 'oversold' market makes a huge single-day upward reversal, the
reversal day could mark an important turning point. It could also be a one-day
wonder -- a ferocious bout of short-covering that does not mark a trend change.
The 'tell' is what happens during the days immediately after the huge single-day
advance. If additional gains are made during the ensuing two trading days then a
short-term trend reversal has probably happened, but if there is no immediate
follow-through to the upside then the trend probably hasn't changed.
Last week there was a spectacular upward reversal in the gold sector on
Wednesday, but there was no follow-through to the upside. This doesn't mean that
a trend change (from down to up) won't be signaled in the very near future. It
means that last week's price action didn't provide us with evidence of a trend
change. To generate such evidence the gold sector needed to add to Wednesday's
gains over the final two days of the week. Instead, it fell on both days.
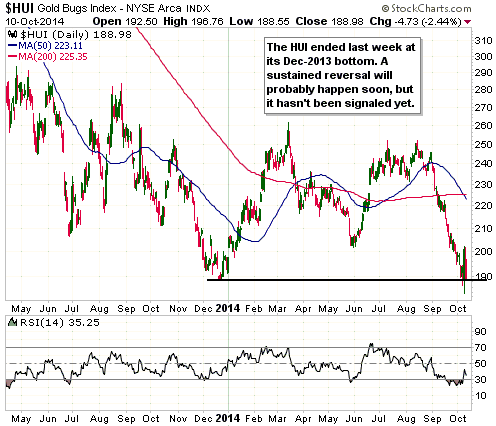
The parameters are clear. A daily close above last Wednesday's high (202.2 for
the HUI, 34.82 for GDXJ) would now be a definitive signal that the gold sector's
short-term trend had reversed. The alternative is probably a slow grind lower to
a bottom (at a new multi-year low) later this month.
Our guess is that even if the US$ gold price is destined to make a new
bear-market low during the first half of next year, the gold-mining sector is
making its ultimate bottom now (meaning: it bottomed last week or will bottom
within the next few weeks). This would be similar to what happened during
2000-2001.
The Currency Market
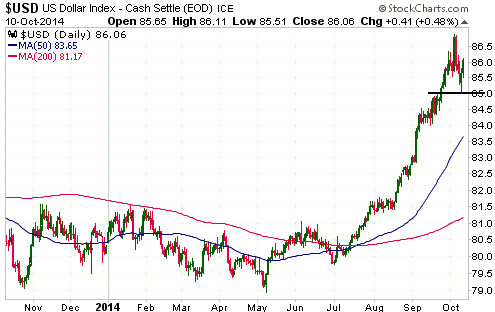
In last week's Interim Update we mentioned that the Dollar Index was beginning
to experience volatility in both directions. This is a sign that a short-term
top is either in place or will soon be put in place. As also mentioned in last
week's Interim Update, a likely short-term downside target for the Dollar Index
-- from the high made during the week before last or a marginal new high in the
near future -- is the 20-week MA, which is rising and will be in the 83.0-83.5
range during the first half of November.
A daily close below 85 would confirm that a short-term top is in place.
The following chart shows the December-2015 Federal Funds Futures (FFF)
contract. This futures contract reflects the market's expectations regarding the
level of the Federal Funds Rate (FFR) at the end of next year, with the implied
yield determined by subtracting the futures price from 100. For example, a
futures price of 99.25 implies an expected FFR of 0.75%. Obviously, the higher
the price of the Fed Funds futures contract, the lower the expected Fed Funds
Rate.
We have three reasons for including this chart. The first is to make the point
that the market's expectations regarding what the Fed will do to interest rates
during 2015 has not shifted by much over the course of this year. Specifically,
the expected level of the FFR in December-2015 has oscillated between 0.85% and
0.55%. The second reason is to show that the big single-day rally in the Dollar
Index on 3rd October in the aftermath of the latest monthly employment numbers
did NOT cause a significant increase in the market's Fed Funds Rate
expectations. As we said last week, the 3rd October surge in the Dollar Index
appeared to be due to speculators milking the dollar's upward trend for all it
was worth (and perhaps creating a short-term peak in the process), not a
fundamental development. The third reason is to show that the powerful
multi-month advance in the Dollar Index that began in July was not driven by
expectations of increasing US interest rates. The fact is that since the
powerful US$ rally began, the expected level of the Fed Funds Rate in
December-2015 has FALLEN from 0.80% to 0.58%. In effect, the market has gone
from expecting three 0.25% rate hikes during the second half of next year to
expecting two 0.25% rate hikes during the second half of next year. As we
explained in the 6th October Weekly Update, the primary driver of the US$ rally
appears to have been relative weakness in European equities due to the fear that
the ECB will fail to provide sufficient monetary stimulus.

It will be important to keep an open mind regarding the Dollar Index's
prospects. The dollar's recent price action suggests that a comparison with
late-1996 to early-1997 could be valid, but in early-1997 the bull market in US
equities still had more than three years to run. Also, at that time interest
rates were much higher across the entire curve (creating the potential for a
significant additional interest-rate decline), debt levels were vastly lower and
the US economy had not been relentlessly pummeled for many years by the most
reckless monetary policy since the mid-1800s. In other words, don't assume that
the US dollar's upward trend has years to run just because a simple chart
comparison shows similarities with 1996-1997.
Updates
on Stock Selections
Notes: 1) To review the complete list of current TSI stock selections, logon at
http://www.speculative-investor.com/new/market_logon.asp
and then click on "Stock Selections" in the menu. When at the Stock
Selections page, click on a stock's symbol to bring-up an archive of
our comments on the stock in question. 2) The Small Stock Watch List is
located at http://www.speculative-investor.com/new/smallstockwatch.html
 Company
news/developments for the week ended Friday 10th October 2014: Company
news/developments for the week ended Friday 10th October 2014:
[Note: AISC = All-In Sustaining Cost, FS = Feasibility Study, IRR = Internal
Rate of Return, MD&A = Management Discussion and Analysis, M&I = Measured and
Indicated, NAV = Net Asset Value, NPV(X%) = Net Present Value using a discount
rate of X%, P&P = Proven and Probable, PEA = Preliminary Economic Assessment,
PFS = Pre-Feasibility Study]
*Dalradian Resources (DNA.TO) announced that it has awarded the
contract for the underground portion of the underground exploration program for
its Curraghinalt gold project (Northern Ireland) to QME Ltd., a local Irish
company. The contract covers preparation of the existing 700-metre adit,
including scaling and removal of train tracks and timber supports, additional
development of approximately 1,000 metres, construction of underground drill
bays, testing of appropriate mining techniques, and removal of a large sample
for metallurgical and other testing. This work is being done as part of a PFS.
According to DNA's press release, QME supplies services to the mining industry
worldwide, including the underground operation at Boliden's Tara Mines Ltd. in
the Republic of Ireland (Europe's largest lead zinc producer). QME's contract
mining division has its own professional management team, in excess of 80
skilled miners and an extensive equipment fleet.
The PFS for the Curraghinalt project is a substantial and costly undertaking
that will take 12-15 months to complete. However, it is fully funded by DNA's
current cash reserves.
*Endeavour Mining (EDV.TO) reported results from exploration
drilling at its Agbaou gold mine in Cote d'Ivoire. The results included many
near-surface intercepts of economic grades over good widths, and suggest that
EDV will be able to expand the reserve base and extend the mine life at Agbaou.
The areas being drilled are immediately adjacent to the North and West pits and
therefore represent similar haulage distances for any reserve that may be
identified in these areas.
If the political situation in Cote d'Ivoire remains stable, Agbaou should be a
"cash cow" for EDV for many years to come.
*Golden Star Resources (GSS) reduced its 2014 gold production
guidance in July, from 300K ounces to 270K ounces. As we noted at the time, this
implied a 71K-oz/quarter run rate during the second half of the year, versus the
63K-oz/quarter run rate achieved during the first half.
Last week GSS reported that it managed to produce only 61K ounces of gold during
the September quarter. Therefore, the December quarter will have to be a
'blockbuster', with production of around 82K ounces, if the reduced 2014
guidance is going to be achieved.
Needless to say, the latest quarterly production result constituted another poor
operational performance from GSS. The good news, according to GSS's press
release, is that production trended upward throughout the quarter, paving the
way for a better performance during the current quarter, and costs are trending
downward.
Until there is clear-cut evidence that the gold price has made a sustained turn
to the upside it will make sense to focus any new buying of gold stocks on the
stocks of well-financed companies with relatively low-cost production (e,g,
EDV.TO, EVN.AX, TGD) and/or the stocks of well-financed
exploration/development-stage companies with projects that appear to be
economically viable at the current gold price (e,g, AAU, AKG, DNA.TO, PG.TO, PVG,
TGM) and/or the stocks of well-financed companies with way-above-average chances
of exploration success (e.g. PLG.TO).
*Sabina Gold and Silver (SBB.TO) provided a progress report on its
engineering and permitting activities at the Back River gold project (Nunavut,
Canada). Here are the main points:
1) The FS is scheduled to be completed during the first half of 2015.
2) Since the completion of the PFS in October of 2013, the resource estimate has
increased due to the incorporation of additional drilling results. This should
enable a longer mine life. Increasing the mine life and/or the annual production
rate could greatly improve the project's economics.
3) Metallurgical testing completed since the PFS has demonstrated average gold
recoveries of 93%, versus the 88% used in the PFS. This should enable more
ounces to be produced at the same total cost.
4) Project permitting is on track and the Final Environmental Impact Statement
("FEIS") is expected to be submitted to NIRB (Nunavut Impact Review Board)
during the third quarter of 2015.
5) The company expects to end 2014 with about $30M of cash and to end 2015 with
about $20M of cash. SBB therefore appears to be fully funded through the
completion of the FS and environmental permitting.
Based on last year's PFS it looked like the Back River project would need a gold
price of $1500/oz to become sufficiently attractive to justify building a mine.
However, the information presented by SBB last week suggests the potential for
the project to become viable at a much lower gold price. We'll see. The proof
will be in the FS.
 List of candidates for new buying
From within the ranks of TSI stock selections, the best candidates
for new buying at this time are:
1) DNA.TO (last Friday's closing price: C$0.63).
2) EDV.TO (last Friday's closing price: C$0.62).
3) PVG (last Friday's closing price: US$4.94).
4) TGD (last Friday's closing price: US$1.23).
5) TGM.V (last Friday's closing price: C$0.32).
Chart Sources
Charts appearing in today's commentary
are courtesy of:
http://stockcharts.com/index.html
http://www.barchart.com/
http://research.stlouisfed.org/

|

