![]()
![]()
![]()
![]()
-- Weekly Market Update for the Week Commencing 13th November 2017
Big Picture
View
Here is a summary of our big picture
view of the markets. Note that our short-term views may differ from our
big picture view.
The BULL market in US Treasury Bonds that began in the early 1980s ended in mid-2016, but there will be many years of topping action in bond prices and bottoming action in bond yields before major new trends get underway. A major decline in government bond prices will unfold during the 2020s. (Last update: 11 September 2017)
The stock market, as represented by the S&P500 Index, commenced a secular BEAR market during the first quarter of 2000, where "secular bear market" is defined as a long-term downward trend in valuations (P/E ratios, etc.), gold-denominated prices and inflation-adjusted prices. This secular trend will bottom in 2020 or later. (Last update: 11 September 2017)
A cyclical BEAR market in the US Dollar began in 2016-2017. (Last update: 11 September 2017)
Gold commenced a secular bull market relative to all fiat currencies, the CRB Index, bonds and most stock market indices during 1999-2001. This secular trend will peak in 2020 or later. (Last update: 11 September 2017)
Commodities,
as represented by the CRB Index, commenced a
secular BULL market in 2001 in nominal dollar terms. The first major
upward leg in this bull market ended during the first half of 2008, but
a long-term peak won't occur until 2020 or later.
(Last
update: 11 September 2017)
Copyright
Reminder
The commentaries that appear at TSI
may not be distributed, in full or in part, without our written permission.
In particular, please note that the posting of extracts from TSI commentaries
at other web sites or providing links to TSI commentaries at other web
sites (for example, at discussion boards) without our written permission
is prohibited.
We reserve the right to immediately
terminate the subscription of any TSI subscriber who distributes the TSI
commentaries without our written permission.
True
Fundamentals Summary
[Notes:
1) The date shown next to the current True Fundamentals Model (TFM) signal is
when the most recent change occurred. 2) Charts of the Gold and Equity
TFMs are included in the "Charts and Indicators" section of the TSI web
site]
| Market | True Fundamentals Model (TFM) |
| Gold (US$ Price) | Bullish (10 Nov 2017) |
| US Equity (SPX) | Bearish (10 Nov 2017) |
| Currency (Dollar Index) | Neutral (27 Oct 2017) |
| Commodities (GNX) | Bullish (05 May 2017) |
Last week's posts at the TSI Blog
The Quantity versus the Austrian Theory of Money
Summary of current
thinking/positioning
1) Thinking that short-term
bottoms for gold and the associated mining indices will soon be in place,
but that the price action has left the door open to a final downward
spike.
2) Expecting some consolidation in the US stock market over
the next few weeks while acknowledging an outside chance that a crash
pattern will form.
3) Expecting additional corrective activity in
the copper market and that a correction will soon begin in the oil market.
4) Thinking that the Dollar Index is on its way to 97 (or
thereabouts), but uncertain as to whether it will get there this month or
during December-January.
5) Thinking that the TLT (a T-Bond proxy)
is forming the 'right shoulder' of a multi-month 'head and shoulders' top
and that the top will be complete by mid-December.
6) Maintaining a
cash reserve of about 30%.
Commodities
Uranium resurgence
In the 30th October Weekly Update, we wrote:
"We have no
interest in owning CCJ [Cameco] as either a long-term or a short-term
trade, but most uranium stocks fell sharply on Friday [27th October] in
sympathy with the CCJ sell-off and are now at levels where only a minor
improvement in sentiment could lead to a large rebound in price. Energy
Fuels (UUUU, EFR.TO) is a good example. As illustrated below, following
Friday's plunge UUUU is near the same price level [US$1.30] at which a
large rebound began at around this time last year.
Uranium remains
'dead in the water' and buying the uranium miners at this time would be an
attempt to 'catch a falling knife', but the situation was very similar at
this time last year -- just prior to the start of a strong rally."
Like last year like this year. Soon after we posted the above comments
a strong rally got underway in the uranium-mining sector. For example, in
the intervening 2-week period UUUU has risen from US$1.30 to US$1.69, or
by 30%. If it continues to follow a similar pattern to last year then a
pullback to the 50-day MA within the next few weeks would set up a new
short-term buying opportunity.
The prices of most uranium-mining stocks have moved sharply upward
over the past two weeks despite the fact that the price of uranium
continues to languish near $20/pound. A similar story (uranium-mining
stocks rocketing upward with no or minimal support from the underlying
commodity) has played out several times over the past five years.
To get something more than a strong 1-3 month rebound in uranium mining
shares there will have to be a sustained rally in the uranium price.
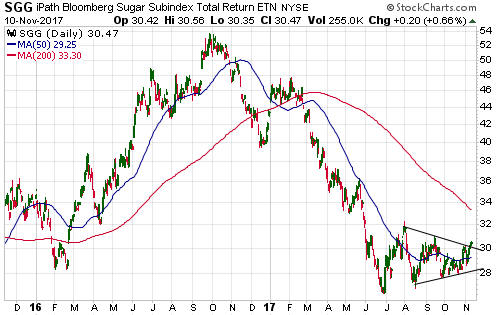
Sugar is in a sweet spot
We don't know
anything about sugar except that it can be bad for the health. We just
wanted to point out that the iPath Sugar Total Return ETN (SGG) is near
its lows of the past 2 years and appears to be breaking upward from a
consolidation/basing pattern. The chart pattern suggests an attractive
risk/reward, especially if risk is limited by placing an initial
daily-closing stop at or slightly below $28.00.
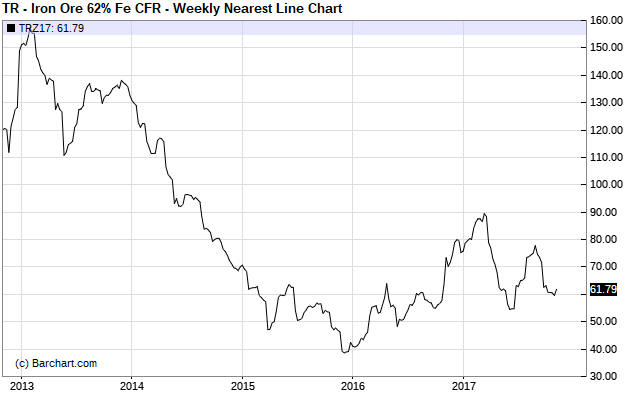
Iron-ore may continue to struggle
The iron-ore
market was very strong last year and during the first two months of this
year, but it has since struggled. There was a substantial pullback from a
February-2017 high to a low in June that was linked to a general commodity
correction, but iron-ore's subsequent upward move has been weak in both
dollar terms and relative to most other industrial metals.
One
reason for the relative weakness is that China's government is getting
more serious about reducing the country's pollution problem and part of
its anti-pollution effort involves closing down steel mills. Less steel
production in China means less iron-ore imported by China. In
October-2017, for example, the amount of iron-ore imported by China was
the lowest monthly quantity since February-2016.
Due to supply
remaining abundant relative to demand, we suspect that iron-ore will
continue to be a relatively weak commodity market over the coming 6
months.
Anticipating the
Fed
In the 21st August Weekly
Update, we wrote:
"The yield on the 3-month T-Bill tracks
changes in the Fed's interest-rate target, but usually with a LEAD. That
is, the T-Bill yield usually adjusts to a new level for the Fed's
interest-rate target in advance of the Fed announcing the change. The
T-Bill yield is therefore a reliable indicator of what the Fed will do at
its next meeting."
And:
"...during the weeks prior
to each of the Fed's rate hikes of the past two years the yield on the
3-month T-Bill yield correctly anticipated the Fed by rising from near the
bottom of the current target range to slightly above the bottom of the new
target range.
Based on this past performance it's reasonable to
expect that the T-Bill yield will rise to about 1.30% before the FOMC
meeting at which the Fed makes its next rate hike."
At the
time of writing the above the T-Bill yield was 1.00%, which was at the
bottom of the current 1.00-1.25% target range for the overnight interest
rates controlled by the Fed. This was a reliable indication that there
would be no Fed rate hike in September.
If the Fed is going to
implement a rate hike at its mid-December meeting then the T-Bill yield
should rise to around 1.30% by early December. As illustrated below, it is
well on the way. In other words, the T-Bill is providing additional
evidence that the Fed will make another rate hike next month.
In
our opinion, the only way that the Fed will not make its next 0.25% rate
hike in mid-December is if there is a 10%+ decline in the S&P500 Index
(SPX) during the intervening period.
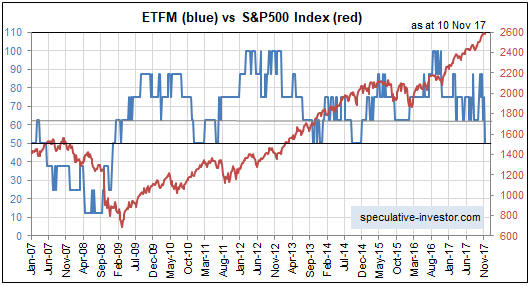
The Stock Market
The Fundamentals
Our Equity True Fundamentals Model (ETFM) shifted from bullish through
neutral to bearish last week. This is the first time it has been bearish
since late-2014.
The current level is a warning that an
intermediate-term correction is coming, but the ETFM is not yet low enough
to warn of a bear market.
Last week's about-face in the ETFM was caused by relative weakness in
the banking sector (indicating declining confidence in the financial
system) and widening credit spreads (indicating declining economic
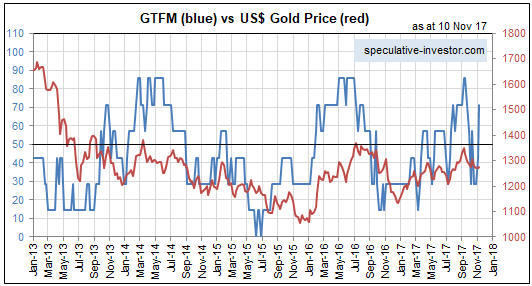
confidence). The same two changes caused our Gold True Fundamentals Model
(GTFM) to shift from bearish to bullish.
The recent relative
weakness in the banking sector is illustrated by the following daily
chart. The top section of this chart shows the Bank Index (BKX), which
dropped sharply to lateral support at around 97.50 last week. The bottom
section shows the BKX/SPX ratio, which is a component of both the ETFM and
the GTFM. Last week this ratio plunged from near a 3-month high to a
7-week low.
Last week's upturn in credit spreads is illustrated by the following
chart of the IEF/HYG ratio (a Treasury ETF relative to a junk bond ETF).
The break above the 40-week MA signaled the trend reversal, but note that
the break was marginal and could be a 'head fake'.
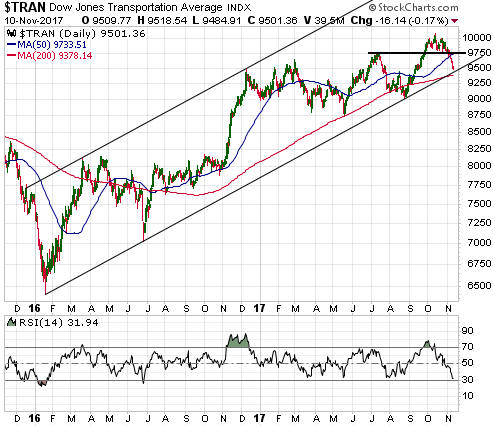
The Price Action
There have been so many
bearish divergences between the Dow Transportation Average (TRAN) and the
senior US stock indices over the past 18 months that proved to be
irrelevant that we hesitate to even mention the one that developed over
the past two weeks, but mention it we will. We are referring to the fact
that while the SPX has just experienced only a minor pullback from its
all-time high and remains 'overbought', TRAN has broken below important
lateral support defined by its July high and is now testing the bottom of
its intermediate-term price channel. A decline of another few percent from
here would be evidence that TRAN's rally from its early-2016 low was over.
Based on the historical record following extremely 'overbought'
conditions, the most likely short-term outcome continues to be a normal
multi-week correction followed by the resumption of the longer-term
bullish trend. A crash is a low-probability but realistic alternative, but
note that crashes don't happen out of the blue. Instead, there is a
particular topping pattern that creates the potential for a crash, with
the actual crash happening 2 months or more after the price top.
This week's
significant US economic events
[Notes:
1) The most important events
(to the markets) are shown
in bold. 2) A list of global economic events can be found
HERE]
| Date | Description |
| Monday Nov-13 | Treasury Budget |
| Tuesday Nov-14 | PPI |
| Wednesday Nov-15 |
CPI Retail Sales TIC Report Business Inventories |
| Thursday Nov-16 |
Import and Export Prices Industrial Production Housing Market Index |
| Friday Nov-17 | Housing Starts |
Gold and the Dollar
The Currency Market
The past fortnight appears
to have been a period of minor correction or consolidation for the Dollar
Index (DX) and the major currencies. The DX has bounced around between 94
and 95.
As long as the DX doesn't close below 94 it will be
reasonable to assume that a quick rise to 96-97 will soon begin. However,
if support at 94 is taken out then the most likely scenario will be that
the anticipated rise to 96-97 has been delayed by a month or so.
Considering the sentiment backdrop, it's unlikely that the US$'s rebound
from its September low is already complete.
Updates
on Stock Selections
Notes: 1) To review the complete list of current TSI stock selections, logon at
http://www.speculative-investor.com/new/market_logon.asp
and then click on "Stock Selections" in the menu. When at the Stock
Selections page, click on a stock's symbol to bring-up an archive of
our comments on the stock in question. 2) The Small Stock Watch List is
located at http://www.speculative-investor.com/new/smallstockwatch.html
![]() Company
news/developments for the week ending Friday 10th November 2017:
Company
news/developments for the week ending Friday 10th November 2017:
[Note: AISC = All-In Sustaining Cost, FS = Feasibility Study, FY =
Financial Year, IRR = Internal Rate of Return, ISR = In-Situ Recovery,
MD&A = Management Discussion and Analysis, M&I = Measured and Indicated,
NAV = Net Asset Value, NPV(X%) = Net Present Value using a discount rate
of X%, P&P = Proven and Probable, PEA = Preliminary Economic Assessment,
PFS = Pre-Feasibility Study]
*Almaden Minerals (AAU)
published its financial statements for the latest quarter, revealing that
the company had about C$17M of working capital at 30th September (C$3M
less than at the end of the preceding quarter). This should be enough to
fund AAU through environmental permitting and FS completion for the
company's flagship Ixtaca gold-silver project in Puebla State, Mexico.
Our guess (the company has not provided estimated completion dates) is
that the FS will be complete and environmental permits will be in place by
mid-2018, paving the way for a takeover bid during the second half of
2018.
*Alio Gold (ALO) advised last month
that it produced 19.5K ounces of gold in the September quarter. This was
less than expected and was therefore slightly disappointing. Last Thursday
it advised that, due to contractor issues that have since been resolved,
production during the December quarter would be only 14K-18K ounces. This
contrasts with the 24K-ounce quarterly average during the first half of
the year.
Much better production results are likely during the
first half of 2018.
Also, ALO reported its financial results for
the September-2017 quarter. The company made a profit of US$5.2M (bringing
its year-to-date profit up to about US$15M), but taking into account the
US$38M equity financing that was completed during the quarter there was a
US$5M reduction in its working capital. There was growth-related capital
spending of about US$7M during the quarter, which means that operations
were cash-flow positive despite the sub-standard production result.
With US$73M of working capital and no long-term debt, ALO's balance
sheet is strong.
*Africa Oil Corp. (AOI.TO)
issued a press release containing an update on its progress.
AOI
has a 25% stake in the development-stage Lokichar Basin in Kenya. Wells
are being drilled to fully define Lokichar's large in-ground oil resource,
with mixed results to date. In particular, two wells drilled during the
first half of this year resulted in discoveries that either expanded or
de-risked the project resource while other wells were dry or encountered
uneconomic amounts of oil.
Production testing will be carried out
during the first half of 2018. The oil produced from testing will be
stored and then transported as part of the Early Oil Production Scheme
(EOPS). This scheme will initially entail the evacuation of stored crude
oil to Mombasa (a coastal city in Kenya, second only to the capital
Nairobi in size) by road. Initial production from the EOPS is expected
H1-2018.
In addition to exploration drilling and production
testing, the Lokichar Basin JV will begin Front End Engineering Design
(FEED) in 2018.
*Blackham Resources (BLK.AX)
was halted from trading all of last week pending the release of
information regarding the company's funding arrangements. The information
will be released on Monday 13th November and should provide additional
details about the debt refinancing announced on 1st November.
*Continental Gold (CNL.TO) published its financial
results for the September-2017 quarter.
CNL is in the process of
building the Buritica gold mine in Colombia. Between now and when
production is scheduled to commence in H1-2020 the company will be
consuming cash at a rapid pace. However, with its existing cash and unused
credit it should be almost fully funded through to production.
At
30th September the company had US$117M of working capital and undrawn
credit of US$225M. In other words, it had US$342M of available liquidity.
This is less than the estimated pre-production capex of US$389M, but up to
US$90M has already been spent.
*Premier Gold (PG.TO)
published its financial results for the September-2017 quarter.
During the quarter the company had earnings of C$3.9M, but the most
important statistic is the change in the net balance-sheet position.
During the course of the September quarter PG's net cash (working capital
minus long-term debt and deferred revenue) decreased by C$5M -- from C$90M
to C$85M. This was a satisfactory result considering that the company
spent C$7M on growth-related investment during the quarter.
PG's
quarterly financial results are going to be lumpy due to big quarterly
swings in the production plan for the South Arturo gold mine in Nevada.
For example, the company's production was 82K ounces in the December
quarter of last year and only 27K ounces in the September quarter of this
year, with both quarterly results being ahead of plan. The average
production during the next few quarters probably won't be much more than
20K ounces due to the temporary cessation of production at South Arturo.
The next important milestone for PG is expected to be completion of
the PEA for the McCoy-Cove gold project in Nevada, which is scheduled to
happen by year-end. This will give the market its first look at the
project's economic potential.
*Petrus Resources
(PRQ.TO) reported its financial results for the September-2017
quarter.
For the quarter the company reported a huge net loss of
around C$50M due almost entirely to an impairment to the accounting values
of non-core assets. At the same time, net debt (long-term debt minus
working capital) dropped from C$136M to C$133M, meaning that the company
added about C$3M of cash to its balance sheet during the quarter.
Quarterly production averaged about 10,500 boe/day, a new record.
The book value per share is now C$4.45, which is $1.02 lower than at the
end of the preceding quarter. The large reduction in book value was due to
the asset impairment.
By increasing production and lowering costs,
PRQ continues to make steady progress at the operational level.
*Solitario Zinc (XPL) published its financial statements
for the September quarter. The statements revealed that at 30th June the
company had no long-term debt and US$15M of working capital (down about
US$1.3M over the 3-month period).
XPL is well positioned with
stakes in two attractive exploration-stage zinc projects. It is also very
under-valued at its current price of US$0.56. As outlined in the 7th
August Weekly Update, we estimate XPL's current value to be US$1.05/share.
*UEX Corp. (UEX.TO) has an 82M-pound in-ground
uranium resource across two projects in Canada's Athabasca Basin -- the
Hidden Bay project, which is 100% owned by UEX, and the Shea Creek
project, which is 49% owned by UEX and 51% owned by Areva. By year-end it
should also have an initial resource estimate for the Christie Lake
Project in the Athabasca Basin.
In a press release last week the
company pointed out that in addition to its uranium assets it owns the
West Bear cobalt-nickel prospect. This prospect was discovered as part of
a uranium-focused exploration program in 2002-2005, but until now has
largely been ignored. It is now getting some attention due to the rapidly
increasing demand for cobalt.
According to the press release: "In
the coming weeks, the Company will be investigating strategic alternatives
to unlock value of the West Bear Co-Ni Prospect for our shareholders."
At this stage we have no idea what value this adds to a UEX share.
![]() List
of candidates for new buying
List
of candidates for new buying
From within the ranks of TSI
stock selections the best candidates for new buying at this time, listed
in alphabetical order, are:
1) AAU (last Friday's closing price:
US$0.92)
2) ALK.AX (last Friday's closing price: A$0.32)
3)
AOI.TO (last Friday's closing price: C$1.57)
4) EGD.V (last
Friday's closing price: C$0.40)
5) USAU (last Friday's closing
price: US$1.27)
The above list is limited to five stocks. It will
sometimes contain less than five, but it will never contain more than five
regardless of how many stocks are attractively priced for new buying.
![]() Updates
to TSI Small Stocks Watch List (SSWL)
Updates
to TSI Small Stocks Watch List (SSWL)
The SSWL is a list
of stocks that are too risky and/or illiquid to be considered for the TSI
Stocks List. We don't track these stocks closely in the TSI commentaries,
but they have favourable risk/reward ratios (high risk versus much higher
potential reward) and could be of interest to speculators who are able to
do their own due diligence. Here are brief updates on the progress of two
members of this list.
1) Artemis Resources (ARV.AX).
Shares: Around 580M. Recent price: A$0.51
We introduced
ARV in the 9th August Interim Update, when it was trading at A$0.14. We
described it as a way of participating -- without paying through the nose
-- in the excitement generated by the belief that Novo Resources (NVO.V)
was on the verge of making a massive gold discovery in the northern part
of Western Australia. ARV is involved in a 50/50 JV with NVO on part of
the territory that potentially contains the discovery and controls a
related land package that is separate from the NVO JV.
Since the
9th August addition of ARV to the SSWL the excitement revolving around
NVO's potential discovery has continued to build. In response, NVO's price
has gained 180% and ARV's price has gained 264%. This means that we
weren't wrong to identify ARV as a reasonable way to participate in the
speculation.
Geological information obtained via NVO's trenching is consistent with
the theory that a massive gold discovery is in the works, but it falls
well short of what's needed to validate the theory and justify NVO's
current C$1.2B market cap. Validation will require extensive drilling,
which is underway.
Including the shares to be issued as part of the
tenement acquisition announced on Friday, we estimate that ARV has about
580M shares outstanding. This gives it a market cap of almost A$300M,
which will turn out to be either very high or very low depending on the
drilling results to be released over the next few months.
2) Northern Empire Resources (NM.V). Shares: Around 60M (including the
current financing). Recent price: C$0.95
NM was introduced
in the 1st May Weekly Update. At that time it was priced at C$0.52, but it
was halted pending completion of an acquisition and when the halt was
removed by the TSXV in early-June it initially traded in the
low-to-mid-C$0.70s. It then traded as low as C$0.60 in August before
beginning to trend upward.
NM has an exceptional management team and owns the Sterling project in
Nevada. This project is a former gold producer and remains permitted for
production. It currently has a 709K-ounce Inferred gold resource that is
relatively high-grade (2.2-g/t average) and heap-leachable. There is
mining infrastructure in place and there is also plenty of exploration
potential.
The company is working towards an expanded resource and
the restarting of production.
The reason for mentioning NM today is
that it is in the process of completing an equity financing that indicates
strong demand for the shares. The financing is in the form of a "bought
deal" that was originally supposed to raise C$10M, but despite the
lacklustre market environment for gold stocks and the fact that the new
shares are priced at a fairly small discount to the 52-week high with no
warrants to sweeten the deal the financing has been upsized to C$13M.
NM shares are still a reasonable speculation, especially if they can
be purchased near the recent financing price (C$0.90) or lower.
![]() Adding
the Alio Gold A-Series warrants (TSX: ALO.WT.A) to the TSI List
Adding
the Alio Gold A-Series warrants (TSX: ALO.WT.A) to the TSI List
In response to the recent weakness in the ALO stock price, the ALO
A-Series stock warrants have dropped to a price area where they are an
interesting, albeit risky, speculation. The warrants have an exercise
price of C$8.00, an expiry date of 20th July 2018, and ended last week at
C$0.125.
We normally wouldn't be interested in taking a new
position in a stock warrant with only 8 months to expiry, but for three
reasons we are making an exception in this case. First, we expect that
H1-2018 will be a bullish period for ALO due to improved operational
performance at the San Francisco gold mine and completion of the FS for
the Ana Paula project. Second, we expect H1- 2018 to be a bullish period
for gold and commodity stocks. Third, although they are currently priced
about 25% above fair value (with the ALO stock price at C$4.50 we
calculate fair value for the warrants to be about C$0.10), the warrants
offer huge leverage to a rebound in the stock price. For example, if ALO
were able to return to its 2017 peak of C$8.00 (see chart below) by
February next year, fair value for the warrants would rise to around
C$1.00.
The warrants are illiquid and should only be traded using limit
orders. With ALO near its current price of C$4.50 it wouldn't make sense
to pay more than C$0.15 for the warrants, and be aware that the price of
the warrants could drop to C$0.10 or lower within the next few weeks if
ALO extends its downward trend.
These warrants are like a
Vegas-style bet, but with a better risk/reward.
Chart Sources
Charts appearing in today's commentary
are courtesy of:
http://stockcharts.com/index.html
http://www.barchart.com/
http://bigcharts.marketwatch.com/