


-- Weekly Market Update for the Week Commencing 14th March 2016
Big Picture
View
Here is a summary of our big picture
view of the markets. Note that our short-term views may differ from our
big picture view.
The BULL market in US Treasury Bonds
that began in the early 1980s ended in early-2015, but there will be many years
of topping action in bond prices and bottoming action in bond yields before
major new trends get underway. (Last update: 29 June 2015)
The stock market, as represented by the S&P500 Index,
commenced
a secular BEAR market during the first quarter of 2000, where "secular
bear market" is defined as a long-term downward trend in valuations
(P/E ratios, etc.) and gold-denominated prices. This secular trend will bottom sometime between 2018 and 2020.
(Last update: 29 June 2015)
A secular BEAR market in the
US
Dollar
began during the final quarter of 2000 and ended in July of 2008. This
secular bear market will be followed by a multi-year period of range
trading.
(Last
update: 09 February 2009)
Gold commenced a
secular bull market relative to all fiat currencies, the CRB Index,
bonds and most stock market indices during 1999-2001.
This secular trend will peak sometime between 2018 and 2020.
(Last update: 29 June 2015)
Commodities,
as represented by the CRB Index, commenced a
secular BULL market in 2001 in nominal dollar terms. The first major
upward leg in this bull market ended during the first half of 2008, but
a long-term peak won't occur until 2018-2020.
(Last
update: 29 June 2015)
Copyright
Reminder
The commentaries that appear at TSI
may not be distributed, in full or in part, without our written permission.
In particular, please note that the posting of extracts from TSI commentaries
at other web sites or providing links to TSI commentaries at other web
sites (for example, at discussion boards) without our written permission
is prohibited.
We reserve the right to immediately
terminate the subscription of any TSI subscriber who distributes the TSI
commentaries without our written permission.
Outlook Summary
Market
|
Short-Term
(1-3 month)
|
Intermediate-Term
(6-18 month)
|
Long-Term
(2-5 Year)
|
|
Gold
|
N/A |
Bullish
(26-Mar-12) |
Bullish
|
|
US$ (Dollar Index)
|
N/A |
Bullish
(29-Feb-16) |
Neutral
(19-Sep-07) |
|
US Treasury Bonds (TLT)
|
N/A |
Bearish
(19-Oct-15)
|
Bearish |
|
Stock Market
(DJW)
|
N/A |
Bearish
(30-Dec-15) |
Bearish
|
|
Gold Stocks
(HUI)
|
N/A |
Bullish
(23-Jun-10) |
Bullish
|
|
Oil |
N/A |
Neutral
(26-Oct-15) |
Bullish
|
|
Industrial Metals
(GYX)
|
N/A |
Neutral
(09-Nov-15) |
Bullish
(28-Apr-14) |
Notes:
1. Our short-term expectations are discussed in the commentaries, but except in
special circumstances we won't attempt to assign a "bullish", "bearish" or
"neutral" label to these expectations.
2. The date shown below the current outlook is when the most recent outlook change occurred.
3. "Neutral" means that we think risk and reward are roughly in balance with respect to the timeframe in question.
4. Long-term views are determined almost completely by fundamentals and intermediate-term views
are determined by a combination of fundamentals, sentiment and technicals.
Last week's posts at the TSI Blog
Bad logic on trade
Brazil Boom and Bust
This week's FOMC
meeting
In the FOMC statement scheduled
for this Wednesday the Fed will likely say that it is taking no immediate action
and that it remains data dependent. Furthermore, the statement will likely be
worded in such a way as to leave open the possibility of a second rate hike as
soon as June.
It is not reasonable to expect the Fed to do/say anything other than what we've
outlined above, but many traders could still have different expectations. How
the markets react to the Fed's announcement will be determined by what most
traders are expecting.
Note that what the Fed says it plans to do over the months ahead and what the
Fed actually ends up doing are unrelated. What the Fed does over the next few
months will mostly be determined by the performance of the stock market.
More leeches!
The euro-zone wrecking-ball
known as Mario Draghi did what he seems to enjoy doing last Thursday and created
a brief period of chaos in the financial markets. In terms of additional
'unconventional'* monetary measures, the ECB did everything that most currency
traders were expecting and then some. The result was a huge intra-day swing in
the euro.
The additional/ramped-up measures comprise a further push into
negative-interest-rate territory (the rate on deposits at the ECB has been
reduced from minus 0.30% to minus 0.40%), an expansion of the asset monetisation
(QE) program from 60B to 80B euros/month, the inclusion of corporate bonds in
the assets to be monetised, and the re-introduction of long-term (4-year)
repurchase operations (LTROs) beginning in June. The rate on the new LTROs can
be as low as the deposit rate (minus 0.40%), which means that the ECB will
simultaneously be charging banks to lend money to the ECB (via deposits, which
are loans) and paying banks to borrow money from the ECB (via LTROs).
Why is the ECB charging banks to deposit money on the one hand and paying banks
to borrow money on the other? That is, why is the ECB transferring money from
one pocket to the other?
The explanation is convoluted. One reason is that the negative interest rate on
deposits imposes a cost on the euro-zone banking system that, as we discussed in
a recent commentary in relation to US bank reserves, cannot be avoided. An
individual bank could avoid or minimise the cost by transferring deposits to
another bank, but the cost cannot be avoided or reduced on an industry-wide
basis. By paying banks to borrow money at the same time as it is charging banks
to deposit money, the ECB is allowing banks to offset the cost of NIRP (negative
interest rate policy).
But why have the NIRP in the first place? What good can possibly come of it?
The answer is that no good can possibly come of it. It is damaging to both the
economy and the financial system. However, this is an example of one
ill-conceived intervention by central planners creating a problem that
necessitates another ill-conceived intervention.
In this case, aggressive central-bank support of government bonds led to many of
these bonds having negative yields, which would have prevented the bonds from
being purchased as part of QE operations. This is due to a guideline that only
bonds that yield at least as much as the deposit rate can be monetised by the
ECB. In other words, earlier ECB actions led to a situation (negative yields on
bonds) that would have greatly limited the ECB's future actions unless the
official deposit rate was set below zero.
As we said, the explanation is convoluted.
The initial reaction of currency speculators to the ECB's new tactics was to
aggressively sell the euro, causing it to plunge 1.6% (an unusually-large
intra-day move by the world's second most important currency). But that was
nothing. The next reaction of currency speculators was to aggressively buy the
euro, causing it to surge by 3.6% from its low. All of this happened within the
space of four hours in the aftermath of the ECB announcement.
Why the sudden turnaround in the euro's exchange rate?
It's likely that speculators first sold the euro on the belief that the
accelerated pace of money-pumping would result in more "inflation" and that the
monetary stupidity was destined to continue unabated, but then bought on the
belief -- based on comments made by Draghi at a press conference -- that the ECB
had effectively gone 'all in' for the time being and would now be on hold for an
extended period.
It seems to us that the 'market' misinterpreted Draghi's press-conference
remarks to mean that the ECB would take no further actions to promote
"inflation", whereas all he actually said was that a further reduction in
interest rates was probably not on the cards. He did not imply that other
pro-inflation measures would not be taken.
In last week's Interim Update we said that the ECB's senior policy-makers, in
looking at the world through a Keynesian lens, were like astronomers trying to
understand the paths of the planets based on the theory that the Earth is the
centre of the universe. Another appropriate analogy is the medical profession's
ancient theory that all manner of illness could be alleviated by applying
leeches to the patient's body. In this case the body is the euro-zone economy
and the leeches are interest-rate suppression and "quantitative easing".
The ECB has been applying the monetary equivalent of leeches in an effort to
cure an illness it does not understand. When the economy fails to respond
positively to the application of leeches, the solution is always: "More
leeches!"
Unless Draghi and his crew of monetary quacks are stopped, eventually there will
be no blood left to suck.
*We placed inverted commas around the word unconventional
because in the realm of monetary policy what used to be called unconventional
has transmogrified into the norm.
The Stock Market
The US
The S&P500 Index (SPX) reached its 200-day MA on Friday 11th March. For the past
few weeks we've viewed the vicinity of the SPX's 200-day MA as the most likely
place for the rally from the January-February double bottom to end, so the fact
that it has moved this high is certainly not unexpected. The challenge is in
figuring out the most probable path from here on.
We'd like to be able to unequivocally state that the stage is now set for the
next bear-market downward leg to begin, but we can't. We can't because although
the market is now 'overbought' on a short-term basis, there isn't yet any
evidence that something more than a routine consolidation lies in the near
future. In particular, market internals and sentiment indicators are currently
not flashing warning signs.
To give you an idea of where we think the market is now positioned, here is a
chart of the NYSE Composite Index (NYA) covering the past 17 years. The red line
on the chart is the 200-day MA and the green arrows mark the tops of the
bear-market rebounds to near the 200-day MA in 2001 and 2008.
The chart shows that, based on the historical record, it was reasonable to
expect a rebound to near (slightly above) the 200-day MA from the
January-February 'oversold' extreme. Also, the chart suggests that if a bear
market is in progress then prices should soon begin rolling over to the downside
without making much additional headway.
Considering the current lack of bearish warning signs in measures of market
breadth and sentiment and the fact that the NYA hasn't quite reached its 200-day
MA, it's unlikely that a strong downward trend will begin immediately. Instead,
the most likely near-term outcome is a form of topping pattern involving a
pullback followed by a marginal new rebound high, with acceleration to the
downside not happening until April or May.
We stress, however, that the short-term risk/reward is now decisively skewed
towards risk and that it is reasonable to view the current strength as an
opportunity to scale into bearish speculations. For one thing, although the
stock indices are probably going to make new rebound highs within the next few
weeks, they probably aren't going to move a lot higher. For another thing,
although the odds favour a topping process over the next few weeks, there is
definitely a risk that the next downward leg begins as soon as this week.
The World
The Dow Jones Global Index (DJW) has almost reached the top of a well-defined
intermediate-term price channel. This means that it isn't just the US stock
market that is probably close to a rebound peak.

This week's
significant US economic events
[Notes:
1) The most important events
(to the markets) are shown
in bold. 2) A list of global economic events can be found
HERE]
| Date |
Description |
| Monday Mar
14 |
No important events
scheduled |
| Tuesday
Mar 15 |
PPI
Retail Sales
Empire State Mfg Survey
Business Inventories
Housing Market Index
TIC Report |
| Wednesday
Mar 16 |
FOMC Announcement
CPI
Housing Starts
Industrial Production |
| Thursday
Mar 17 |
Philadelphia Fed Business
Outlook Survey
Q4-2015 Current Account |
| Friday
Mar 18 |
Consumer Sentiment |
Gold and the Dollar
Gold
The Missing Link
The most important fundamental driver of the gold market that hasn't yet begun
to move in a gold-bullish direction is the US yield curve, represented on the
following chart by the 10yr-2yr yield spread. The yield curve is bullish for
gold when it is getting steeper, as indicated by a rising 10yr-2yr yield spread
(a rising line on the following chart). With the 10yr-2yr yield spread having
recently made a new 8-year low and not yet shown any sign of reversing upward,
the yield curve remains unequivocally gold-bearish.
The yield curve is also one of the most important economic indicators to not yet
warn of a US recession. As pointed out in a recent TSI commentary, it isn't an
inversion of the yield curve (the 10yr-2yr yield spread dropping below zero)
that warns of a recession, it's a trend reversal from flattening to steepening
after the yield-spread has fallen to a multi-year low.
Based on what happened over the past 50 years, a trend reversal in the yield
spread is not a prerequisite for a gold bull market. As long as sufficient other
fundamental drivers (e.g. credit spreads and the real interest rate) are
gold-bullish it is possible for gold to commence a bull market in the absence of
a supportive yield curve. This is exemplified by the bull market that began
during 1976-1977. However, it would be unprecedented for a US recession to begin
in the absence of an upward reversal in the 10-yr-2yr yield spread.
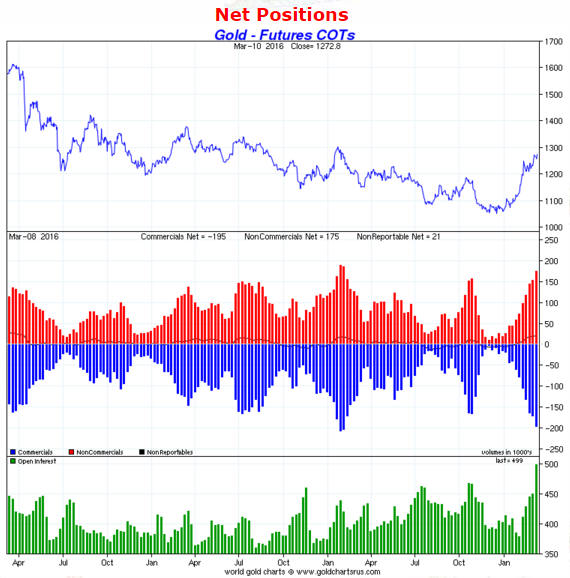
The COT situation is now sounding a loud warning bell
The following chart shows that the total speculative net-long position in COMEX
gold futures moved to near a 3-year high last week. This increases the
short-term downside risk because it means that there is now more scope for long
liquidation by speculators in reaction to a declining price.
As mentioned many times in the past, a drawback of sentiment indicators such as
the COT report is that there are no absolute benchmarks. For example, if a gold
bull market has begun then the speculative net-long position in gold futures
will tend to make progressively higher highs over the coming 1-2 years along
with the price. However, it is still prudent to view a rise in the speculative
net-long position to near the high of the preceding three years as a signal to
be cautious.
Current Market Situation
From last week's Interim Update:
"...a short-term top has still not been signaled. This means that a rise to
$1300-$1308 remains a realistic possibility prior to such a top (a price peak
that holds for 1-3 months).
As noted in earlier TSI commentaries, the first clear sign that a short-term top
was in place would be a daily close below the 20-day MA. This MA is now at $1235
and should be above $1240 by the end of the week.
In addition, the $1240 level is now shaping up to be significant lateral
support, given that the gold price reversed upward on Wednesday following a
decline to slightly above this level. Therefore, over the next few days gold's
position relative to $1240 could also be used to confirm/deny a short-term top.
Specifically, it would now be reasonable to interpret a daily close below $1240
as evidence that the US$ gold price had made a top that will hold for at least a
month."
The price action is becoming increasingly choppy, with a move below $1240 being
quickly reversed on Thursday 10th March and then a move to a new high for the
year being quickly reversed on Friday 11th March. Friday's price action was
obviously a little bearish, but a short-term top still hasn't been signaled.
Until it is there will be a realistic chance of a final surge to resistance at
$1300-$1308, but the probability of this resistance being tested in the near
future diminished last week.
It would be normal for the coming correction to retrace at least half of the
preceding advance, which suggests that there will be a decline to the $1160s or
lower over the weeks ahead IF it turns out that last Friday's intra-day high was
the rally top. However, it will be important to take the evidence as it comes.
In particular, the pace at which speculators liquidate their long positions in
the futures market will provide useful clues regarding the length and magnitude
of whatever correction follows a short-term top.
Gold Stocks
Current Market Situation
Although Friday's new high for the year in the US$ gold price wasn't accompanied
by a new high for the year in the HUI, the gold-mining stocks generally
shrugged-off Friday's downward reversal in the gold price and the HUI/gold ratio
ended the week near a 9-month high. This means that the HUI is still
outperforming gold.
As discussed in last week's Interim Update:
1) A daily close below 160 would indicate that a short-term price top was in
place.
2) Until a short-term top is signaled there will remain a realistic chance of a
surge to a new high for the year, with round-number resistance at 200 probably
defining the maximum upside following a break above the recent high in the 180s.
The HUI's rally from its January-2016 bottom fell behind the pace of the rally
from the Q4-2008 bottom last week, but it is still the second-strongest rally
ever from a multi-year low. This augurs well for the coming 1-2 years, since it
is clear-cut evidence that we have witnessed the start of a bull market rather
than just another bear-market rebound. However, significant corrections occur
within bull markets.
Our concern over the past few weeks was that the HUI had become very stretched
to the upside on a short-term basis. As indicated by the RSI shown at the bottom
of the following weekly chart, it is now also stretched to the upside on an
intermediate-term basis (the weekly RSI just hit its highest level since 2010).
This is a normal occurrence in the early part of a bull market, but it is a
further warning to be prepared for a multi-week correction/decline.
Quarterly Index Changes
The quarterly changes to gold-mining indexes and the associated ETFs become
effective at the end of this week.
Evolution Mining (EVN.AX) is the TSI stock that will probably be influenced to
the greatest extent by these changes, because it is going from 3.93% to 0% of
GDXJ (it is being removed from GDXJ due to the fact that it is no longer a
junior). Consequently, GDXJ will have to sell about 50M EVN shares, which
equates to about 8 days of average trading volume, by the end of the week. This
will naturally put downward pressure on EVN's stock price, although the effect
of GDXJ selling could be partially offset by GDX buying. Unfortunately, we
haven't been able to find out what changes are being made to GDX component
weightings.
Other TSI stocks that could be affected by changes to GDXJ weightings are AKG,
PG, PVG and RSG. In each of these cases the stock price will be helped by GDXJ
buying, but the effect is unlikely to be significant.
The Currency Market
Thursday's dramatic intra-day upward reversal in the euro was driven by hints
that the ECB would not apply additional monetary leeches for at least the next
several months. If you conclude that this is not a solid foundation for a euro
rally, you are right.
The euro's upward reversal from support at 108 last Thursday is short-term
bullish, but the euro's intermediate-term outlook remains bearish due to the
relative weakness over the past 6 months in euro-denominated equities.
Zooming out, 12 months ago the Dollar Index was as 'overbought' as it ever gets.
This created the potential for a major US$ top, but the subsequent sideways move
has fully corrected the 'overbought' condition without doing any technical
damage.
The extent to which the Dollar Index's situation has shifted over the past 12
months is illustrated by the Rate of Change indicator at the bottom of the
following chart. This indicator shows that at around this time last year the
Dollar Index was 25% above its level of 250 days earlier, whereas it is now 3.8%
lower than it was 250 trading days ago. This effectively means that it is down
on a year-over-year basis.
Think back on the extreme US$ bullishness that prevailed 12 months ago. Almost
everyone was convinced that the US$ would continue to rise over the coming 12
months. Instead, it fell. The sentiment extreme has been corrected along with
the momentum extreme, although it is fair to say that there are still a lot more
US$ bulls than US$ bears.
A full correction of last year's US$ sentiment extreme is not going to happen
this year unless there is a decline in the Dollar Index to well below the lows
of the past 12 months, which is very unlikely. More likely is that the
range-trading continues for at least another month, after which the Dollar Index
embarks on its next -- and probably final -- upward leg.
Updates
on Stock Selections
Notes: 1) To review the complete list of current TSI stock selections, logon at
http://www.speculative-investor.com/new/market_logon.asp
and then click on "Stock Selections" in the menu. When at the Stock
Selections page, click on a stock's symbol to bring-up an archive of
our comments on the stock in question. 2) The Small Stock Watch List is
located at http://www.speculative-investor.com/new/smallstockwatch.html
 Company
news/developments for the week ending Friday 11th March 2016:
Company
news/developments for the week ending Friday 11th March 2016:
[Note: AISC = All-In Sustaining Cost, FS = Feasibility Study, FY = Financial
Year, IRR = Internal Rate of Return, MD&A = Management Discussion and Analysis,
M&I = Measured and Indicated, NAV = Net Asset Value, NPV(X%) = Net Present Value
using a discount rate of X%, P&P = Proven and Probable, PEA = Preliminary
Economic Assessment, PFS = Pre-Feasibility Study]
*Energy Fuels (EFR.TO, UUUU) made three notable announcements last
week.
First, it announced that it plans to produce 950K pounds of uranium and to sell
550K pounds of uranium this year. Most of the sales will be into long-term
contracts priced in the high-$50s (the current spot price is below $30) and will
be profitable.
Second, it announced that it sold about 4.4M new shares at US$2.40 (C$3.25) per
share to raise US$10.5M. The news of this low-priced equity financing caused the
stock price to plunge by around 15% last Thursday.
Third, it announced that it is buying Mestena Uranium LLC, a privately held
uranium producer that operates the Alta Mesa ISR (In Situ Recovery) project in
Texas, at a cost of 4.5M EFR shares. Alta Mesa is a fully-permitted production
facility capable of producing 1.5M pounds of uranium per year. It is currently
on standby pending a higher uranium price.
With its White Mesa mill, its Nichols Ranch ISR project and the newly-acquired
Alta Mesa project, EFR will have the ability to ramp up uranium production to
more than 10M-pounds/year once the uranium price moves high enough.
Consequently, it is positioned to be one of the 'go to' uranium stocks during
the next multi-year upward trend in the uranium price. However, it probably
won't be a strong candidate for new buying until there are signs that the
uranium price has turned upward. Given that the uranium price made a new
18-month low last week (see chart below) we are obviously not at that point.
*Energold Drilling (EGD.V) announced an interesting acquisition.
It has agreed to purchase Cros-Man Direct Underground, a small company that
provides horizontal directional drilling services for the telecommunications,
water, sewage, hydro and oil and gas markets in central Canada. According to
EGD's press release: "Cros-Man's primary business involves the trenchless
method of installing cable and piping systems underground in a shallow arc along
a predetermined path, by the use of highly specialised drilling equipment. Over
the past eleven years, Cros-Man has generated an increasing portion of its
revenue from engineering and telecommunications drilling services and also
maintains an ongoing presence in the oil and gas pipeline market in Central
Canada."
Cros-Man is a debt-free growing company that generated $4.7M of revenue in 2015.
The purchase price of $3.5M up front plus about $800K/year for the next three
years therefore looks like a reasonable deal for EGD. The acquisition appears to
be accretive and has the benefit of diversifying EGD's overall business by
adding a segment that doesn't rely on commodity prices.
Despite the long-term upside potential stemming from its low valuation, we view
EGD as more of a hold than a buy at this time.
*Pretium Resources (PVG) reported the sixth set of results from
its infill and stope-definition drilling program. The latest batch of results
included four intersections of greater than 1,000-g/t gold over narrow (0.5m)
widths.
This program, which is scheduled to be completed in Q2-2016, has thus far
generated results from 186 holes with 29 intersections grading more than
1,000-g/t gold. According to PVG's management, it is achieving its intended
purpose of increasing confidence in the resource model and assisting with
planning the first three years of production.
With the completion of the recent $133M equity financing (the initial $120M
financing plus the exercising of the underwriters' $10M over-allotment option
plus the exercising by Orion Mine Finance of its proportionate ownership
entitlement), PVG is fully funded through to production in late-2017.
Unfortunately, there will continue to be uncertainty regarding the validity of
the resource estimate and the mining plan until after the project goes into
production.
List
of candidates for new buying
From within the ranks of TSI stock selections the best candidates for new buying
at this time, listed in alphabetical order, are:
1) FCG, with a sell stop at $4.06 if buying for a short-term trade (last
Friday's closing price: US$4.39)
2) PRQ.TO (last Friday's closing price: C$2.80)
Note that the above list is limited to five stocks. It will sometimes contain
less than five, but it will never contain more than five regardless of how many
stocks are attractively priced for new buying.
The
FCG (Natural-Gas Equity ETF) Trade
FCG was extremely volatile over the first two days of last week, first surging
to a new high for the year and then plunging to support in the low-$4 area. At
this stage the sharp decline on Tuesday 8th March looks like a routine pullback
within a short-term upward trend, but a decline to below the 8th March low would
suggest that a short-term top was in place.
Consequently, the FCG trading position will be removed from the TSI List if FCG
trades below last Tuesday's low of 4.07 within the next two weeks. In setting
this 'stop' we are ensuring that the worst-case result for this trade will be a
profit of 15%.
The trading position will also be removed from the TSI List if FCG moves up to
$5.60 within the next two weeks, because at that price the short-term
risk/reward would no longer justify the position.
XME
put-option suggestion
XME, an ETF that tracks the S&P Metals and Mining Index, has rocketed upward
since bottoming in January. According to its daily RSI(14), which is shown at
the bottom of the following chart, it recently reached its most 'overbought'
level of the past few years. It is also close to important lateral resistance at
$20.
The price action suggests the potential for a rise to a new high for the year
this week, but the short-term risk/reward is now decisively skewed towards risk.
Even if a bull market has begun it would be normal for this ETF to retrace at
least half of its January-March rally before resuming its advance.
Our intention at this time is that for TSI record purposes, QID July call
options will be the exclusive focus of a short-term stock market bearish
speculation. However, we wanted to point out that XME put options now look
interesting, either as a hedge for anyone with long positions in
commodity-related equities or as an outright bearish bet.
We bought a small position in XME June-2016 $16 put options for our own account
last Friday and will possibly add to the position if XME becomes even more
extended to the upside over the days/weeks ahead.
Chart Sources
Charts appearing in today's commentary
are courtesy of:
http://stockcharts.com/index.html
http://www.sharelynx.com/
http://www.barchart.com/
