|
-- Weekly Market Update for the Week Commencing
14th April 2014
Big Picture
View
Here is a summary of our big picture
view of the markets. Note that our short-term views may differ from our
big picture view.
In nominal dollar terms, the BULL market in US Treasury Bonds
that began in the early 1980s ended in 2012. In real (gold)
terms, bonds commenced a secular BEAR market in 2001 that will continue
until 2018-2020. (Last
update: 20 January 2014)
The stock market, as represented by the S&P500 Index,
commenced
a secular BEAR market during the first quarter of 2000, where "secular
bear market" is defined as a long-term downward trend in valuations
(P/E ratios, etc.) and gold-denominated prices. This secular trend will bottom sometime between 2014 and 2020.
(Last update: 22 October 2007)
A secular BEAR market in the Dollar
began during the final quarter of 2000 and ended in July of 2008. This
secular bear market will be followed by a multi-year period of range
trading.
(Last
update: 09 February 2009)
Gold commenced a
secular bull market relative to all fiat currencies, the CRB Index,
bonds and most stock market indices during 1999-2001.
This secular trend will peak sometime between 2014 and 2020.
(Last update: 22 October 2007)
Commodities,
as represented by the Continuous Commodity Index (CCI), commenced a
secular BULL market in 2001 in nominal dollar terms. The first major
upward leg in this bull market ended during the first half of 2008, but
a long-term peak won't occur until 2014-2020. In real (gold) terms,
commodities commenced a secular BEAR market in 2001 that will continue
until 2014-2020.
(Last
update: 09 February 2009)
Copyright
Reminder
The commentaries that appear at TSI
may not be distributed, in full or in part, without our written permission.
In particular, please note that the posting of extracts from TSI commentaries
at other web sites or providing links to TSI commentaries at other web
sites (for example, at discussion boards) without our written permission
is prohibited.
We reserve the right to immediately
terminate the subscription of any TSI subscriber who distributes the TSI
commentaries without our written permission.
Outlook Summary
Market
|
Short-Term
(1-3 month)
|
Intermediate-Term
(6-12 month)
|
Long-Term
(2-5 Year)
|
|
Gold
|
Bullish
(26-Mar-14) |
Bullish
(26-Mar-12) |
Bullish
|
|
US$ (Dollar Index)
|
Neutral
(26-Mar-14) |
Bearish
(27-Jan-14) |
Neutral
(19-Sep-07) |
|
Bonds (US T-Bond)
|
Bullish
(11-Dec-13)
|
Neutral
(18-Jan-12)
|
Bearish |
|
Stock Market
(DJW)
|
Bearish
(07-Apr-14) |
Bearish
(28-Nov-11) |
Bearish
|
|
Gold Stocks
(HUI)
|
Bullish
(03-Mar-14) |
Bullish
(23-Jun-10) |
Bullish
|
|
Oil |
Bearish
(12-Mar-14) |
Neutral
(31-Jan-11) |
Bullish
|
|
Industrial Metals
(GYX)
|
Neutral
(17-Feb-14) |
Neutral
(06-Jan-14) |
Neutral
(11-Jan-10) |
Notes:
1. The date shown below the current outlook is when the most recent outlook change occurred.
2. "Neutral", in the above table, means that we either don't have a
firm opinion or that we think risk and reward are roughly in balance with respect to the timeframe in question.
3. Long-term views are determined almost completely by fundamentals,
intermediate-term views by
fundamentals, sentiment and technicals, and short-term views by sentiment and
technicals.
US Monetary Inflation
Update
On the US monetary inflation front, the news
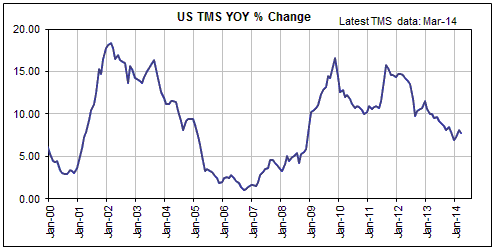
is that there isn't much in the way of news. As depicted below, the
year-over-year rate of TMS (True Money Supply) growth hit a 5-year low of around
7% at the end of last year and has since edged a little higher.
There are only two ways that money can be added to the US money supply. The
first is via Fed asset monetisation, which is how most new US dollars have come
into existence since September of 2008 and how almost all new US dollars came
into existence last year. The second is via commercial-bank credit expansion.
This is how almost all new US dollars came into existence for decades prior to
September of 2008.
The Fed began to reduce the rate at which it creates new dollars a few months
ago and plans to turn off its 'money pump' before the end of this year. We think
that by July-August of this year the Fed will be sufficiently worried about how
the stock market and the economy are faring to prematurely end its "QE
tapering", but in the meantime there will be a further scaling-down of the Fed's
so-called "monetary accommodation". This suggests that the US monetary inflation
rate will drop below last December's multi-year low within the next three months
unless the commercial banks ramp-up the rate at which they lend new money into
existence or monetise securities.
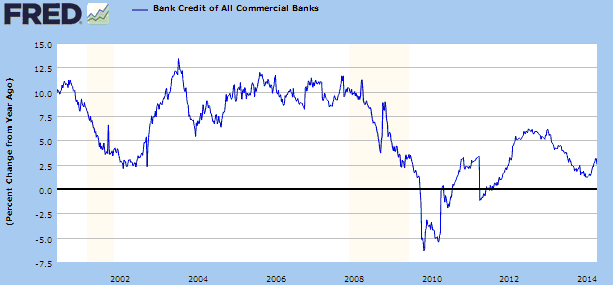
The up-tick at the end of the following chart (the chart shows the
year-over-year rate of growth in US commercial bank credit) indicates that
US-based commercial banks collectively boosted their rate of credit expansion
during the first quarter of this year. Note, though, that during the 50 years
prior to 2008 the rate of growth in commercial bank credit was never
significantly lower than it is right now. In other words, the recent bounce is a
bounce from an extremely low level to a level that is, by historical standards,
still very low.
Is it likely that US commercial banks will increase the rate at which they
expand credit by enough to fully offset the reduced rate of the Fed's
money-pumping?
Before answering the above question we'll reiterate a point we've made in
previous commentaries over the years, which is that if the commercial banks do
begin to expand credit at a faster pace it won't be due to their huge quantity
of excess reserves. The reason is that there isn't now, nor has there been for
at least the past four decades, any relationship between US bank lending and US
bank reserves. (Hopefully, the writers of economics textbooks will figure this
out within the next couple of decades and remove references to the fictitious
"money multiplier").
Whether or not the US banking industry expands credit is determined by its
collective balance sheet, risk aversion, and ability to find borrowers that are
both willing and qualified. The quantity of reserves doesn't come into it.
Consequently, just as having almost no reserves didn't prevent the commercial
banks from massively expanding credit during 1995-2007, having massive excess
reserves has not prompted the banks to become aggressive credit-creators over
the past five years and will not cause the banks to ramp-up the pace of their
credit expansion in the future.
So, a bet that the commercial banks are about to increase the pace at which they
expand credit is a bet that they a) have sufficient balance-sheet strength to
support greater leverage, b) are about to become less risk averse, and c) will
soon be presented with a growing pool of borrowers that are both willing and
qualified. This is not a bet that we would currently make. Our best guess,
therefore, is that the US monetary inflation rate will gradually work its way
lower until the Fed reverses course.
The Commodity Theme
Market prices continue to substantiate the view
that one of 2014's big themes will be relative strength in commodities and
commodity-related investments. For example:
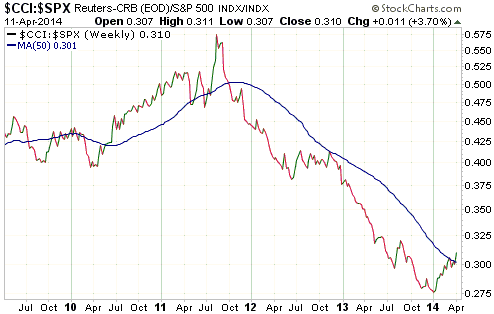
1) The following chart shows that the CCI/SPX ratio (the Continuous Commodity
Index relative to the S&P500 Index) has just achieved a weekly close above its
50-week MA (the blue line on the chart). This is important because, as explained
in the 26th February Interim Update, all counter-trend rebounds during the
cyclical CCI/SPX declines of 1995-1999 and 2011-2013 ended at or below the
50-week MA, with the first weekly close above the 50-week MA during the
late-1990s signaling that the bottom was in.
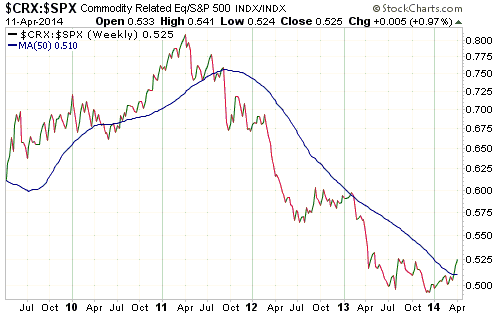
2) The next chart shows that it is a similar story with the CRX/SPX ratio (the
Commodity-Related Equities Index relative to the S&P500 Index). The CRX/SPX
ratio has just achieved the first decisive weekly close above its 50-week MA
since July of 2011.
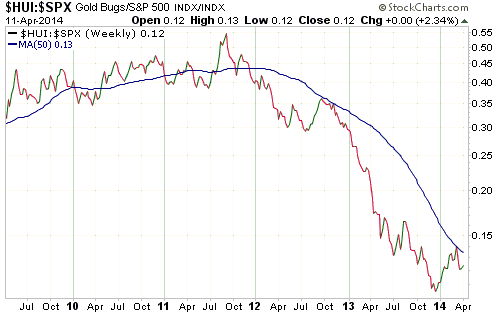
3) Like the CRX/SPX ratio, the HUI/SPX ratio (the gold-mining sector relative to
the overall stock market) reversed upward late last year. The HUI/SPX ratio
hasn't yet been able to break above its 50-week MA (see chart below), but this
is mainly because its rally began from further below the MA.
It's just a matter of time (probably no more than one month) before the HUI/SPX
ratio breaks above the 50-week MA.
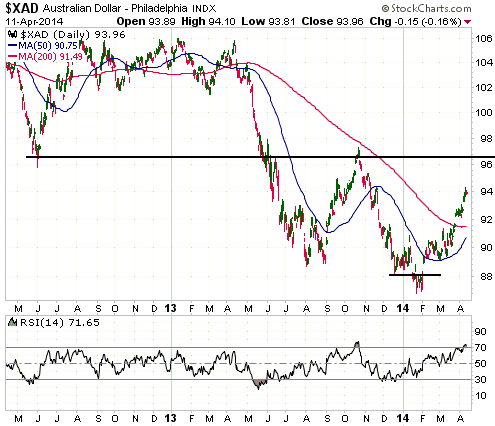
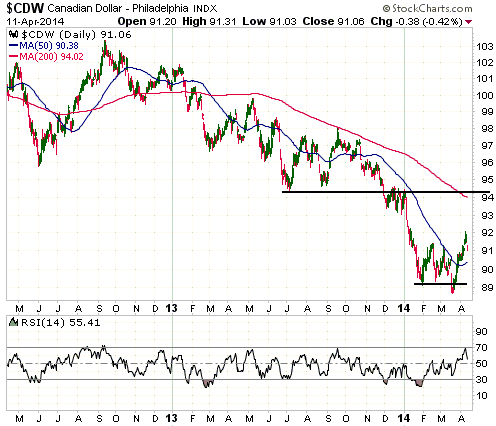
4) Upward reversals in the senior commodity currencies (the A$ and the C$)
followed the upward reversals mentioned above and provided additional evidence
in support of the commodity-strength theme. Interestingly, this year's rebound
in each of the senior commodity currencies was initially signaled by a false
downside breakout.
The A$ is now short-term 'overbought' and will probably soon begin to
consolidate the substantial gain it made over the past 2.5 months. Note that a
routine pullback would take it down to support at 91.5-92.0 and that resistance
at 96-97 will be a realistic short-term upside target following a pullback.
The C$ has not yet become short-term 'overbought', but could still pull back
enough to provide the next reasonable entry point for a 'long' position. We
doubt that there will be another opportunity in 2014 to buy the C$ below 90 (the
price area in which we suggested buying on a few occasions during the first
quarter of this year), but we won't be surprised if there is an opportunity to
buy at around 90.5.
 The Stock
Market
While a bear market in US equities might
be just beginning, another bear market might have just ended
As we noted at TSI at the time, when EEM closed above $39.50 and reversed upward
relative to the SPX in late March it was a signal to step away from
emerging-market-related bearish speculations. Even if EEM's cyclical bear market
was still in progress, the price action during the final week of March suggested
that significant short-term upside was in the works.
The following chart shows that EEM has continued upward in both dollar terms and
SPX terms, but this is where it gets interesting because EEM is now testing the
top of its long-term trading range. If the cyclical bear market is still in
progress then this is where the rally should end. The alternative is that the
bear market is over and EEM will break out to the upside in the immediate future
or after some consolidation in the $40-$42 range.
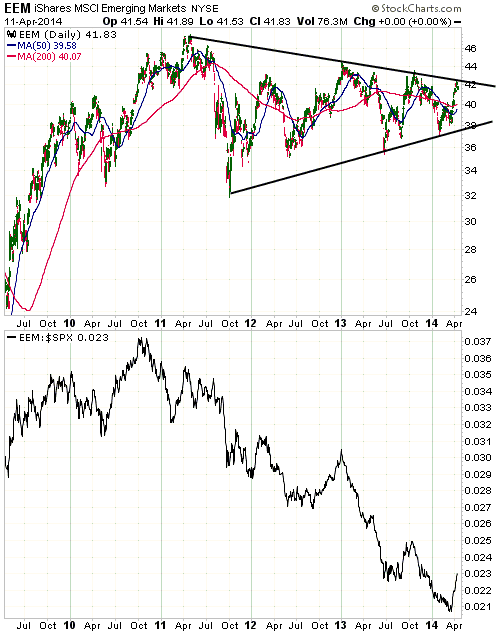
Due to the advanced age of EEM's bear market we have thought for several months
that it would end in 2014. However, due to the price pattern and the bearish
fundamentals we also thought that there could be a large and sharp final decline
to set the stage for the ensuing bull.
While a large and sharp decline to end EEM's bear market remains a realistic
possibility, EEM's resilience in the face of the recent weakness in the US stock
market suggests that it isn't the most likely scenario.
We currently aren't inclined to bet on any particular short- or
intermediate-term outcome for the emerging markets, but if we were forced to
state a conclusion it would be: the emerging-market bear is dead and a decline
by EEM to around $39 is the worst that will happen over the months ahead.
The US stock market
Late last week the RUT/SPX ratio (small-cap US equities relative to large-cap US
equities) broke to a new 9-month low. In doing so it provided additional
evidence that a top of at least intermediate-term importance is in place.
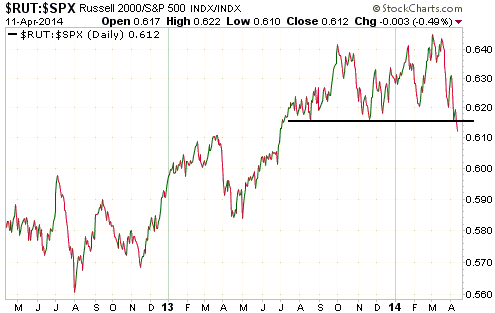
Confirmations of intermediate-term trend reversals often occur when the market
in question is 'oversold' or 'overbought' on a short-term basis. Consequently,
the confirmation of an intermediate-term reversal in one direction will often be
followed by a 1-3 week move in the opposite direction.
In the US market, last week's downside breakout by the RUT/SPX ratio is evidence
of an intermediate-term trend reversal from up to down, but this evidence has
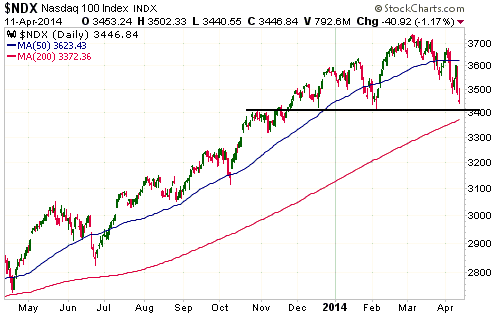
come with prices stretched to the downside. Furthermore, the NASDAQ100 Index (NDX),
the senior stock index that has led to the downside, is now close to important
lateral support at 3400. This makes it likely that a 1-3 week rebound will begin
within the next two trading days.
Our final US stock market chart is a monthly chart of the S&P500 Index. Routine
multi-month corrections, of which there have been NONE since 2012, tend to end
at or just below the 20-month MA (the blue line on the following chart). This
tells us that even if the cyclical bull market in US equities is intact, the SPX
is likely to fall to the mid-1600s within the next few months.
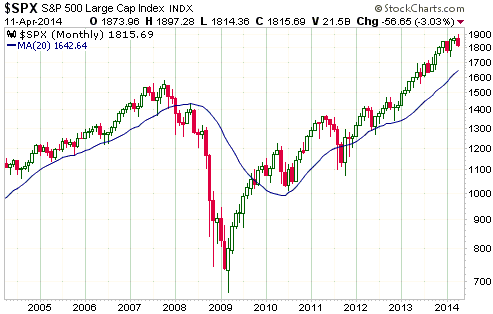
Based on the Presidential Cycle Model and the evidence that either an
intermediate-term correction or a cyclical bear market has begun, a downward
trend to a traditional October low is a likely outcome.
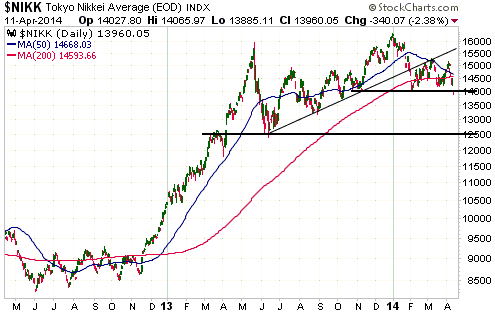
The Japanese stock market
Japan's Nikkei225 Index ended last week marginally below lateral support at
14000. Additional weakness is probably in store.
We expect the Nikkei to drop at least as far as support at 12500 before making a
multi-month bottom.
This week's
important US economic events
| Date |
Description |
| Monday Apr 14 |
Retail Sales
Business Inventories | | Tuesday
Apr 15 |
CPI
TIC Report
Empire State Mfg Survey
Housing Market Index | | Wednesday
Apr 16 |
Housing Starts
Industrial Production
Fed's Beige Book | | Thursday
Apr 17 |
Philadelphia Fed Survey
|
| Friday Apr 18 |
Markets closed for Good Friday |
Gold and
the Dollar
Gold
The supply/demand misunderstanding continues
The article linked
HERE continues the generally low standard of gold-market analysis by
demonstrating, yet again, a complete misunderstanding of gold supply and demand.
One of the popular battle cries last year was: "The falling COMEX gold inventory
is bullish because it means that physical gold is in short supply!" This was
related to the more general cry: "The demand for physical gold is rising
therefore the price SHOULD be rising!" As we explained at the time, the decline
in the COMEX inventory represented a shift in the location of some gold that
said nothing about overall supply/demand and was consistent with the inventory's
historical tendency to FOLLOW major trends in the gold price. And as we also
explained, the more general cry had the logic back-to-front. The correct logic
would be: The price of physical gold is falling therefore we can be sure that,
on average, the sellers of physical gold are more eager than the buyers.
The above-linked article asserts that the recent rise in the COMEX inventory is
bearish because it means that the demand for physical gold is falling, but in
reality it doesn't mean anything of the sort. The total demand for physical gold
is always equal to the total supply of physical gold, which is almost the same
now as it was when gold was peaking at $1900/oz in 2011 and is almost the same
now as it will be in two years' time regardless of what happens to the price.
However, the composition of the total demand for gold is constantly changing.
For example, over the past three months the nascent upward trend in the gold
price has caused some gold to shift into COMEX warehouses as per the historical
relationship (the rising price is the cause, the increase in the COMEX inventory
is the effect).
Since the total demand for gold is always equal to the total aboveground supply
of gold, which, in turn, only changes by about 1.5% per year due to new
production, any increase in the demand for gold in one part of the market MUST
be offset by a decrease in the demand for gold in another part of the market
(and vice versa). The change in price is the only reliable indicator of whether
the market participants who want to increase their exposure are more or less
motivated than the market participants who want to reduce their exposure. If the
price rises it means that a higher price is needed to induce current holders to
part with enough gold to satisfy the demand of new buyers. If the price falls it
means that a lower price is needed to induce enough new buying to absorb the
gold being put up for sale by current holders.
Current Market Situation
Gold's correction low, to date, is the 1st April intra-day low of $1277. This
low was probably the correction's ultimate price low or very close to it, but it
will probably be tested before the start of the next short-term upward trend.
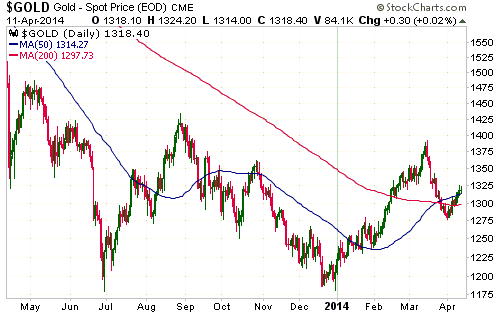
If gold drops back to test its 1st April low, silver will almost certainly make
a new multi-week low. As noted in last week's Interim Update, support for silver
at $19.00-$19.30 could be tested before the overall correction comes to an end.
Gold Stocks
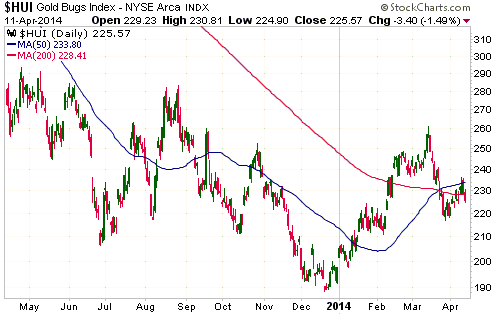
Current Market Situation
It looks like the HUI's rebound from its late-March low ended last Wednesday
when it traded at 236.2 (slightly above the 50-day MA). The implications are
that a decline to test the 27th March low of 216.7 is probably underway and that
from here on a daily close above 236.2 would be a clear sign that the correction
is over.
Beware of gold (and silver) mining companies that enter into "streaming"
deals
In a market environment where debt and equity financing is often either
expensive or difficult for a junior gold (or silver) miner to obtain, a
streaming deal can look attractive. This is a deal whereby a miner sells the
right to purchase part of its future production at a very low price (usually no
more than $400/oz for gold) in exchange for an upfront payment, with the upfront
payment generally being used to finance the development or expansion of a mine.
The company buying the future production "stream" will typically be Franco
Nevada (FNV), Royal Gold (RGLD), Silver Wheaton (SLV) or Sandstorm Gold (SAND).
While a "streaming" deal can look like a reasonable way for a junior miner to
meet its short-term financing needs at the cost of reduced future profitability,
the risk is that by entering into the streaming deal the junior miner has
completely relinquished its opportunity to make a profit in the future. This is
because most gold mines have slim profit margins after all costs are accounted
for. Due to these typically-slim margins, a miner that agrees to sell 10%-20% of
its future production to a royalty or streaming company at a nominal price could
end up with nothing for its own stockholders even if it doesn't encounter major
operational problems. In effect, the mine could end up being operated solely for
the benefit of the royalty/streaming company.
The upshot is: beware of junior mining companies that have entered into
streaming deals. Before you invest in such a company, make sure that there will
be plenty of money left over for the stockholders of the junior miner after the
royalty/streaming company has taken its share and ALL costs are taken into
account. And bear in mind that Franco Nevada, Royal Gold and Silver Wheaton have
very high valuations for a reason. The reason is that they tend to get the
better of these deals.
The Currency Market
The Yen has been chopping back and forth within a narrow range since
early-February. It ended last week near the top of this range.
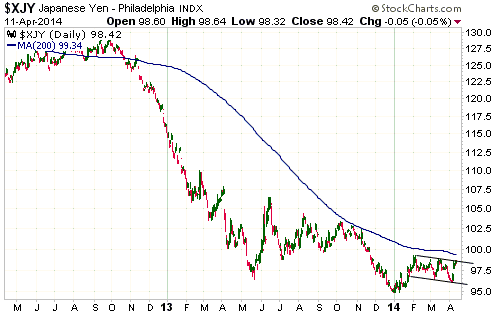
Many people are probably going to be surprised by the strength of the Yen this
year, for two reasons.
The first reason relates to the Yen supply. The conventional wisdom is that the
BOJ is in the process of inflating the Yen to oblivion, but the fact is that
Japan continues to have by far the lowest monetary inflation rate in the
developed world. Despite the BOJ's actions, Japan's money supply has only risen
by about 3.5% over the past 12 months.
The second reason is that the Yen continues to act like a safe-haven currency.
This means that if a substantial equity-market decline occurs over the next
several months, the Yen should be one of the beneficiaries.
The next meaningful move in the Yen will likely be to the upside. This move
could begin immediately or after a few more weeks of range-trading.
Updates
on Stock Selections
Notes: 1) To review the complete list of current TSI stock selections, logon at
http://www.speculative-investor.com/new/market_logon.asp
and then click on "Stock Selections" in the menu. When at the Stock
Selections page, click on a stock's symbol to bring-up an archive of
our comments on the stock in question. 2) The Small Stock Watch List is
located at http://www.speculative-investor.com/new/smallstockwatch.html
 Company
news/developments for the week ended Friday 11th April 2014: Company
news/developments for the week ended Friday 11th April 2014:
[Note: AISC = All-In Sustaining Cost, FS = Feasibility Study, IRR =
Internal Rate of Return, MD&A = Management Discussion and Analysis,
M&I = Measured and Indicated, NAV = Net Asset Value, NPV(X%) = Net
Present Value using a discount rate of X%, P&P = Proven and
Probable, PEA = Preliminary Economic Assessment, PFS =
Pre-Feasibility Study]
*Asanko Gold (AKG) announced that it has begun to advance certain
key engineering and early construction items for Phase 1 of the
Asanko gold mine development ahead of completing an updated mine
plan. This is to ensure that the Project schedule remains on track
for first gold production in Q1 2016.
According to last week's press release, AKG expects to complete the
updated mine plan along with project financing documentation this
quarter in preparation for an investment decision by the Board in
early Q3 2014.
*Batero Gold (BAT.V) has been very quiet over the past several
months. It appears that the company is in hibernation pending the
return to the sort of gold price (> $1500/oz) that would make its
Colombian gold project economically viable. Last week the company
announced that it had donated $240K to a "community project". This
is the sort of thing that mining companies have to do to smooth the
way through the mine development process, but is obviously not
significant from a speculative/investment perspective.
We don't think that BAT is one of the best candidates for new buying
at this time, but with the stock trading at less than the value of
its cash in the bank we also don't view it as a sell.
*Clifton Star Resources (CFO.V) announced the results of the PFS
for its Duparquet project.
There's plenty of information in CFO's press release about pre-tax
economics, but it's the post-tax economics that matter. Who cares
what the economics of a project would be in the absence of an
unavoidable major cost? In the real world, the only calculations of
project economics that are of interest to investors are the ones
that include all the costs.
Focusing on pre-tax numbers is what junior mining companies
sometimes do when the after-tax numbers (the numbers that matter)
don't look good. That appears to be the case here, as the only
mention of an after-tax NPV indicates that the project is not close
to being viable at $1300/oz. Specifically, the project's after-tax
NPV(5%) was calculated to be $135M at $1300/oz, which is high
compared to CFO's current market cap of around $12M but low compared
to the estimated pre-production capex of $394M.
We estimate that a gold price of at least $1600/oz would be required
to make the Duparquet project's economics sufficiently attractive to
justify the risk of building a mine. However, the company's market
cap is low enough and the project's location (Quebec) is good enough
to give CFO significant speculative merit. It just wouldn't be near
the top of our buy list at the current gold price, especially
considering that other junior gold-mining stocks with superior
projects are still in the bargain basement.
*Golden Star Resources (GSS) reported that it produced 65.8K
ounces of gold during the March quarter, which was on plan. The
company also reiterated its 2014 production guidance of 290K-320K
ounces at a cash cost of $950-$1000 ounce.
GSS is a leveraged play on the gold price. It is cash-flow negative
and unprofitable at $1300/oz, but if it achieves its production
guidance it should start making money above $1350/oz.
*Rio Alto Mining (RIOM) announced that it produced 53.5K ounces of
gold during Q1-2014. This is a very good result, because although it
is 5.5K ounces lower than the record quarterly production achieved
during Q4-2013 it is 8.5K ounces higher than forecast. Given that
the first quarter was expected by RIO's management to be the worst
quarter of 2014, the information provided last week suggests that
the company's production for the full year will achieve or exceed
the upper end of its 200K-220K-oz guidance range.
*Sabina Gold and Silver (SBB.TO): In the 31st March Weekly Update
we wrote that the $59M of working capital possessed by SBB at the
end of last year should be enough to fund the company through to at
least the end of this year, but that a detailed work plan and budget
for 2014 had not yet been provided. Last week, SBB provided work
plans and budgets for 2014 and 2015. Based on this information we
now expect that SBB's current working capital will be enough to
fully fund the company through to at least the end of NEXT year.
This is because 2014's forecast expenditure is around $24M and
2015's forecast expenditure is around $11M.
According to the work plans advised last week, the start and
completion dates for the Back River FS have been pushed out. Last
year, the plan was to complete the FS by the second half of 2014,
but the FS is now scheduled to be complete during the first half of
2015. Environmental permitting is also scheduled to be complete
during the first half of 2015. This probably means that there will
be no major project-related milestones for SBB this year, which, in
turn, probably means that the performance of SBB's stock will be
almost solely determined by sentiment in the gold-mining sector.
List
of candidates for new buying
From within the ranks of TSI stock selections, the best candidates for new
buying at this time are:
1) PG.TO (last Friday's closing price: C$1.95).
2) PLG.TO in the low-C$1.30s (last Friday's closing price: C$1.41).
3) RIOM (last Friday's closing price: US$1.96).
Chart Sources
Charts appearing in today's commentary
are courtesy of:
http://stockcharts.com/index.html
http://research.stlouisfed.org/

|
