![]()
![]()
![]()
![]()
-- Weekly Market Update for the Week Commencing 14th May 2018
Big Picture
View
Here is a summary of our big picture
view of the markets. Note that our short-term views may differ from our
big picture view.
The BULL market in US Treasury Bonds that began in the early 1980s ended in mid-2016, but there will be many years of topping action in bond prices and bottoming action in bond yields before major new trends get underway. A major decline in government bond prices will unfold during the 2020s. (Last update: 11 September 2017)
The stock market, as represented by the S&P500 Index, commenced a secular BEAR market during the first quarter of 2000, where "secular bear market" is defined as a long-term downward trend in valuations (P/E ratios, etc.), gold-denominated prices and inflation-adjusted prices. This secular trend will bottom in 2020 or later. (Last update: 11 September 2017)
A cyclical BEAR market in the US Dollar began in 2016-2017. (Last update: 11 September 2017)
Gold commenced a secular bull market relative to all fiat currencies, the CRB Index, bonds and most stock market indices during 1999-2001. This secular trend will peak in 2020 or later. (Last update: 11 September 2017)
Commodities,
as represented by the CRB Index, commenced a
secular BULL market in 2001 in nominal dollar terms. The first major
upward leg in this bull market ended during the first half of 2008, but
a long-term peak won't occur until 2020 or later.
(Last
update: 11 September 2017)
Copyright
Reminder
The commentaries that appear at TSI
may not be distributed, in full or in part, without our written permission.
In particular, please note that the posting of extracts from TSI commentaries
at other web sites or providing links to TSI commentaries at other web
sites (for example, at discussion boards) without our written permission
is prohibited.
We reserve the right to immediately
terminate the subscription of any TSI subscriber who distributes the TSI
commentaries without our written permission.
True
Fundamentals Summary
[Notes:
1) The date shown next to the current True Fundamentals Model (TFM) signal is
when the most recent change occurred. 2) Charts of the Gold and Equity
TFMs are included in the "Charts and Indicators" section of the TSI web
site]
| Market | True Fundamentals Model (TFM) |
| Gold (US$ Price) | Bearish (12 Jan 2018) |
| US Equity (SPX) | Neutral (11 May 2018) |
| Currency (Dollar Index) | Bullish (27 Apr 2018) |
| Commodities (GNX) | Neutral (20 Apr 2018) |
Last week's posts at the TSI Blog
US Recession
Watch
Summary of current
thinking/positioning
1) The Dollar Index probably
made a multi-week top last week, but it is set to make additional gains
prior to its counter-trend rally coming to an end.
2) By reversing
upward following a brief drop below its $1309-$1363 trading range during
the week before last, the gold market has signaled that a short-term
bottom may be in place. However, more strength is required to confirm the
reversal.
3) The SPX has confirmed an end to its correction and
likely will make a new all-time high before the end of next month. The
risk/reward is not bullish, though, because a move to well above the
January high is unlikely.
4) The multi-year upward trend in
commodity prices that got underway in early-2016 appears to have resumed.
If so, the Australian and Canadian dollars should be relatively strong
over the next few months.
5) The price of West Texas Intermediate
Crude oil probably made a 1-2 month top on 10th May (when it touched
US$72) or will do so this week.
6) There is no evidence that the
Swiss Franc has bottomed, but taking a 3-6 month view this currency's
risk/reward looks very attractive.
7) The bond market is probably
close to a multi-month bottom, but new lows in bond prices (new highs in
bond yields) are likely during the second half of this year.
8)
Holding a cash reserve of around 30%.
The Stock Market
Current Market Situation
The probability that the US stock indices would break below their
February lows has been steadily decreasing. Of particular relevance,
market internals have indicated underlying strength since February, there
was a rare buy signal from the TSI Put/Call Indicator (TPCI) during the
week before last and, as noted in last week's Interim Update, the
Russell2000 SmallCap Index had been relatively strong and had broken
upward from a contracting triangle.
Here is an update of the
Russell2000 chart included in our mid-week report. This chart shows that
the index built on its breakout over the final two days of last week.
The SPX had to close above 2718 to complete its own upside breakout,
which it now has done. The following daily chart shows last week's
breakout by the SPX and also shows that the NYSE Common-Stocks-Only
Advance-Decline Line ended last week at a new 12-month high.
There is now little room for doubt that a) the decline from the
late-January top was a short-term bull-market correction, albeit a steep
one, and b) the correction is over.
While there is a very good
chance that most US stock indices will test or exceed their January highs
before the middle of this year, there is unlikely to be a strong upward
trend in equity prices over the next few months. The main reason is that
government bond prices will keep falling (interest rates will keep rising)
until the stock market suffers a large-enough decline to precipitate a
deflation scare.
The bond market looks set to rebound over the
coming 1-2 months in response to the anti-bond trade having become far too
popular within the speculating community, but after that the bond bear
market should resume. When the T-Bond resumes its long-term bearish trend
and breaks decisively below its February-2018 low, a new round of downside
volatility should commence in the stock market.
We suspect that a
stock market decline that is larger and longer than the Q1-2018 episode
will happen, or at least get underway, in the second half of this year.
However, it's too soon to begin preparing for that.
Tesla
Update
In addition to financial problems, production
problems, accounting issues that have drawn the attention of regulators
and burgeoning competition in the electric vehicle market, over the past
year Tesla (TSLA) has suffered from an exodus of top executives. The
latest to go is the company's head of engineering and production.
Officially
he is taking a leave of absence to spend more time with his family,
but given that the ramp-up of Model 3 production is at a critical stage
it's a very strange time for someone in this position to be taking time
off.
Despite Tesla's obvious problems and absurdly high market
valuation, the stock price continues to hold up well. This undoubtedly is
due in part to TSLA being one of the most shorted stocks in the US market.
With so many shares having been sold short already there is regular
support from short covering and no room for new shorts to get involved in
a big way (you can't sell short if you can't borrow the stock).
Due to the stock's recent resilience, the late-March plunge looks like an
overshoot and the decline from the 2017 top looks no worse than the
intermediate-term correction that occurred in 2016. Also, $275-$280 has
become a critical support area. The stock price must break through this
support to confirm that we are dealing with a major bearish trend as
opposed to a severe bull-market correction.
We continue to believe that Tesla is on its way to bankruptcy, but the
short-term risk/reward no longer favours the bears. We think it is now
neutral, with the probability of a $50-$100 rise being roughly the same as
the probability of a $50-$100 fall.
In our opinion it doesn't make
sense to be short the stock at this time, although it could make sense to
establish (or re-establish) a short position if there is a daily close
below $275 within the coming few weeks.
This week's
significant US economic events
[Notes:
1) The most important events
(to the markets) are shown
in bold. 2) A list of global economic events can be found
HERE]
| Date | Description |
| Monday May-14 | No important events scheduled |
| Tuesday May-15 |
Retail Sales Empire State Mfg Survey TIC Report Business Inventories Housing Market Index |
| Wednesday May-16 |
Housing Starts Industrial Production |
| Thursday May-17 | No important events scheduled |
| Friday May-18 | No important events scheduled |
Gold and the Dollar
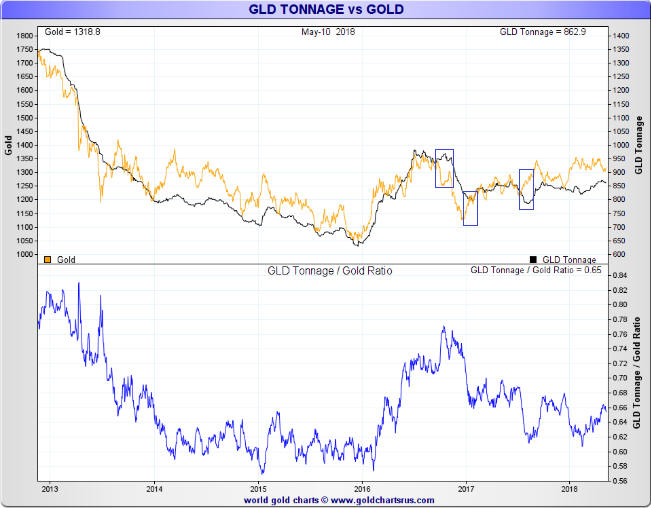
Current Market Situation
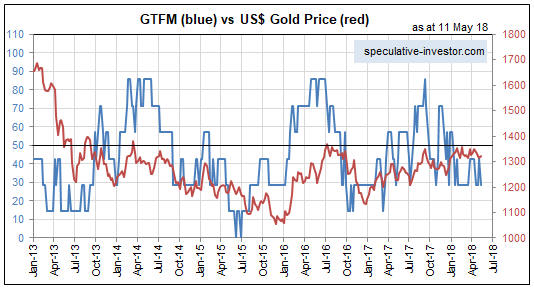
The
fundamental backdrop, as indicated by our Gold True Fundamentals Model
(GTFM), turned gold-bearish during the first half of January and has
remained so ever since. Refer to the following chart for details. However,
we expect that two of the GTFM's seven components will switch from bearish
to bullish during the early part of a 1-2 month (or longer) T-Bond rebound
and that such a rebound in the T-Bond should begin soon if it hasn't begun
already. This will shift the GTFM into bullish territory if other
components remain the same. Therefore, the fundamental backdrop could soon
become supportive.
Turning to the price action, after 5 tests of the 200-day MA in 7
trading days the US$ gold price bounced to its 20-day MA over the final
two days of last week. The bounce from the 200-day MA is not yet large
enough to be significant, but a daily close above the 50-day MA (near
$1330) would make it significant.
A rise in the US$ gold price to new multi-year highs is coming, but it
is probably still more than a month away.
Silver
Apart from a short-lived upward spike last month, the US$ silver price
has spent the past three months oscillating between $16.10 and $16.90.
During the week before last it tested the bottom and on Friday 11th May it
tested the top of this range. The top of the range roughly coincides with
the 200-day MA, so the price is currently butting up against significant
resistance. Furthermore, there is additional resistance defined by the
channel top a little higher -- at $17.20-$17.40. Consequently, silver has
some work to do to signal an upward trend reversal.
Sentiment is
not yet a tail-wind for the silver price. This is because although the
total speculative net position reveals minimal bullish enthusiasm, the
'dumb money' (the group defined as "NonReportable" in the COT reports)
continues to bet aggressively on a rally.
Now, it's possible that a
substantial rally will begin without the sentiment situation first
becoming supportive, but the odds are against it. We therefore expect the
US$ silver price to spend at least a few more weeks within its
downward-sloping price channel and won't be surprised if it spikes below
the bottom of its 3-month range before a substantial rally gets underway.
Gold Stocks
Current
Market Situation
The following daily chart shows that the
Gold Miners Index (GDX) has been moving back and forth between $21.00 and
$24.50-$25.00 since early last year. This is a long time to spend in a
narrow (by the standards of an historically volatile equity sector)
horizontal range.
It would be normal for such a long period of dull price action to
result in a general lack of optimism, but that doesn't appear to be the
case here. We are referring to the fact that every time the gold-mining
sector shows any sign of life, many articles are published proclaiming:
"This is it! A big rally has begun!"
We expect that a big rally (a
rally lasting more than 6 months and taking the gold-mining indices/ETFs
above their 2016 highs) will begin in the not-too-distant future.
Furthermore, this month (May-2018) was previously considered to be a
likely time for such a rally to begin. However, there is no evidence that
it has already begun.
The situation could change, but at this
stage the upward move that got underway in March has the hallmarks of a
counter-trend rebound. To bring itself into line with the other
counter-trend rebounds of the past 16 months it could push the GDX price
up to $24.50-$25.00, but as things stand right now there isn't a good
reason to expect it to do significantly better than that.
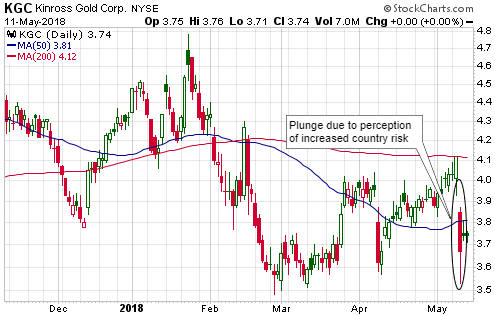
Tanzania, Zambia, Ghana, DRC and now Mauritania
After the close of trading last Tuesday (8th May), Kinross Gold (KGC)
reported its Q1 results. The company's production and financial
performances were fine, but when the stock opened for trading on Wednesday
the price plunged. Bearing in mind that KGC's largest mining operation is
the Tasiast project in the West African country of Mauritania (the Islamic
Republic of Mauritania, to be precise), here's why:
KGC's Q1 report
mentioned that the Mauritanian government had recently rejected an
important permit application for the Tasiast project. This would be bad
enough on its own, but KGC's report also stated:
"...[the
government of Mauritania has expressed] a desire to enter into mutually
beneficial discussions with respect to all of the company's activities in
Mauritania. The company understands the government's position to be that
any discussions are to be initiated by a proposal from Kinross that would
provide greater overall economic benefits to the country."
That is, it seems that the Mauritanian government is intent upon changing
the rules (reneging on past agreements) in an effort to extract more money
from KGC and is using an important permit application as leverage. By
going down this road it is following in the recent footsteps of other
African governments, including the governments of Tanzania, Zambia, Ghana
and the DRC.
For foreign mining companies, country risk is ramping
up in Africa.
The Currency Market
The Dollar Index (DX)
We thought
that if the DX didn't make a multi-week high on Friday 4th May then it
would do so during the past week. At this stage it looks like the expected
high was put in place on Wednesday 9th May.
We expect the DX to
make new highs for the year following a 1-3 week correction. However, the
on-going failure of the US$ gold price to confirm the DX's upside breakout
indicates that the bulk of the dollar's rally may be in the books already.
This would be consistent with the signs that some other currencies are
close to short-term bottoms.
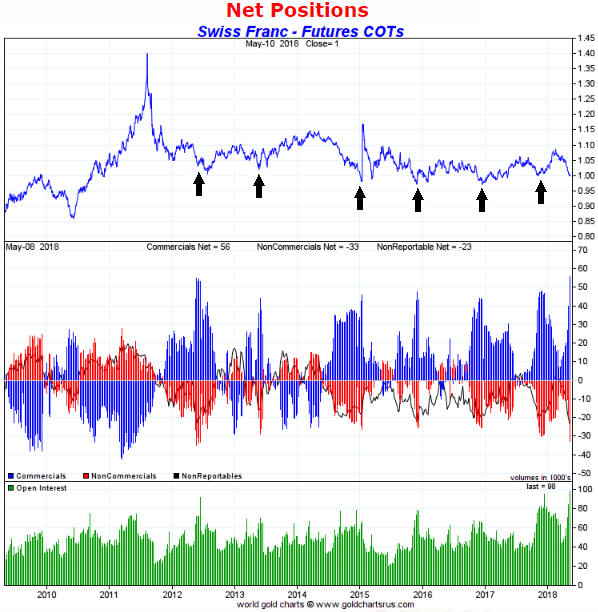
The Swiss Franc (SF)
Over the
past two weeks there was a dramatic change in the SF's Commitments of
Traders (COT) situation. As illustrated by the following chart, the total
speculative net-short position in SF futures (the inverse of the blue bars
in the middle section of the chart) surged to a 9-year high. This sets the
stage for a tradable rally.
The previous six times that the COT
situation was near a similar extreme are indicated by arrows in the top
section of the chart. In all except one of these cases, the COT extreme
coincided with a multi-month low and the start of an 8-point or larger
rally. The exception was in 2012, when an extreme in the total speculative
net-short position was followed by a 2-3 week 'head fake' to the upside
and then a decline to a new low. However, even in 2012 a long position in
the SF purchased at the time of the COT extreme yielded a profit of up to
5 points within 4 months.
Below is a daily chart of FXF, a US$-denominated ETF that holds Swiss
Francs and therefore tracks the SF/US$ exchange rate. The tracking is not
perfect (FXF marginally underperforms the SF over time due to fees and,
more recently, the cost of negative interest rates), but it is good enough
for short or intermediate-term trades.
FXF bounced from an
'oversold' extreme over the final two days of last week but must close
above the 20-day MA (the black line on the chart) to provide preliminary
evidence that a short-term bottom is in place.
The sort of downward momentum extreme achieved by the SF (and FXF)
last week often precedes a price low, so something along the lines of what
happened when the SF was in a similar situation in 2012 (a bounce and then
a decline to a new low prior to the start of a meaningful rally) is a
distinct possibility over the next few weeks. However, we think it makes
sense to at least take an initial position in FXF now.
We have
decided to add some short-term SF exposure to the TSI List via an FXF call
option. Specifically, we are adding the FXF September-2018 $96 call at
US$1.05 (the mid-point of Friday's closing bid-offer spread). Note that we
would be more comfortable with a December-2018 expiry date, but at this
time there is no liquidity in the FXF December options.
The Australian Dollar (A$)
By
dropping below an obvious lateral support level and then recovering to end
the week above the support, last week the A$ generated a bullish signal in
the form of a failed downside breakout. It's the same type of signal
generated by the US$ gold price during the week before last.
This
is preliminary evidence that a short-term bottom is in place for the A$. A
daily close above the 50-day MA would be more conclusive.
Updates
on Stock Selections
Notes: 1) To review the complete list of current TSI stock selections, logon at
http://www.speculative-investor.com/new/market_logon.asp
and then click on "Stock Selections" in the menu. When at the Stock
Selections page, click on a stock's symbol to bring-up an archive of
our comments on the stock in question. 2) The Small Stock Watch List is
located at http://www.speculative-investor.com/new/smallstockwatch.html
![]() Company
news/developments for the week ending Friday 11th May 2018:
Company
news/developments for the week ending Friday 11th May 2018:
[Note: AISC = All-In Sustaining Cost, FS = Feasibility Study, FY =
Financial Year, IRR = Internal Rate of Return, ISR = In-Situ Recovery,
MD&A = Management Discussion and Analysis, M&I = Measured and Indicated,
NAV = Net Asset Value, NPV(X%) = Net Present Value using a discount rate
of X%, NSR = Net Smelter Return, P&P = Proven and Probable, PEA =
Preliminary Economic Assessment, PFS = Pre-Feasibility Study]
*Almaden Minerals (AAU) published its financial
statements for the March-2018 quarter, revealing that the company had
C$12M of working capital at 31st March (about C$4M less than at the end of
last year).
The aforementioned working capital amount should be
enough to fund AAU through environmental permitting and FS completion (due
by year-end) for the company's flagship Ixtaca gold-silver project in
Puebla State, Mexico. Furthermore, the MD&A published with the financial
statements contained the following: "The Company expects its current
capital resources will be sufficient to carry out its exploration plans
and operations for the foreseeable future." However, within hours of
publishing the MD&A the company advised that it was raising C$7M by
issuing new shares at C$1.00. So, a company that doesn't need the money
has decided to issue new shares at a time when the share price is near a
2-year low. It's a great deal for the participants in the financing
(insiders and a small number of favoured investors), but a bad deal for
all other AAU shareholders.
It's likely that AAU will receive a
takeover bid soon after completion of the FS and environmental permitting.
*Alio Gold (ALO) published its financial
results for the March-2018 quarter.
The plan at the start of this
year was for Q1 production from the company's San Francisco gold mine
(Mexico) to be much lower than the average run rate for the year. It did
turn out to be a sub-par production performance from the mine during Q1,
and as a result of this and expenditure on the exploration-stage Ana Paula
project the company's balance sheet experienced a US$4M cash reduction
during the quarter. However, the balance sheet remains strong, with no
long-term debt and US$58M of working capital.
Right now we aren't
concerned about the San Francisco project, because its production and cash
generation should be much better over the remainder of the year. We are,
however, concerned about the changes that have occurred at the Ana Paula
project. In particular, the proposed mine plan for Ana Paula has become a
lot more complex than originally envisaged, resulting in the completion of
the FS being delayed from Q2-2018 to sometime next year. This could mean
that the economics of the original plan were not as attractive as
indicated in the PFS.
We are also concerned about ALO's takeover
bid for Rye Patch Gold (RPM.V). This bid makes no sense whatsoever at the
agreed price UNLESS it has become apparent to ALO's management that the
Ana Paula project is worth a lot less than suggested by the PFS.
Due to the above concerns, we will be looking for a good opportunity to
exit ALO before year-end. Hopefully, a gold-sector rally will provide the
aforementioned opportunity.
*Africa Oil (AOI.TO)
published its financial results for the March-2018 quarter.
At 31st
March the company had no long-term liabilities to speak of, US$409M of
working capital and US$42M of equity investments (stakes in Africa Energy
Corp, Eco (Atlantic) Oil and Gas, and Impact Oil and Gas), that is, the
company had US$451M of working capital plus equity investments (WC+EI).
This compares to US$453M of WC+EI at the end of last year.
At the
current exchange rate and total share count, US$451M equates to
C$1.23/share. This means that if you buy AOI shares at C$1.23 or less you
are, in effect, getting 25% of the large development-stage South Lokichar
Basin (the company's flagship asset) for free. It is expected that over
the next few years South Lokichar will be developed into a producing oil
field with output of around 100K barrels of oil per day (bopd).
*Blackham Resources (BLK.AX) advised that recent drilling
had identified extensions to shallow oxide and transitional mineralisation
that suggests the potential for new open pits close to the Wiluna plant.
The quantity of gold that will be added to the mine plan probably isn't
substantial, but because the additional resource could be mined via
existing infrastructure it could have a significant positive effect on
project economics.
*Continental Gold (CNL.TO)
published its financial results for the March-2018 quarter.
At 31st
March the company had working capital of US$45M (down from $69M at 31st
December), long-term debt of US$73M (up from $48M at 31st December) and
undrawn credit of US$200M.
The company has available financing
(working capital plus undrawn credit) of $245M. Although this should be
enough to cover the remaining mine capex and working capital requirements,
we continue to expect that for risk management purposes a US$20M-$40M
equity financing will be done within the next 9 months.
Our CNL
valuation is unchanged at C$5.30/share based on US$1300/oz for gold.
*Petrus Resources (PRQ.TO) reported its
operating and financial results for the March-2018 quarter.
During
the quarter the company's net debt (long-term debt minus working capital)
dropped from C$146M to C$144M, meaning that the company added about C$2M
of cash to its balance sheet. Quarterly production averaged about 10,600
boe/day, which was similar to the preceding two quarters.
Considering the extremely low price of natural gas in Canada, this was a
satisfactory result.
![]() List
of candidates for new buying
List
of candidates for new buying
From within the ranks of TSI
stock selections the best candidates for new buying at this time, listed
in alphabetical order, are:
1) ALK.AX (last Friday's closing price:
A$0.31)
2) AOI (last Friday's closing price: C$1.27)
3)
CNL.TO in the C$3.40s (last Friday's closing price: C$3.66)
4)
EGD.V (last Friday's closing price: C$0.40)
5) GRG.V (last Friday's
closing price: C$0.49)
The above list is limited to five stocks. It
will sometimes contain less than five, but it will never contain more than
five regardless of how many stocks are attractively priced for new buying.
Chart Sources
Charts appearing in today's commentary
are courtesy of:
http://stockcharts.com/index.html
http://www.goldchartsrus.com/