|
-- Weekly Market Update for the Week Commencing 14th June 2004
Big Picture
View (Most recent update: 7 June 2004)
Here is a summary of our big picture
view of the markets. Note that our short-term views may differ from our
big picture view.
Bond yields (long-term interest
rates) bottomed in June of 2003 at around 4.2% and will move considerably higher during
2004 and 2005. (Last update: 12 January 2004)
The stock market rally that
began in October of 2002 will end during the first half of 2004. The October-2002
bottom (775 for the S&P500) will be tested during 2005. (Last update: 12 January 2004)
The Dollar made an
intermediate-term
bottom in February of 2004 and is likely to test its low by August of
2004 before moving higher into the first half of 2005. A long-term
bottom won't occur until
2008-2010. (Last update: 7 June 2004)
Gold will make an intermediate-term
peak during the first half of 2004 and then consolidate for at least 6
months, but a long-term peak won't occur until 2008-2010. (Last update: 12 January 2004)
Commodities, as represented
by the CRB Index, will make an intermediate-term peak during the first
half of 2004 and then consolidate for at least 6 months, but a long-term
peak won't occur until 2008-2010. (Last update: 12 January 2004)
Copyright
Reminder
The commentaries that appear at TSI
may not be distributed, in full or in part, without our written permission.
In particular, please note that the posting of extracts from TSI commentaries
at other web sites or providing links to TSI commentaries at other web
sites (for example, at discussion boards) without our written permission
is prohibited.
We reserve the right to immediately
terminate the subscription of any TSI subscriber who distributes the TSI
commentaries without our written permission.
Inflation Expectations
The US Producer Price Index
(PPI) for May should have been released last week, but it was delayed
to give the Government's statisticians more time to conjure-up a lower
number. This wasn't, of course, the official explanation for the delay,
it's just the explanation that rings true. The PPI will probably be
released sometime this week, but we have no idea what the final number
will be. What we can confidently predict, though, is that the number
that ends up being reported will be substantially lower than the number
that would have been reported had an honest attempt been made to
calculate what was actually happening to producer prices.
Manipulating statistics and 'jawboning' are the two main tactics used
by the US monetary authorities to manage inflation expectations and in
so doing keep a lid on the gold price. In fact, the management of
inflation expectations is the ONLY effective way to contain the gold
price. This is because central banks don't own anywhere near enough
gold to suppress the price through direct intervention should inflation
expectations begin to surge.
Right now, inflation expectations are under control. We can say this
with confidence due to the way the markets are reacting to inflation
news and 'Fed speak'. In particular, the US$ is rallying on any news
that confirms the presence of inflation because the markets are taking
such news to mean that the Fed is going to bump official interest rates
up by one or two percent. However, if inflation expectations were
running out of control then the markets would not be anticipating a
quick and relatively painless end to the inflation. They would,
instead, be going crazy because the Fed has STILL not made its FIRST
rate hike despite all the obvious signs of inflation.
The bottom line is that most people currently perceive some FUTURE
inflation risk, but very few people realise that the US has a major
inflation problem right NOW. Hence the counter-intuitive response to
news of higher inflation and the strength in the US$ every time a Fed
representative hints at the prospect of higher interest rates.
What will the Fed do?
According to the Fed
Funds Futures, which at any given time represent the market's best
guess as to what the Fed is going to do, the Fed will hike rates by
0.25% at the June FOMC Meeting and by a total of 0.75% over the coming
three months. And the Greenspan Fed always tries not to surprise the
market, so unless something happens to change the market's expectations
then rate hikes totaling 0.75% are what we are likely to get over the
coming three months.
There's a good chance, of course, that something WILL happen to change
the market's expectations. For example, the PPI and/or the CPI might
turn out to be much higher than currently anticipated and cause the
market to begin discounting additional rate hikes. Or stock and
commodity prices might fall, thus resurrecting the deflation fears that
were so prevalent just 12 months ago and causing the market to
ramp-down its expectations with regard to official rate hikes.
An important point to understand, though, is that if deflation fears
can potentially be resurrected simply by pullbacks in commodity and/or
stock prices, or if the markets really believe that the Fed can get the
inflation situation under control with a few 0.25% rate hikes, then
inflation expectations are quite low to begin with. This, in turn,
simply confirms that the gold bull is young.
Commodities
Our view is that the US$
will test its lows before experiencing a 6-12 month rebound, and if
this view proves to be correct then the commodities that performed so
well between the second quarter of last year and the first quarter of
this year will probably test their highs within the next couple of
months. However, the inverse correlation between commodity prices and
the US$ suggests that once the dollar turns higher, and particularly
once it breaks upwards out of the downward-sloping channel in which it
has been mired since the beginning of 2002, we should expect a lengthy
correction in the CRB Index.
The 'China story' provided the fundamental basis for the huge run-ups
in the prices of the industrial metals during the final quarter of last
year and the first quarter of this year, while fears that China's
growth was about to slow contributed to the subsequent sharp declines
in metal prices. The latest figures show that China's rate of growth
has slowed, but is still very fast. For instance, during May the
year-over-year increases in China's imports, money supply and
production were 35%, 17.5% and 17.5%, respectively. These are down from
the levels of 42%, 21% and 23%, respectively, reached earlier this
year, but are still very high. Therefore, strong Chinese demand remains
an important factor in the commodity markets.
China's growth, even though it has slowed from the torrid pace reached
earlier this year, is no doubt largely responsible for the on-going
draw-down in copper inventories. As at the end of last week the LME
copper inventory stood at 122,225 tonnes, down an incredible 72% since
the start of this year and down by 17% over just the past month.
Judging by the performance of copper futures the financial markets
continue to expect that copper inventories will be replenished over the
coming 6 months, but there is little margin for error here.
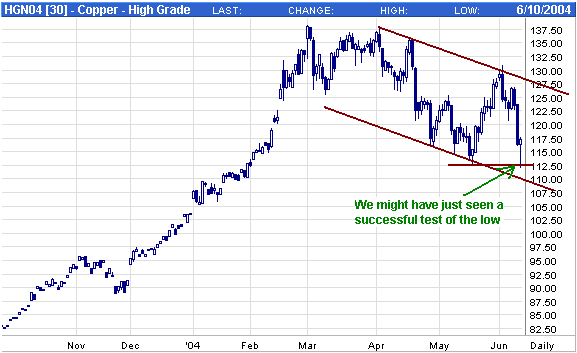
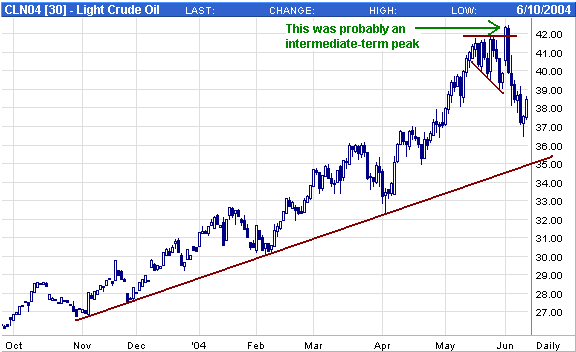
Below is a daily chart of July copper futures. There was an upward
reversal in the copper price last Thursday following a plunge to near
the May low, so it is possible that a successful test of the low has
just occurred.
Bonds
Japanese Government Bond
(JGB) prices plummeted last week and, in the process, appear to have
broken below the neckline of a 3-year head-and-shoulders topping
pattern (refer to the following weekly chart). They ended the week at
support defined by the August-2003 low. After such a sharp downward
move it wouldn't be surprising to see the JGBs consolidate for a few
weeks before continuing their fall. However, prices look set to move
much lower over the coming 6 months.
The weekly chart of US T-Bond futures is not quite as bearish as the
JGB chart, but it still has the look of a large topping pattern. A
weekly close below the support line shown on the below chart would
indicate that the next downward leg in the bond bear market was
underway, but we think it is likely that bonds will consolidate for a
few more weeks before this breakdown occurs.
The Stock
Market
The Secular Trend
Last year at around this time we asked the question: "Has a bear market
started yet?" We thought this was a reasonable question because the
NYSE advance-decline line had been trending higher for three years and
several important sectors of the market were clearly not in long-term
downward trends. And the question seems even more relevant today than
it did 12 months ago because the NYSE advance-decline line hit an
all-time high early this year, and although the senior stock indices
have never looked like challenging their 2000 peaks many sub-indices
have moved to all-time highs over the past 12 months. The question
really doesn't exist, though, if we make the sensible decision to
define the secular trend in terms of valuations rather than prices.
When we try to define secular stock market trends in terms of prices we
run up against two problems. First, nominal prices are expressed in
terms of a currency that is constantly changing. Second, when a
currency depreciates as a result of inflation an effect, at least
during the early stages of the inflation, can be higher earnings and
higher stock prices.
It is possible, however, to eliminate the 'smoke and mirrors' effect
that massive monetary stimulation can cause because over long periods
the stock market has always differentiated between real earnings growth
and earnings growth caused by inflation. Specifically, investors have
historically paid less for earnings that stem from inflation than for
earnings that stem from real (productivity-driven) growth. In other
words, if earnings are being artificially boosted by currency
depreciation then P/E ratios will trend lower.
Further to the above, if we define secular trends in terms of the
average P/E ratio, as opposed to the nominal level of a stock-market
index, the secular trends will not be obscured by changes in the value
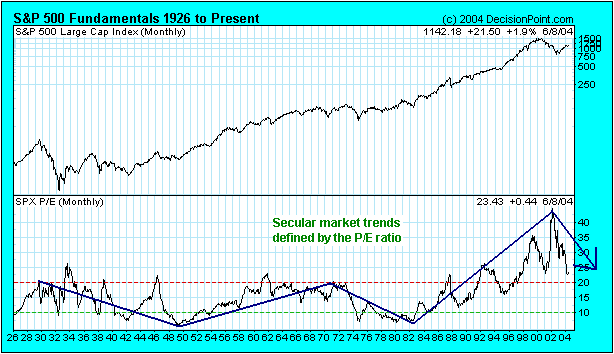
of the currency. For example, the below chart shows how long-term
trends can appropriately be defined by the trends in the S&P500's
P/E ratio. By the way, thanks to David Fuller at www.fullermoney.com for helping to clarify this issue for us.
The logical conclusion is that a secular bear market began following
the major peak in the P/E ratio during the first two years of this
decade and will, if history is any guide, continue until well into the
next decade.
The one problem with
defining secular trends in terms of P/E ratios is that the P/E ratio
will sometimes fluctuate wildly during any given 1-5 year period. As a
result it is really only possible to 'see' the trend in the P/E ratio
when looking at very long-term charts, whereas during a normal
investment timeframe the secular trend in the P/E ratio might not be
evident or even relevant. Fortunately, there is a method of defining
the secular trend in the stock market that gets around the problem of
nominal prices being substantially altered by changes in the currency
AND is of more practical use than the long-term trend in the average
P/E ratio. The method, which we've illustrated on the below chart, is
to let the trend in the Dow/gold ratio define the secular trend in the
stock market.
Note: Gold and the US$ were officially linked prior to 1971 and this
resulted in a very short and very sharp downturn in Dow/gold during the
early 1930s followed by a very lengthy recovery into 1966, but if the
US$ had not been convertible into gold at a fixed rate we suspect that
the downward trend in Dow/gold that began in 1929 would have been more
gradual and would have bottomed during the first half of the 1940s.
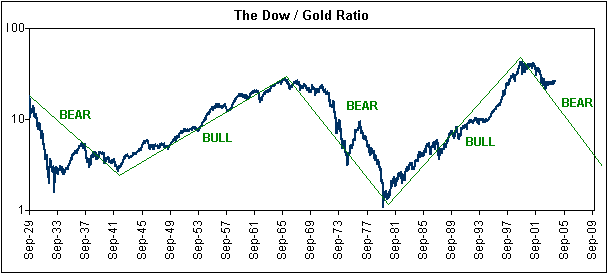
The above chart
suggests that the secular bear trend in the stock market is in its
early stages in terms of both time and price. In fact, if history is
any guide the bear trend will end sometime next decade at a Dow/gold
ratio of between 1 and 5. With the ratio presently at 27 this means
that it would be reasonable to expect an investment in gold bullion to
perform at least 5-times better, and perhaps as much as 27-times
better, than an investment in the Dow Industrials Index if both
investments were held over the next 10 years.
Current Market Situation
There has only been one trading day since we wrote last week's Interim
Update and that day's low-volume rally did not change anything.
The one thing that is becoming more obvious as each day passes is that
in the current environment US$ strength is a big short-term negative
for the US stock market. Our expectation is that the US$ will drop over
the coming 1-2 months and that any intervening rebound in the Dollar
Index will hold below the channel top (refer to the chart in last
week's Interim Update). However, if the Dollar Index surprises us by
breaking out of its 2.5-year channel then the near-term outlook for the
stock indices will turn decidedly bearish.
This week's
important US economic events
| Date |
Description |
Monday Jun 14
|
Trade Balance
Retail Sales
|
| Tuesday Jun 15 |
CPI |
| Wednesday Jun 16 |
Industrial Production
Beige Book
New Residential Construction
|
| Thursday Jun 17 |
Leading Economic Indicators
|
| Friday Jun 18 |
Q1 2004 Current Account
|
Gold and
the Dollar
Gold stocks and the yield-spread
Gold and gold stocks are positively correlated with the yield-spread,
although the correlation appears to be stronger with the stocks than
with the bullion. We say this because during 1985-1986 and 1999-2000
gold stocks continued to trend lower with the yield-spread for about 16
months AFTER the gold price had bottomed. In fact, during both 1986 and
2000 a large advance in gold stocks began on almost the same day that
the trend in the yield-spread (the yield on the 30-year T-Bond divided
by the yield on the 13-week T-Bill) reversed from down to up.
Relative to its 20-year average the yield-spread is currently very
high, but the absolute level of the yield-spread appears to be far less
important, as far as the currency and gold markets are concerned, than
the direction in which it is moving. This can be seen on the below
chart. Notice that when the yield-spread turned higher in November of
2000 its level was very low, but as soon as the yield-spread reversed
course a major bull market in gold stocks got underway. Similarly, the
trend reversal in the yield-spread in January of this year led to a
trend reversal in the gold sector.
By the way, trend-lines drawn on charts are always somewhat arbitrary.
For example, trend-lines will usually be in different places depending
on the type of chart (candlestick, line, P&F, etc.) and on whether
the chart's vertical scale is linear or logarithmic. Also, experienced
chartists will regularly draw trend-lines in different places even when
using the same scale and the same type of chart. This is why, when
identifying support/resistance levels on charts, we usually place a lot
more importance on former peaks and troughs than on trend-lines. It is
also why the yield-spread's trend-line break in January could have been
meaningless until it was confirmed by the April-May breakdown in gold
stocks (the yield-spread broke below similar trend-lines in August of
2002 and April of 2003, but in both cases subsequent market action
proved that it was still in an upward trend).
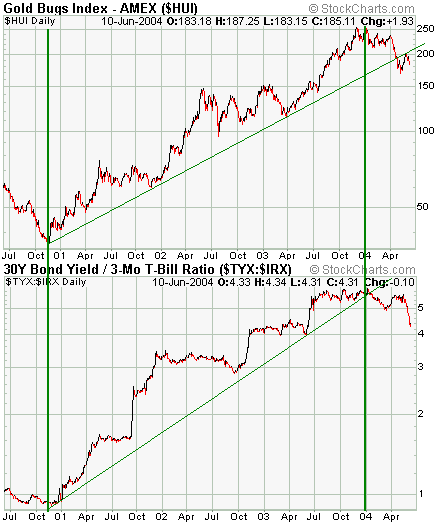
The above chart
doesn't tell us that a major top is in place for either the gold stocks
or the yield-spread because an upward trend-line formed by connecting
the lows during the first few years of a long-term bull market is never
likely to remain intact throughout the entire bull market. Instead,
what tends to happen is that some larger-degree corrections along the
way will establish a trend-line that is less steep. In other words, the
bottom of the current correction (which might, by the way, already be
in place) will probably determine the slope of the long-term upward
trend.
What the chart does tell us is that as long as the yield-spread is
moving lower, that is, as long as short-term interest rates are rising
RELATIVE TO long-term interest rates, the gold stocks will be facing a
substantial headwind. The Fed could therefore bring about much greater
weakness in the gold sector than has already occurred by getting
genuinely aggressive on the rate-hiking front. The thing is, if the Fed
did do that it wouldn't just take down the gold stocks; it would take
down the entire stock market. And that's why it almost certainly won't
happen, at least over the next several months.
Gold and interest rates -- the 1970s analogue
An argument we've seen made quite regularly by gold bulls over the past
few months is that the performances of the gold, currency and
interest-rate markets during the 1970s prove that rising interest rates
are not bullish for the US$ or bearish for gold. However, the logic in
this argument is faulty. The fact that gold and interest rates rose
together during the 1970s simply tells us that if everything were the
same today as it was during the 1970s then a rising gold price would
likely occur alongside rising interest rates. The thing is, there are
some very big differences between the current situation and the
situation during the 70s and these differences all but guarantee a
different outcome.
The US has experienced a high inflation rate (money supply growth rate)
over the past few years and our expectation is that it will experience
a lot more inflation over the next several years. In this and a few
other respects the current situation is similar to the 1970s, but the
amount of debt in the system is now MUCH greater than it was during the
70s and asset valuations are currently MUCH higher than they ever were
during the 70s.
Our expectations are that:
a) The outward signs of inflation will be less prevalent during the
second half of this decade than they were during the 1970s,
particularly if real estate prices and construction activity taper off
(as will probably occur over the next few years). As a result, the Fed
will be forced to remain stimulative (the real Fed Funds Rate will
generally remain low and the yield-spread will generally remain high),
although there will be brief periods -- right now, for instance -- when
the markets start to fear a non-stimulative Fed.
b) Once the US consumer becomes unwilling or unable to act as the
primary engine of inflation the Fed will take-over this role and start
directly ramping-up the money supply.
In a nutshell, we expect that those who are forecasting a repeat of the
1970s will be wrong because there are huge differences between now and
then, while those who are forecasting deflation will be wrong because
the Fed's ability to print money is unlimited. We are in are uncharted
waters.
Current Market Situation
Over the past couple of years the 18-day moving average of the nearest
gold futures contract has regularly provided support or resistance
during minor corrections. Furthermore, crosses of this moving average
have been reliable signals of changes in the short-term price trend.
August gold closed below its 18-day moving average last Wednesday and
butted up against it on Thursday morning before dropping back.
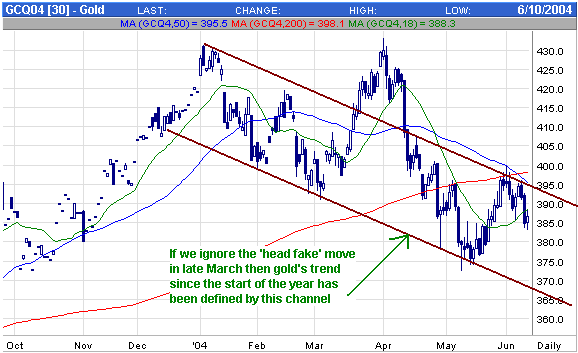
Our thinking is that gold will find support around $380 during its
current pullback and then move up to $415-$420. Other likely support
levels are $375 (the May low) and $367 (the bottom of the channel shown
on the following daily chart of August gold futures), but these lower
levels should only come into play if the US$ is a lot stronger over the
coming 1-2 months than we currently expect.
With Newmont Mining
(NEM), the HUI and the XAU all having turned lower without first moving
above their former breakdown levels ($41 for NEM) there is a chance
that the gold stock indices and some individual gold stocks will drop
below their May lows over the next month or so. However, the downside
risk does not appear to be great. For example, the following log-scaled
weekly chart of NEM shows that there is major support in $33-$35 range
versus last week's close of $37.94.
Note that a drop back to near the May lows would most likely require an upside breakout by the Dollar Index.
Update
on Stock Selections
 First Majestic Resource (TSXV: FR) has acquired "...a
district-size property package [in Mexico] which includes three
previously operated mines. These mineral assets will complement the
company's recent acquisition of the La Parrilla silver mine and will
give the company a strategic position in an area in which the
geological potential for additional discoveries is high and combined
mining infrastructure will optimize the use of the company's financial
resources." First Majestic Resource (TSXV: FR) has acquired "...a
district-size property package [in Mexico] which includes three
previously operated mines. These mineral assets will complement the
company's recent acquisition of the La Parrilla silver mine and will
give the company a strategic position in an area in which the
geological potential for additional discoveries is high and combined
mining infrastructure will optimize the use of the company's financial
resources."
Several acquisitions have been made with the main one being the
Perseverancia silver mine. This mine has reportedly produced 3.2M
ounces of silver in the past at grades of 500-1500 g/t, as well as
significant amounts of lead and zinc. And, according to FR, "further
additional potential within the mine and surrounding area is very
promising taking into account that this mine was operated in a very
small and reduced way, without modern exploration techniques or a
professional development approach."
Under the terms of the acquisition agreements FR has 6 months to carry
out due diligence on the projects, during which time it will spend
US$300,000. Based on the results of this due diligence FR will decide
whether or not to proceed with the acquisitions.
This latest news from FR is in line with the company's goal of buying
silver assets that can be quickly developed to the point where they are
producing positive cashflow. Like all silver miners FR stands to
benefit from a higher silver price, but it is a lot more than just a
call option on the silver price.
Chart Sources
Charts appearing in today's commentary
are courtesy of:
http://stockcharts.com/index.html
http://www.futuresource.com/
http://www.decisionpoint.com/

|

