|
-- Weekly Market Update for the Week Commencing
14th July 2014
Big Picture
View
Here is a summary of our big picture
view of the markets. Note that our short-term views may differ from our
big picture view.
In nominal dollar terms, the BULL market in US Treasury Bonds
that began in the early 1980s ended in 2012. In real (gold)
terms, bonds commenced a secular BEAR market in 2001 that will continue
until 2018-2020. (Last
update: 20 January 2014)
The stock market, as represented by the S&P500 Index,
commenced
a secular BEAR market during the first quarter of 2000, where "secular
bear market" is defined as a long-term downward trend in valuations
(P/E ratios, etc.) and gold-denominated prices. This secular trend will bottom sometime between 2014 and 2020.
(Last update: 22 October 2007)
A secular BEAR market in the Dollar
began during the final quarter of 2000 and ended in July of 2008. This
secular bear market will be followed by a multi-year period of range
trading.
(Last
update: 09 February 2009)
Gold commenced a
secular bull market relative to all fiat currencies, the CRB Index,
bonds and most stock market indices during 1999-2001.
This secular trend will peak sometime between 2014 and 2020.
(Last update: 22 October 2007)
Commodities,
as represented by the Continuous Commodity Index (CCI), commenced a
secular BULL market in 2001 in nominal dollar terms. The first major
upward leg in this bull market ended during the first half of 2008, but
a long-term peak won't occur until 2014-2020. In real (gold) terms,
commodities commenced a secular BEAR market in 2001 that will continue
until 2014-2020.
(Last
update: 09 February 2009)
Copyright
Reminder
The commentaries that appear at TSI
may not be distributed, in full or in part, without our written permission.
In particular, please note that the posting of extracts from TSI commentaries
at other web sites or providing links to TSI commentaries at other web
sites (for example, at discussion boards) without our written permission
is prohibited.
We reserve the right to immediately
terminate the subscription of any TSI subscriber who distributes the TSI
commentaries without our written permission.
Outlook Summary
Market
|
Short-Term
(1-3 month)
|
Intermediate-Term
(6-12 month)
|
Long-Term
(2-5 Year)
|
|
Gold
|
Bullish
(10-Jun-14) |
Bullish
(26-Mar-12) |
Bullish
|
|
US$ (Dollar Index)
|
Neutral
(10-Jul-14) |
Neutral
(10-Jul-14) |
Neutral
(19-Sep-07) |
|
Bonds (US T-Bond)
|
Bullish
(11-Dec-13)
|
Neutral
(18-Jan-12)
|
Bearish |
|
Stock Market
(DJW)
|
Bearish
(07-Apr-14) |
Bearish
(28-Nov-11) |
Bearish
|
|
Gold Stocks
(HUI)
|
Bullish
(10-Jun-14) |
Bullish
(23-Jun-10) |
Bullish
|
|
Oil |
Neutral
(02-Jun-14) |
Neutral
(31-Jan-11) |
Bullish
|
|
Industrial Metals
(GYX)
|
Neutral
(17-Feb-14) |
Bullish
(28-Apr-14) |
Bullish
(28-Apr-14) |
Notes:
1. The date shown below the current outlook is when the most recent outlook change occurred.
2. "Neutral", in the above table, means that we either don't have a
firm opinion or that we think risk and reward are roughly in balance with respect to the timeframe in question.
3. Long-term views are determined almost completely by fundamentals,
intermediate-term views by
fundamentals, sentiment and technicals, and short-term views by sentiment and
technicals.
Commodities Update
As illustrated by the following daily chart
of the Continuous Commodity Index (CCI), commodities, as a group, have recently
been weak. The CCI has worked its way lower over the past three months and has
now retraced about half of its first-quarter rally. We think that this weakness
will turn out to be a short-term correction within the context of an
intermediate-term advance, but there is certainly a risk that heightened
concerns about the euro-zone's banks and economic prospects could lead to
significant additional weakness in all major commodities other than gold and
silver.
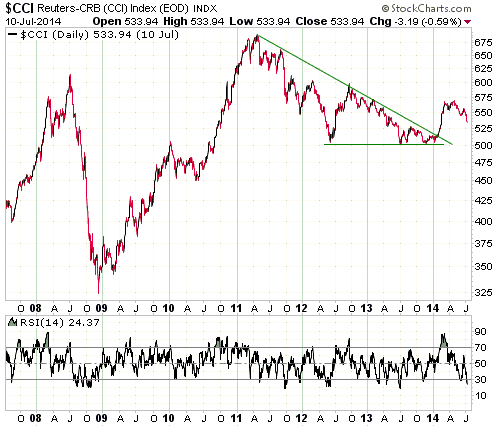
The recent sharp pullback in the oil price has contributed to the weakness in
the CCI, but the grain sector has been the main cause. As illustrated by the
following daily chart, the iPath Grains ETN (JJG) has essentially crashed over
the past two months. It is now at its lowest level in almost 4 years.
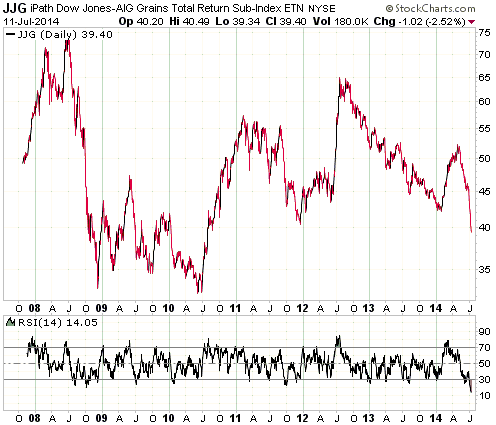
In January of this year we highlighted JJG as a short-term buy in the $43-$44
range and subsequently suggested taking profits, or tightening stops, after it
rallied to $49. Considering the extent to which it is now 'oversold' (both the
daily RSI(14) and the weekly RSI(14) ended last week at their lowest levels in
the ETN's 7-year history), it could be worth buying JJG in anticipation of at
least a multi-week rebound. It could also make sense to take an initial position
in JJG as part of a long-term speculation on higher grain prices. However, we
are not sufficiently enticed by the 'oversold' extreme to buy or formally
recommend JJG at this time. The reason is that while a decent bounce will
probably soon happen, we don't think the potential short-term reward is great
enough to justify the risk.
We will be more inclined to buy JJG if it rebounds, drops to a lower low, and
then turns upward.
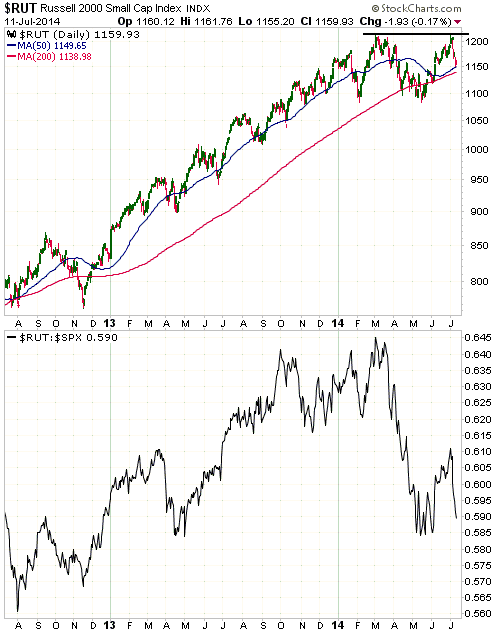
The Stock
Market
The top section of the following daily chart
shows that the Russell2000 Small-Cap Index (RUT) has just reversed lower after
testing its March peak. Although this ushers-in the possibility that a major
'double top' is now in place, there is nothing in RUT's absolute performance to
suggest that the pullback from the high is anything more than a routine
correction. However, the recent sharp downward reversal in the RUT/SPX ratio
illustrated by the bottom section of the following chart is more telling. It
means that the on-going strength in senior US stock indices such as the SPX is
masking deterioration beneath the surface.
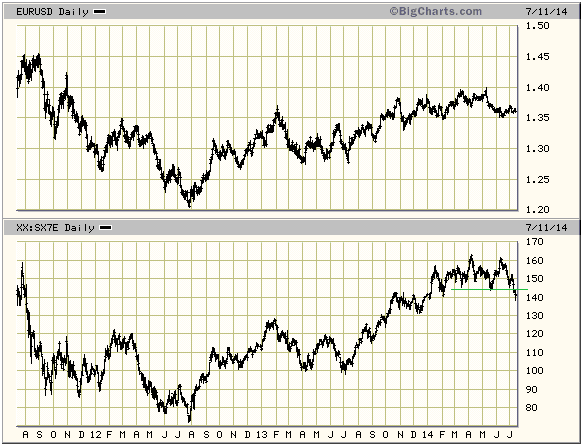
Large-cap European equities, as represented by the EURO STOXX 50 Index (STOX5E),
have pulled back to short-term support in nominal currency terms. Refer to the
top section of the following daily chart for details. However, relative to
large-cap US equities, as represented by the S&P500 Index (SPX), they have
plunged to major support defined by the lows of the past two years. Refer to the
bottom section of the following daily chart for details.
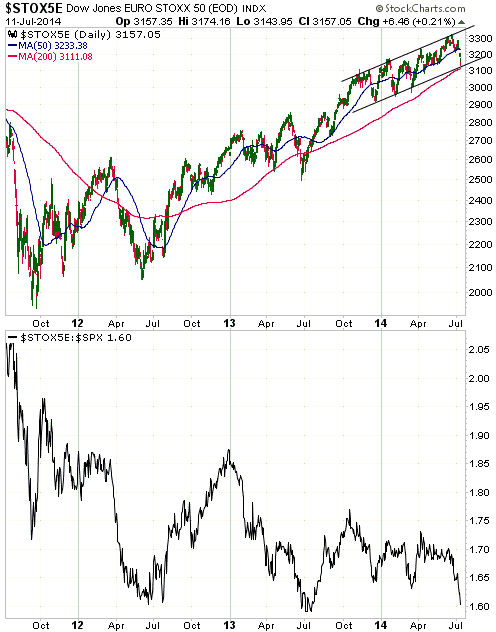
The STOX5E is either close to a bottom in both absolute terms and relative to
the SPX, or an important breakdown is about to happen. The risk of a breakdown
in European equities is one reason that our short- and intermediate-term
outlooks for the Dollar Index have shifted from "bearish" to "neutral".
This week's
important US economic events
| Date |
Description |
| Monday Jul 14 |
No important events scheduled | | Tuesday
Jul 15 |
Retail Sales
Empire State Mfg Survey
Import and Export Prices
Business Inventories | | Wednesday
Jul 16 |
PPI
Industrial Production
Housing Market Index
TIC Report | | Thursday
Jul 17 |
Housing Starts
Philadelphia Fed Survey
|
| Friday Jul 18 |
Consumer Sentiment
Leading Economic Indicators |
Gold and
the Dollar
Gold
Speculators versus Commercials
Speculators, not commercial traders, drive price trends in the gold market. The
proof of this is the simple fact that the speculative net-long position in gold
futures almost always trends in the same direction as the gold price (an
increase in the speculative net-long position almost always accompanies an
increase in price and a decrease in the speculative net-long position almost
always accompanies a decrease in price). It is therefore fair to say that in the
gold market, speculators are price makers and commercials are price takers.
An example is the 2-week period ended 1st July 2014. During this period a
definitive upward reversal in the short-term price trend coincided with a large
increase in the speculative net-long position. Specifically, the price quickly
rose from $1272 to $1328 while the speculative net-long position in COMEX gold
futures jumped by about 80K contracts.
As dictated by basic arithmetic, the 80K-contract increase in the speculative
net-long position during the 2-week period ended 1st July went hand-in-hand with
an 80K-contract increase in the commercial net-short position. These changes in
the speculative and commercial positions are two sides of the same coin. One
would not be possible without the other.
In general terms, speculators, as a group, could never increase their long
exposure to gold futures unless commercial traders (primarily bullion banks), as
a group, were prepared to take the other side of the trade and increase their
short exposure to gold futures, and speculators could never reduce their
net-long position (or become net-short) unless commercials were prepared to
reduce their net-short position (or become net-long). This means that those
commentators who rail against the short-selling of gold futures by bullion banks
and other commercial traders are effectively railing against the buying of gold
futures by speculators.
Moving on, a superficial comparison of the gold price and the commercial
net-position in gold futures could lead to the conclusion that the commercials
are always on the wrong side of the market, except at short-term price extremes.
For example, 'the commercials' were relentlessly net-long during the final six
years of gold's 1980-2001 secular bear market and have been relentlessly
net-short since the beginning of gold's secular bull market. Looking only at
futures positioning could therefore lead to the impression that the commercials
have lost a fortune trading gold, but such an impression would be wrong. The
reality is that the bullion banks (the biggest commercial traders) generally
don't care which way the gold price trends, because they generally don't make
their money by betting on price trends. Instead, their goal is to make money
regardless of price direction by taking advantage of spreads (for example,
spreads between the cash and futures prices and spreads between different
futures contracts) and the charging of commissions.
Current Market Situation
Gold did enough last week to provide us with more evidence of a major reversal
to the upside. Specifically and as illustrated by the following chart, it has
just achieved a weekly close above its 65-week moving average (the blue line on
the chart) and intermediate-term channel resistance.
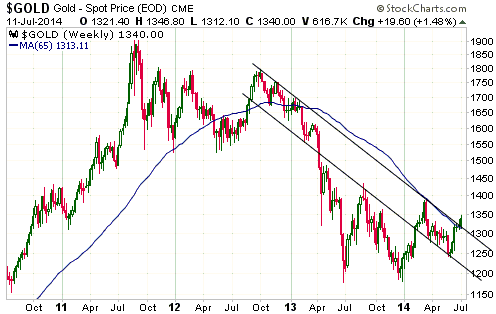
We doubt that this obvious and belated confirmation of strength will lead to a
significant immediate extension of the rally. The reason is that at this early
stage of the new cyclical bull market, gold, silver and the silver/gold ratio
will probably have to 'correct' their 'overbought' conditions before powering
higher. That gold and silver are stretched to the upside on a short-term basis
is indicated by the elevated levels of daily RSIs and the high level -- relative
to where it has been over the past 12 months -- of the speculative net-long
position in COMEX gold futures.
That being said, a substantial correction is unlikely at this time. The 65-week
moving average should now provide strong support, which suggests that gold
should remain above $1310 on a weekly closing basis. The shorter-term moving
averages of importance (the 50-day, 150-day and 200-day moving averages) are now
either into the $1290s or should move into the $1290s within the next three
weeks, which suggests that the $1290s is probably now the worst case for an
intra-day downward spike.
The bottom line is that some consolidation is likely over the coming 2 weeks,
but there remains a good chance that gold will trade in the $1400s before the
end of September. We therefore remain short-term bullish.
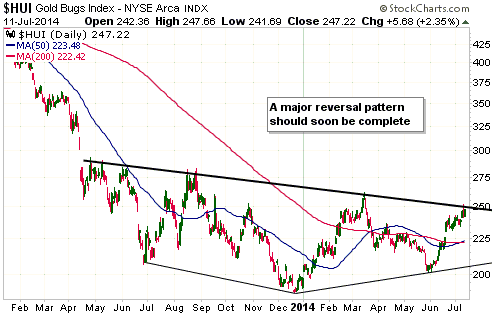
Gold Stocks
Current Market Situation
In the email sent to subscribers after last Thursday's US trading session, we
wrote:
"The gold-stock surge on Wednesday 9th July and the first hour of US trading
on Thursday 10th July enabled the HUI to test intermediate-term resistance (the
top of a major basing pattern) near 250. The HUI and most individual gold stocks
reversed sharply lower following this test of resistance, which suggests that
the Wednesday-Thursday surge was a minor extension to the upward leg that got
underway at the end of May and not the beginning of a new multi-week upward leg.
Resistance near 250 could soon be re-tested, but our guess is that it will be a
few weeks before this resistance is decisively breached. In the meantime,
downside risk for the HUI will continue to be defined by a confluence of moving
averages in the 220s.
Although we expect the HUI to stay in the 225-250 range for a few more weeks, we
remain short-term bullish on the expectation that it will trade up to around 300
by the end of September."
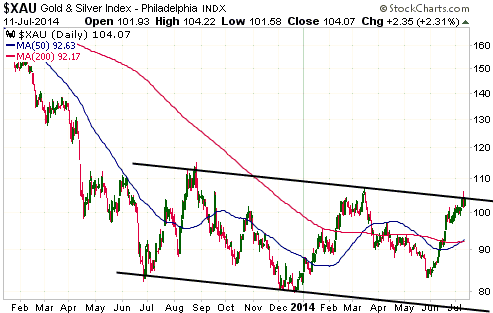
The first of the following daily charts shows the HUI resistance to which we
were referring. The second chart shows that the XAU has just challenged similar
resistance.
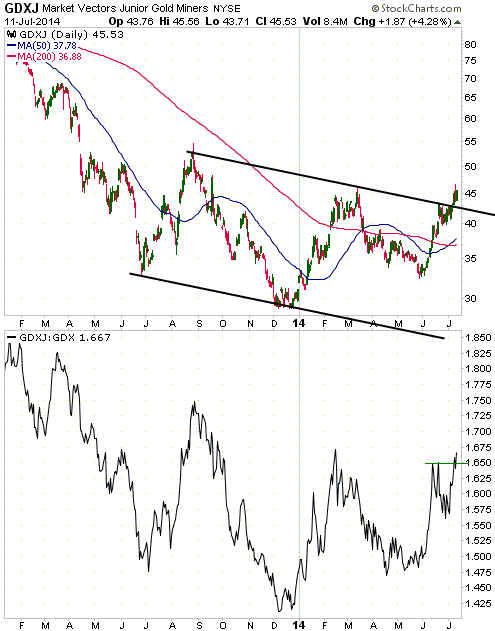
Importantly, since it is leading the HUI and the XAU, GDXJ has already broken
above the top of its major basing pattern (refer to the top section of the
following daily chart for details). Also of importance, the GDXJ/GDX ratio (the
bottom section of the following chart) has just closed above last month's high.
This tells us that while it is reasonable to assume that the HUI's moving
averages in the mid-220s define the near-term downside risk, the HUI probably
won't trade that low before resuming its rally.
As we noted in the 30th June Weekly Update, major basing/reversal patterns are
not only apparent in the charts of the HUI and GDXJ, they are also clearly
evident in the charts of many individual gold stocks. As we also noted in the
30th June Weekly Update, it doesn't get any better than this.
Time to start increasing exposure to large, lower-quality gold deposits
Large, low-quality (meaning: needing a much higher gold price to be economic)
gold deposits currently provide the greatest leverage to changes in the gold
price, because in most cases the stocks of the companies that own these deposits
have been beaten down to the point where the in-ground gold is being valued at
almost nothing. With more evidence now in hand that a new cyclical gold bull
market has begun, it could make sense for risk-tolerant speculators to start
increasing their exposure to such stocks.
When deciding which large, low-quality gold deposits to buy into, we think that
speculators should limit themselves to companies that a) are being valued by the
market at less than $15 per ounce of M&I gold, b) have sufficient cash to fund
their work programs for at least the next 12 months, c) operate in a secure
jurisdiction, and d) own a flagship gold project that would potentially be
economic at a gold price of $1500/oz. In the TSI Stocks List, Sabina Gold and
Silver (SBB.TO) meets this set of criteria. Examples of non-TSI stocks that meet
the above-mentioned criteria are Chesapeake Gold (CKG.V), Sandspring Resources (SSP.V)*
and Sunward Resources (SWD.TO).
We plan to add three companies with large, low-quality gold deposits to the TSI
List and treat these stocks as a single trade. The first inclusion in this group
will be Sunward Resources, which is discussed below. The other inclusions will
be identified within the next few months based on our research and the market
action.
*Current member of the TSI Small Stocks Watch List
Correlation between gold stocks and the broad stock market
The correlation between the HUI and the S&P500 Index has generally been negative
(the two indices have mostly trended in opposite directions) over the past three
years. We expect this negative correlation to persist for at least the next 12
months, but the HUI will be vulnerable to sharp stock-market sell-offs when it
is short-term 'overbought' (like it is right now). In other words, we expect
that a strengthening gold sector will generally go with a weakening broad stock
market for the foreseeable future, but that gold stocks will be adversely
affected by sharp stock-market declines that unfold when the gold sector happens
to be stretched to the upside.
On a related matter, the probability of a 2008 repeat (or something similar)
will remain extremely low until after either the pace of US monetary inflation
or the pace of G2 (US plus euro-zone) monetary inflation becomes much slower.
Another big sentiment shift in the works
Although we've seen it happen countless times, we never cease to be impressed by
the way that market sentiment can shift from abject pessimism to rampant
optimism and back again with no change in fundamentals. Weeks or months will go
by with a particular market seemingly in an unstoppable downward trend and
incapable of staging a tradable rally, but then, with no discernible change in
fundamentals, all news is suddenly treated as good news and the same market that
seemed destined to remain in the dustbin forever becomes the focus of bullish
speculation.
In the precious metals sector, periods of dour sentiment are often attributed to
the effects of deliberate price suppression. However, the sentiment swings
happen in all markets, especially the markets that have substantial involvement
by the investing public. They are not a function of manipulation, although they
are certainly exacerbated by the monetary machinations of central banks.
There are signs that a major sentiment swing has begun in the gold-mining
sector. As recently as May of this year it seemed as if most gold-mining stocks
couldn't get out of their own way, but they have clearly started coming into
favour. Don't be surprised if two months from now the gold sector is performing
so well that even a short-term pullback appears to be out of the question.
The Currency Market
Our short- and intermediate-term outlooks for the Dollar Index shifted from
"bearish" to "neutral" last week. This reflects uncertainty stemming largely
from the fact that European equities have recently been weaker than expected
relative to US equities (we have been anticipating relative strength in European
equities stemming from lower average valuations and relatively easy monetary
policy in Europe). It is also a response to the break below short-term support
by the EURO STOXX Banks Index (SX7E). As depicted below, over the past few years
the euro has generally moved in the same direction as the SX7E. Last week's
downside breakout in the SX7E could therefore be a bearish omen for the euro.
In the euro's favour is a large speculative net-short position in euro futures.
Short-term downside risk is mitigated by the fact that speculators, as a group,
have already positioned themselves for additional euro weakness.
Updates
on Stock Selections
Notes: 1) To review the complete list of current TSI stock selections, logon at
http://www.speculative-investor.com/new/market_logon.asp
and then click on "Stock Selections" in the menu. When at the Stock
Selections page, click on a stock's symbol to bring-up an archive of
our comments on the stock in question. 2) The Small Stock Watch List is
located at http://www.speculative-investor.com/new/smallstockwatch.html
 Company
news/developments for the week ended Friday 11th July 2014: Company
news/developments for the week ended Friday 11th July 2014:
[Note: AISC = All-In Sustaining Cost, FS = Feasibility Study, IRR =
Internal Rate of Return, MD&A = Management Discussion and Analysis,
M&I = Measured and Indicated, NAV = Net Asset Value, NPV(X%) = Net
Present Value using a discount rate of X%, P&P = Proven and
Probable, PEA = Preliminary Economic Assessment, PFS =
Pre-Feasibility Study]
*Almaden Minerals (AAU) reported drilling results from its
Tuligtic gold-silver project in Mexico. There were some good
intercepts, but the significance level is low because the purpose of
the drilling was solely to enable some of the project's Inferred
resources to be updated to the M&I category. The project currently
has about 3.5M gold-equivalent ounces in the M&I category and about
0.7M gold-equivalent ounces in the Inferred category.
The Tuligtic project is big enough and its economics are good enough
that it will probably become attractive to a mid-tier miner after
the gold price makes a sustained break above $1400.
*Asanko Gold (AKG) reported drilling results from Dynamite Hill, a
gold deposit located approximately 7 km to the north-east of the
planned processing facility for Phase 1 of the Asanko Gold Mine in
Ghana, West Africa. These and other drilling results indicate that
Dynamite Hill could be mined to supplement ore feed from the main
Phase 1 pit at Nkran during the first few years of the Asanko mine's
operation.
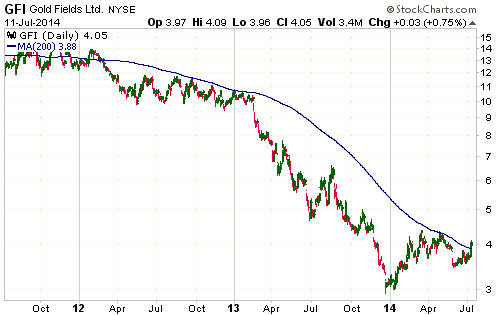
*Gold Fields Ltd (GFI) is not in the TSI Stocks List, but the TSI
List has some exposure to GFI in the form of January-2016 $5.00 call
options.
GFI closed above its 200-day MA last week. This is noteworthy
because it's the first time it has happened since early-2012 (see
chart below). It is not too late to buy some exposure to GFI.
Among the senior gold stocks, GFI and KGC offer the best value.
*Golden Star Resources (GSS) produced 65.8K ounces of gold during
the March quarter of this year, which meant that it had to produce
about 234K ounces of gold over the remainder of the year, or an
average of 78K ounces per quarter over the ensuing three quarters,
to achieve its 2014 production guidance of 300K ounces.
Last week the company reported that it produced 61.7K ounces of gold
during the June quarter. This is well below plan and almost
guarantees that the current 2014 production guidance will NOT be
achieved. We suspect that GSS will end up producing around 270K
ounces of gold this year.
270K ounces is still a lot of gold production for a company with an
enterprise value of around US$290M, but GSS's balance sheet is now
becoming a concern. The company is not in immediate danger of
running out of money (it has $43M of cash and $10M of undrawn
credit), but last quarter's sub-par production result means that the
balance sheet is continuing to weaken at a worrisome pace. Although
GSS is likely to benefit from better operational performance and a
higher gold price over the next few months, it has no margin of
safety and is therefore a high-risk proposition. Due to its gearing
and gold-price leverage, it is also a high-reward proposition.
*Premier Gold (PG.TO) reported a resource re-estimate for the
Hardrock gold deposit at its Trans Canada project in Ontario. The
project's total resource has increased from around 7M ounces to
around 7.6M ounces, but of far greater importance is the fact that
the open-pit Indicated resource has increased by almost 70% to
around 4M ounces. This news was the primary catalyst for PG's break
above the top of a major basing pattern last Tuesday.
The stock market's initial reaction to the news was appropriate.
This is a very positive development.
*Pilot Gold (PLG.TO) reported another set of interesting drilling
results from its Kinsley Mountain gold project in Nevada. Highlights
included intercepts of 38.1m averaging 5.59-g/t gold, 30.5m
averaging 3.51-g/t gold and 12.5m averaging 8.35-g/t, from three
separate step-out holes drilled into the Western Flank target.
Assays are pending for 8 holes, so there will soon be more
exploration news.
Kinsley Mountain's potential continues to be confirmed by the "truth
machine" (the drill rig), although PLG is still a long way from
having proven-up an economically-viable gold deposit at this
project. A lot more drilling and modeling will be required.
*Ramelius Resources (RMS.AX) announced that it produced 25.4K
ounces of gold during the June quarter. This is in line with
guidance.
*Sabina Gold and Silver (SBB.TO) announced the sale of a non-core
asset (its stake in the Del Norte and Midas prospects in BC) for a
small sum of money. This isn't material to SBB's value.
First
inclusion in the group of junior stocks with large, low-quality gold deposits
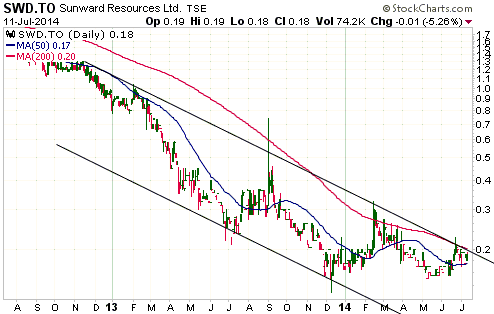
As stated above, Sunward Resources (SWD.TO) is the first member of our
group-trade focused on large, low-quality gold deposits. SWD has 142M shares
outstanding (152M on a fully diluted basis), C$23M of cash in the bank, no debt,
and 100% ownership of the large, low-grade Titiribi gold-copper project in
Colombia.
The latest resource estimate shows that Titiribi has 10.6M ounces of gold, 4.6M
of which are in the M&I category and 6.0M of which are Inferred. It also has
870M pounds of copper, 654M of which are in the M&I category. From our
perspective the copper component is important, because we expect the copper
price to work its way higher, in fits and starts, over the next 12 months. The
average resource grade is 0.50-g/t for gold and 0.17% for copper.
No analysis of Titiribi's economics has yet been carried out, so to a certain
extent the buyers of SWD shares are 'flying blind'. However, testing done to
date suggests that there are no major metallurgical obstacles with the deposit.
This, in turn, means that the project could be economic at $1500/oz, despite the
low grade.
The Colombia location is far from ideal (much better than Venezuela, Bolivia and
Ecuador, but nowhere near as good as Chile and Peru), but is not a deal-breaker.
Importantly, the risks posed by the deposit's low grade, the Colombia location
and the current lack of a preliminary economic analysis are counteracted by an
extremely low valuation. At Friday's closing price of C$0.18, SWD has a market
cap of C$26M. With net cash of C$23M, this means that the 10M-ounce deposit is
currently being valued at only C$3M and that downside risk from here is very
small compared to reward potential.
We caution that the stock is illiquid. In fact, it is far too illiquid to be
used as a short-term trading vehicle. Also, it has been 'dead money' for the
past 9 months and could continue to be 'dead money' until after there is
wider-spread belief that gold has reversed upward for real.
List
of candidates for new buying
From within the ranks of TSI stock selections, the best candidates for new
buying at this time are:
1) AAU (last Friday's closing price: US$1.44).
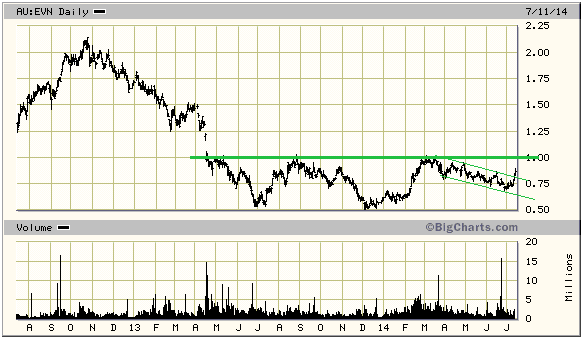
2) EVN.AX at A$0.85 or lower (last Friday's closing price: A$0.87). Note: The
following daily chart shows that EVN broke out to the upside from a short-term
channel last Friday. It will encounter substantial resistance at A$1.00 (the top
of its long-term base), but once through A$1.00 the chart-based objective will
be A$1.50.
3) RSG.AX (last Friday's closing price: A$0.63).
4) SBB.TO in the low-C$0.80s (last Friday's closing price: C$0.88).
List
of candidates for selling
From within the ranks of TSI stock selections, short-term selling opportunities
would arise as outlined below.
1) AKG near US$3.00 (last Friday's closing price: US$2.67).
2) ORE.TO near C$1.00 (last Friday's closing price: C$0.90). Note that for TSI
record purposes, unless advised otherwise the short-term position in ORE will be
exited if it trades at C$0.98.
3) PG.TO near C$3.50 (last Friday's closing price: C$3.35).
4) PVG in the US$9.00-$10.00 range (last Friday's closing price: US$8.60). Note
that for TSI record purposes, unless advised otherwise PVG will be exited if it
trades at US$9.50. This is due to the question mark that hangs over its resource
estimate. This question mark creates an unquantifiable risk, in that while there
is no doubt that PVG has its hands on a valuable gold deposit the current mine
plan will have to be 'thrown out the window' if it turns out that selective
underground mining, rather than bulk underground mining, is the right approach.
Removing
the Agnico Eagle (AEM) February-2015 $35.00 call options from the TSI List
Long-dated AEM call options were a (very) poorly-timed addition to the TSI List
in February of 2013. However, due to AEM's recent strong rally there is now a
48% profit on this position. The options are still 7 months from expiry, but for
TSI record purposes we are exiting now because AEM is very 'overbought' on a
short-term basis and expensive relative to most other 1M-oz+ gold producers.
Chart Sources
Charts appearing in today's commentary
are courtesy of:
http://stockcharts.com/index.html
http://bigcharts.marketwatch.com/

|
