|
-- Weekly Market Update for the Week Commencing
14th October 2013
Big Picture
View
Here is a summary of our big picture
view of the markets. Note that our short-term views may differ from our
big picture view.
In nominal dollar terms, the BULL market in US Treasury Bonds
that began in the early 1980s will end by 2013. In real (gold)
terms, bonds commenced a secular BEAR market in 2001 that will continue
until 2014-2020. (Last
update: 23 January 2012)
The stock market, as represented by the S&P500 Index,
commenced
a secular BEAR market during the first quarter of 2000, where "secular
bear market" is defined as a long-term downward trend in valuations
(P/E ratios, etc.) and gold-denominated prices. This secular trend will bottom sometime between 2014 and 2020.
(Last update: 22 October 2007)
A secular BEAR market in the Dollar
began during the final quarter of 2000 and ended in July of 2008. This
secular bear market will be followed by a multi-year period of range
trading.
(Last
update: 09 February 2009)
Gold commenced a
secular bull market relative to all fiat currencies, the CRB Index,
bonds and most stock market indices during 1999-2001.
This secular trend will peak sometime between 2014 and 2020.
(Last update: 22 October 2007)
Commodities,
as represented by the Continuous Commodity Index (CCI), commenced a
secular BULL market in 2001 in nominal dollar terms. The first major
upward leg in this bull market ended during the first half of 2008, but
a long-term peak won't occur until 2014-2020. In real (gold) terms,
commodities commenced a secular BEAR market in 2001 that will continue
until 2014-2020.
(Last
update: 09 February 2009)
Copyright
Reminder
The commentaries that appear at TSI
may not be distributed, in full or in part, without our written permission.
In particular, please note that the posting of extracts from TSI commentaries
at other web sites or providing links to TSI commentaries at other web
sites (for example, at discussion boards) without our written permission
is prohibited.
We reserve the right to immediately
terminate the subscription of any TSI subscriber who distributes the TSI
commentaries without our written permission.
Outlook Summary
Market
|
Short-Term
(1-3 month)
|
Intermediate-Term
(6-12 month)
|
Long-Term
(2-5 Year)
|
|
Gold
|
Neutral
(10-Sep-13)
|
Bullish
(26-Mar-12)
|
Bullish
|
|
US$ (Dollar Index)
|
Neutral
(24-Dec-12)
|
Neutral
(18-Sep-13)
|
Neutral
(19-Sep-07)
|
|
Bonds (US T-Bond)
|
Bullish
(24-Jun-13)
|
Neutral
(18-Jan-12)
|
Bearish |
|
Stock Market
(DJW)
|
Neutral
(18-Sep-13)
|
Bearish
(28-Nov-11)
|
Bearish
|
|
Gold Stocks
(HUI)
|
Neutral
(10-Sep-13)
|
Bullish
(23-Jun-10)
|
Bullish
|
|
Oil |
Neutral
(30-Jul-12)
|
Neutral
(31-Jan-11)
|
Bullish
|
|
Industrial Metals
(GYX)
|
Neutral
(30-Jul-12)
|
Neutral
(29-Aug-11)
|
Neutral
(11-Jan-10)
|
Notes:
1. In those cases where we have been able to identify the commentary in
which the most recent outlook change occurred we've put the date of the
commentary below the current outlook.
2. "Neutral", in the above table, means that we either don't have a
firm opinion or that we think risk and reward are roughly in balance with respect to the timeframe in question.
3. Long-term views are determined almost completely by fundamentals,
intermediate-term views by
fundamentals, sentiment and technicals, and short-term views by sentiment and
technicals.
Future "inflation" and
monetary madness
The Fed's mode of operation has drastically
changed over the past 12 years. Prior to 2002 the Fed would tighten monetary
policy in reaction to outward signs of rising "price inflation" and loosen
monetary policy in reaction to outward signs of falling "price inflation", but
beginning in 2002 the Fed became far more biased towards loose monetary policy.
This bias is now so great that we are starting to wonder whether the Fed has
become permanently loose.
The following chart comparing the Fed Funds Rate (FFR) target set by the Fed
with the Future Inflation Gauge (FIG) clearly illustrates how the Fed has
changed over the past two decades. Note that the Future Inflation Gauge is
calculated monthly by the Economic Cycle Research Institute (ECRI) and should
really be called the Future CPI Gauge, because it is designed to lead the CPI by
about 11 months.
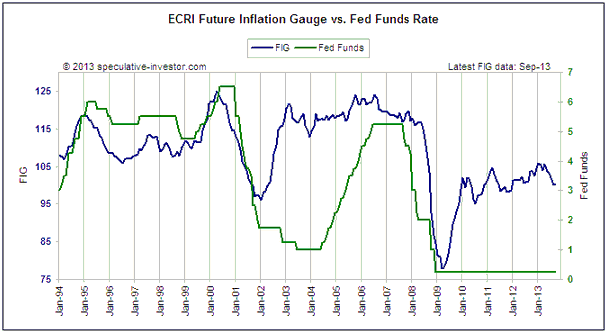
The chart shows that prior to 2002 the FFR tended to follow the FIG. After the
FIG warned of rising "price pressures" the Fed would start hiking the FFR, and
after the FIG started signaling reduced upward pressure on the CPI the Fed would
start cutting the FFR. During 2002-2004, however, the Fed not only didn't hike
its targeted interest rate in response to a sharp increase in the FIG, it
continued to cut the FFR.
The Fed's decision to maintain an ultra-loose stance during 2002-2004 was the
fuel for the real estate investment bubble and set the stage for the collapse of
2007-2009.
There was a lesson to be learned from what happened during 2002-2007, but the
Fed apparently learned the wrong lesson. The lesson that should have been
learned was: Don't provide monetary fuel for bubble activities, because the
eventual economic fallout will be devastating. Unfortunately, the lesson that
was actually learned by the Fed was: An economic bust can be avoided forever by
keeping monetary policy loose forever. The result is that the divergence between
the FFR and the FIG that arose during the first half of the last decade is
nothing compared to the divergence that is now in progress. Moreover, the
near-zero FFR doesn't do justice to the 'looseness' of the Fed's current stance,
in that 4+ years after the end of the last official recession the Fed is still
pumping money as if the US were in the midst of a financial crisis.
By the way, this year's small decline in the FIG suggests that there is not
going to be a significant change in the CPI's growth rate over the next 6-12
months. If so, policy-makers at the Fed will probably conclude that they have
plenty of leeway to maintain an ultra-loose monetary stance.
By ignoring investment bubbles and erring far more in favour of "inflation" than
it has ever done in the past, the Fed is currently setting the stage for the
mother-of-all economic busts. We don't have an opinion on when the bust will
happen and how it will unfold, other than we do not expect it to happen within
the next six months and we do expect that it will be very different to the bust
of 2007-2009.
Gold and Bonds
Gold and Treasury Bonds have moved in the same
direction during some periods and in opposite directions during other periods.
As illustrated by the following chart, the past three years has been one of
those periods when they've tended to move in the same direction.
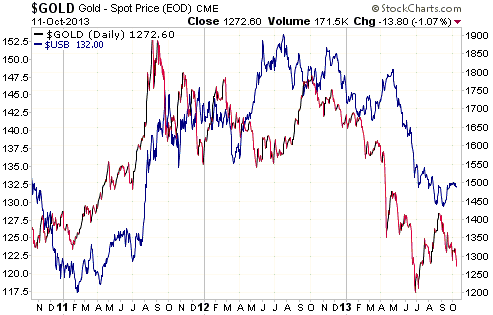
When US$ inflation expectations are high or rising sharply, gold is usually the
safe haven of choice. When US$ inflation expectations are falling sharply,
T-Bonds are usually the safe haven of choice. But when US$ inflation
expectations are stable at a relatively low level, it will be normal for both
gold and T-bonds to be popular refuges during periods when financial-system risk
is perceived to be high. That, in essence, is why gold and T-bonds have trended
together over the past three years. Over the past three years they have both
been popular refuges in times of trouble, which resulted in them rallying
sharply together during the first 9 months of 2011 in response to rising fears
of euro-zone financial collapse, leveling off between September of 2011 and
early 2013, and then plunging in response to this year's 'risk-on' surge.
At this stage we think it's likely that gold and T-bonds will maintain a
generally positive correlation over the coming 12 months, with both rallying
when economic confidence declines or systemic threats emerge and both falling
when economic confidence rises or systemic threats dissipate. If we are wrong it
will probably be due to a sudden increase in US$ inflation fear that causes a
sharp move to the upside in gold in parallel with a sharp move to the downside
in T-Bonds. In our opinion, the most unlikely 12-month outcome would entail a
large gain for T-bonds in parallel with a large loss for gold.
The Stock
Market
The US
The Banks
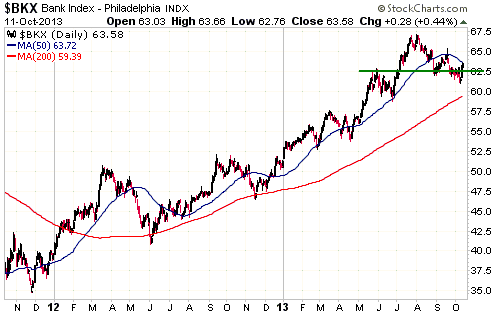
The Bank Index (BKX) broke out to the downside during the first half of last
week but negated the breakout during the final two days of the week. The chart
pattern is currently neutral, needing a break above the September rebound high
to signal a resumption of the longer-term upward trend or a sustained break
below $62 to confirm that an intermediate-term decline is in progress.
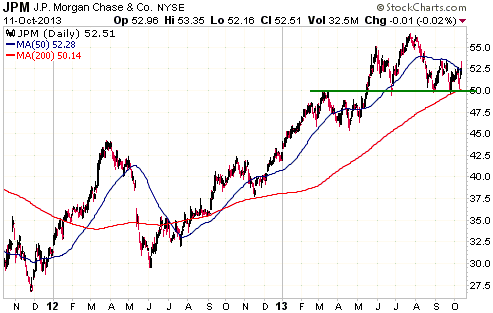
The following price chart of JP Morgan (JPM), the bank that many 'goldbugs' love
to hate, looks more precarious than the BKX price chart displayed above. JPM
hasn't yet broken below support at $50, but it appears to be rolling over to the
downside.
Last Friday JPM reported a loss for the third quarter of this year. The loss was
obviously anticipated because the stock price initially rose in reaction to the
news, but the gains were quickly given back despite strength in the broad stock
market. Friday's price action therefore maintained the bearish look of JPM's
price chart.
The Overall Market
The number of individual stocks making new 52-week highs, an important indicator
of market breadth, has been deteriorating for months. Specifically, the number
of individual NYSE stocks making new highs has been in a downward trend since
May and the number of individual NASDAQ stocks making new highs has been in a
downward trend since July, despite the NYSE and NASDAQ composite indices having
remained in upward trends. This divergence shows that progressively fewer stocks
have been driving the indices upward. It is a bearish divergence, but one that
could continue for longer before it matters.
In last week's Interim Update, we wrote:
"Here's a scenario that appeals to us: A stock market rally soon commences on
the back of political deals that ensure full government funding for at least a
few more months. This rally takes some stock indices to new highs for the year,
but the Dow doesn't come close to its September high before running out of
steam. Some indices, including the Dow, then fall to new multi-month lows,
leading to general fear that the future might not be as bullish as previously
envisaged."
The following daily charts show that the Dow has since retraced about half of
its preceding decline and remains well below its September high, while the
NASDAQ100 Index (NDX) has moved back to near its high for the year. This paves
the way for the NDX to soon make a new high for the year while the Dow makes a
lower high. As long as the Dow fails to confirm the NDX's new high, the ensuing
declines in both indices should be significant.
The World
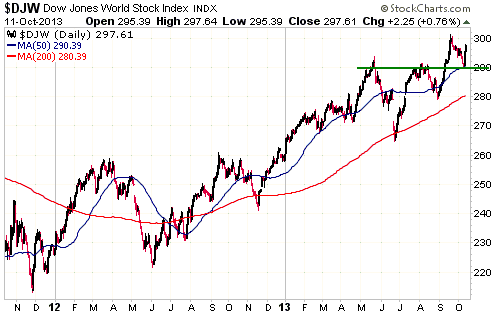
The Dow Jones World Index (DJW) completed a normal pullback to support at 290.
It is set to soon make a new high for the year, but the remaining short-term
upside potential looks small relative to the downside risk.
Our short-term stock market outlook will shift to "bearish" if the DJW closes
below 290 or moves up to 310 within the next three weeks.
This week's
important US economic events
| Date |
Description |
| Monday Oct 14 |
No important events scheduled | | Tuesday
Oct 15 |
Empire State Mfg Survey | | Wednesday
Oct 16 |
CPI
TIC Report
Housing Market Index
Fed's Beige Book | | Thursday
Oct 17 |
Housing Starts
Industrial Production
Philadelphia Fed Survey
|
| Friday Oct 18 |
Leading Economic Indicators |
Gold and
the Dollar
Gold and Silver
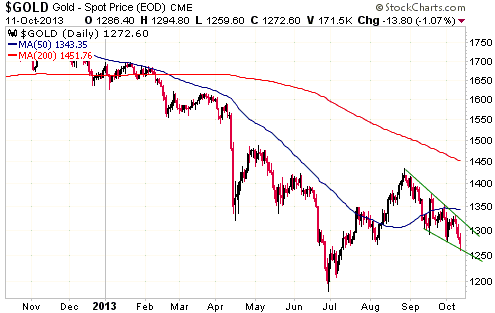
Gold continues to work its way down to an October-November (probably October)
low. On Friday it traded about 1% below its August low and ended the week
roughly level with its August low. It also ended the week just above the bottom
edge of a declining 'wedge' pattern. This could prompt a bounce as some
short-term traders buy in anticipation of support holding.
A daily close above the September intra-day high of $1376 is needed to prove,
beyond reasonable doubt, that a new upward trend has begun. However, a daily
close above last week's intra-day high of $1331 would now be an early warning of
a short-term trend reversal.
An important price bottom could be put in place at any time, but there is still
downside risk to the vicinity of the late-June low ($1150-$1200).
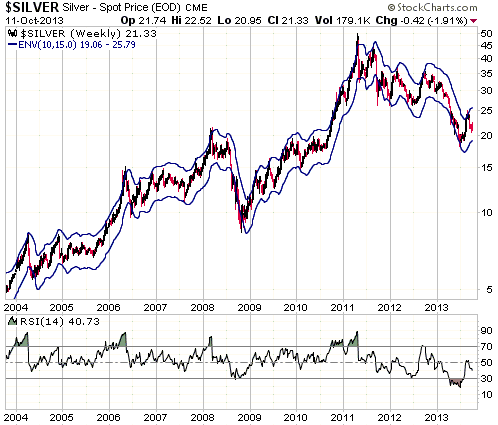
The following weekly chart of the silver price shows the moving-average envelope
that limits silver's short- and intermediate-term price trends in all but the
most extreme situations. The bottom of the MA envelope is presently just above
$19.00. This suggests that silver has short-term downside potential to around
$19.
Our plan is to buy some physical silver if we get the chance to do so in the
$19-$20 range within the next three weeks.
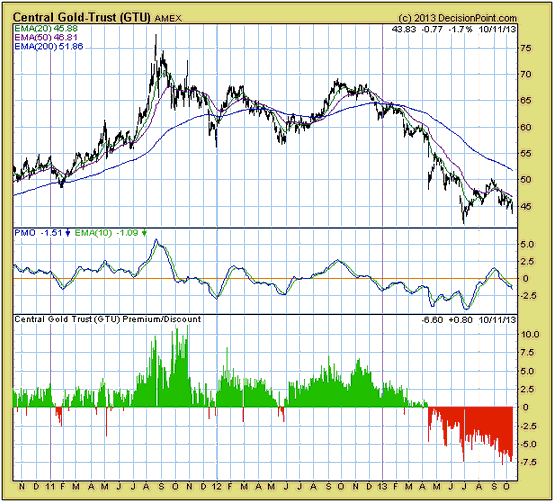
It is currently possible to purchase exposure to gold and silver bullion at
significant discounts to spot prices. This can be done by purchasing units of
Central Gold Trust (GTU) for exposure to gold bullion and Central Fund of Canada
(CEF) for exposure to gold and silver bullion. The reason is that these
closed-end bullion funds are trading at unusually large discounts to their net
asset values.
As illustrated by the following chart, GTU began trading at a discount to its
NAV in April and the discount has since expanded. The discount to NAV was 6.6%
at the end of last week, which means that buying GTU units near the close of
trading last Friday was equivalent to buying gold bullion at $1188/oz.
CEF ended last week at a 7.1% discount to its NAV. This means that buying CEF
units near the close of trading last Friday was equivalent to buying gold
bullion at $1182/oz and silver bullion at $19.80/oz.
The above-mentioned discounts to NAV reflect the depressed sentiment in the gold
and silver markets. Within the next two years both GTU and CEF are likely to
trade at sizable premiums to NAV.
Gold Stocks
The historical tendency of a market to make an intermediate-term extreme within
a certain time window provides useful clues about the future on those occasions
when the market in question trends strongly into the turning-point window and
then reverses direction. Such reversals are usually followed by trends lasting
at least 6-12 months in the opposite direction.
The gold sector is clearly in a downward trend and is within its traditional
October-November turning-point window. This means that an upward reversal within
the next few weeks would very likely lead to a rally lasting at least 6-12
months. Our opinion is that it would lead to a multi-year cyclical bull market,
but there is no need to look that far ahead. First, we need to get the upward
reversal.
At the end of last week the HUI was 'oversold' and marginally above its
late-June low. This means that a test of the late-June low is now happening.
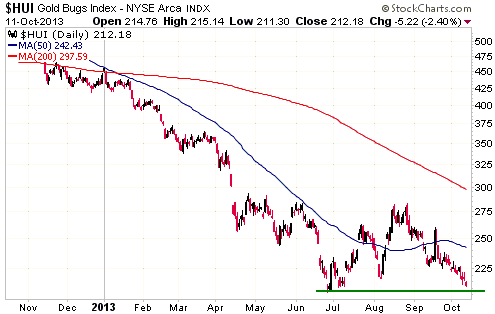
An upward reversal that marks an important turning point could take a number of
different forms. For example, it could involve a sharp decline during the early
part of the trading day followed by a complete recovery to end the day with a
gain. Like pornography, we'll know it when we see it.
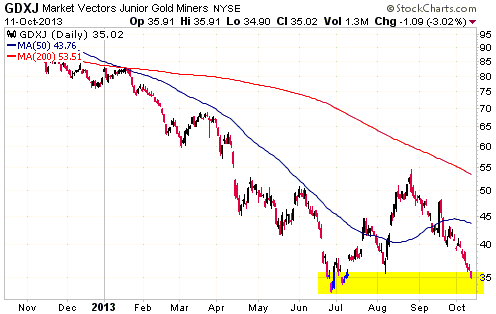
GDXJ, an ETF proxy for the junior end of the gold sector, has dropped back to
intermediate-term support defined by its June-August lows. It would be
reasonable for long-term speculators to average into GDXJ over the next few
weeks, beginning immediately, but short-term traders should wait for evidence
that the price trend has reversed.
Currency Market Update
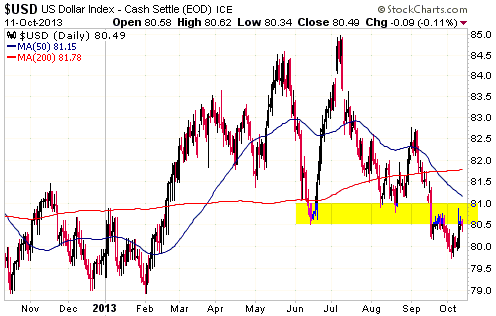
Since breaking below support at 80.5-81.0 in September, the Dollar Index has
twice rebounded to this former support (now resistance). Consecutive daily
closes above 81 would indicate that a short-term bottom is in place, but
until/unless that happens it will make sense to anticipate a test of
intermediate-term support at 79.
We expect that support at 79 will hold if tested over the next two months, but
it could be breached next year. Breaching intermediate-term support at 79 would
project a test of long-term support at around 73.
Update
on Stock Selections
Notes: 1) To review the complete list of current TSI stock selections, logon at
http://www.speculative-investor.com/new/market_logon.asp
and then click on "Stock Selections" in the menu. When at the Stock
Selections page, click on a stock's symbol to bring-up an archive of
our comments on the stock in question. 2) The Small Stock Watch List is
located at http://www.speculative-investor.com/new/smallstockwatch.html
 Company
news/developments for the week ended Friday 11th October 2013: Company
news/developments for the week ended Friday 11th October 2013:
[Note: FS = Feasibility Study, IRR = Internal Rate of Return, MD&A =
Management Discussion and Analysis, M&I = Measured and Indicated,
NAV = Net Asset Value, NPV(X%) = Net Present Value using a discount
rate of X%, P&P = Proven and Probable, PEA = Preliminary Economic
Assessment, PFS = Pre-Feasibility Study]
*Carpathian Gold (CPN.TO): During a week when the TSI Stocks List
copped more than its fair share of company-specific bad news, the
worst news came from CPN. Due to its weak balance sheet and gold
hedge book we've been cool on CPN for more than 12 months and
suggested scaling out of the stock in August after it rose to the
low-C$0.20s, so the CPN news probably didn't cause as much financial
pain as the PVG news. However, whereas the PVG news will most likely
turn out to be a 'bump in the road', the CPN news points to there
being little hope of recovery. Whereas PVG has its hands on one of
the world's most valuable undeveloped gold deposits and should
eventually generate good returns for shareholders, CPN has run out
of money and is unlikely to survive in its current form.
Due to commissioning delays at its RDM gold project in Brazil, lack
of money and the difficulty of raising additional money in today's
market, CPN's management has decided to pursue "strategic
alternatives". According to last week's press release: "The various
alternatives being considered include, but are not limited to, a
business combination with another company, a recapitalization, a
sale of the corporation or its assets, a strategic investment in the
corporation or its subsidiaries by a third party or any combination
thereof."
We see two possible outcomes. One is that the company will be able
to do a deal that results in its stock price recovering from the
current C$0.08 to C$0.15-$0.20. The other is that CPN shareholders
end up with nothing. At this stage it's a coin toss.
To make room for a stock with brighter long-term prospects (we have
a few candidates in mind, but probably won't make a decision until
we see evidence that the gold sector has bottomed), we have removed
CPN from the TSI Stocks List and recorded a large loss on the
position.
*Dragon Mining (DRA.AX) announced that it has a maximum potential
liability of 800,000 Swedish Krona (about US$125,000) stemming from
a charge -- that the company denies -- of non-permitted
environmental activities. This is not financially significant.
*Pretium Resources (PVG): No more light was shed on the Strathcona
resignation over the final two days of last week. As far as we can
tell, neither of PVG's independent consultants has a problem with
how the material for the 10,000-tonne bulk sample was selected. The
disagreement between Snowden and Strathcona concerns the best way to
reconcile the excavated material with the resource model. Strathcona
wanted to rely on representative samples taken on site using a
sample tower. Snowden wants to rely on the total amount of gold
produced from milling the entire 10,000 tonnes of excavated
material.
Note that in the above paragraph we said "reconcile the excavated
material with the resource model", not "reconcile the excavated
material with the resource estimate". There's a significant
difference that we suspect gets to the root of the disagreement
between Strathcona and Snowden. It's not only important that the
total amount of gold in the actual deposit matches the resource
estimate, but also that the gold is where the resource model
predicts it to be.
Snowden will now be doing the final auditing and reporting on the
Bulk Sample Program (BSP), but the results of the tower samples that
would have been used by Strathcona to validate the resource model
will still be reported. Therefore, analysts and investors who
believe that Strathcona's approach would yield the more reliable
conclusions regarding the validity of the resource model will still
have access to the relevant data.
From an investor's perspective the problem now is that even if the
results of the BSP turn out to be as good as PVG's senior management
expects, Strathcona's resignation will ensure the persistence of
skepticism. Consequently, PVG probably won't return to the $10+
levels over the next few months even if the BSP results are
positive. That being said, due to the extent that the stock sold off
last week it should rebound strongly after the dust settles and the
overall sector reverses upward.
We neither bought nor sold PVG shares in the aftermath of last
week's news-related price plunge. We might add to our PVG stake
following evidence of a sector-wide bottom, but we also might wait
for the BSP results before doing anything. We haven't yet decided.
One of the most sensible and objective responses to the recent PVG
news can be read at
http://www.metalaugmentor.com/reviews/bulk-sample-update/.
*Ramelius Resources (RMS.AX) is scheduled to close its 1-for-4
rights issue within the next two weeks. Given that the stock is
trading at A$0.13 and the rights are exercisable at A$0.18, it
obviously doesn't make sense to exercise the rights. If you want to
increase your exposure to this stock you should buy shares on the
market at A$0.13 or less. The stock is a good speculation at A$0.13
and would be an excellent speculation near its low for the year
(A$0.10-A$0.11).
*Rio Alto Mining (RIO.TO, RIOM) announced record quarterly
production of 59K ounces for the September quarter. The record isn't
going to stand for long, though, because the December quarter's
production is expected to be at least 10% higher. Production for
this year should end up being near the top of the company's
190K-210K guidance range.
It's a tough market when a company with an under-valued and very
'oversold' stock can report good results and a bullish forecast, and
yet its stock price continues to languish near a multi-year low. RIO
actually made a marginal new low for the year on Friday 11th
October.
We can easily justify a valuation of $3.50/share for RIO based on
this year's likely production performance. That's why $3.50 remains
our price target. However, due to the weak overall market for gold
stocks it is going to take longer than originally expected to reach
this target.
 Sabina
Gold and Silver (TSX: SBB). Shares: 194M issued, 209M fully diluted. Recent
price: C$0.84 Sabina
Gold and Silver (TSX: SBB). Shares: 194M issued, 209M fully diluted. Recent
price: C$0.84
SBB has recently been quiet on the news front (prior to last week there had been
no news since a drilling update on 22nd August) as the company focused on
completing the PFS for its Back River gold project in Nunavut (northern Canada).
The results of the PFS were issued last week.
The PFS results were disappointing. The economics indicated by the PFS are less
robust than we were expecting and nowhere near as good as the economics
indicated by the PEA completed in May of last year. Of particular note, the
May-2012 PEA showed an IRR of 25% and an NPV(5%) of $650M at a gold price of
$1250, whereas at the same gold price the PFS shows an IRR and NPV(5%) of only
12% and $179M, respectively.
The salient details and calculations for the PEA and the PFS are included in the
following table. Note that the PFS economics shown in this table assume a gold
price of $1350/oz, which is the long-term price assumption that we are
comfortable with at this time.
|
|
Sabina Gold & Silver (SBB.TO) |
Sabina Gold & Silver (SBB.TO) |
|
Project Name |
Back River |
Back River |
|
Location |
Nunavut, Canada |
Nunavut, Canada |
|
Engineering Study / Date |
PEA / May-2012 |
PFS / Oct-2013 |
|
Planned Mine Type |
Open Pit + Underground |
Open Pit + Underground |
|
M&I Resource (oz) |
4.2M |
4.6M |
|
Avg Resource Grade |
5.56 g/t |
6 g/t |
|
P&P Reserve (oz) |
0 |
2.7M |
|
Metallurgical Recovery |
About 90% |
88% |
|
Strip Ratio |
7.7:1 |
10:1 |
|
Avg Annual Production (oz) |
300K |
287K |
|
Cash Cost (per oz) |
$542 |
$685 |
|
All-In Cost (per oz) |
Not reported |
Not reported |
|
Mine Life |
12.3 years |
8.4 years |
|
Initial Capital Cost ($M) |
450 |
605 |
|
Assumed Gold Price (US$) |
1250 |
1350 |
|
NPV ($M) |
650 |
290 |
|
IRR |
25.0% |
16.5% |
|
Capital Payback Period |
|
3.3 years |
|
Project Ownership Percent |
100% |
100% |
|
NPV of Company Stake ($M) |
650 |
290 |
|
Current Stock Price (US$) |
0.84 |
0.84 |
|
Share Count (M) |
194 |
194 |
|
Current Market Cap ($M) |
163 |
163 |
|
Net Cash ($M) |
60 |
60 |
|
Current Enterprise Value ($M) |
103 |
103 |
|
EV/NPV |
16% |
36% |
|
Current Discount to NPV |
84% |
64% |
|
EV + Capital Cost (EVCC) |
553 |
708 |
|
EVCC/NPV |
0.85 |
2.44 |
There are two main reasons for the
large deterioration in project economics from the PEA to the PFS. The first
reason is the increase in initial capex from $450M to $605M. There probably
isn't much that can be done about this. The second reason is the decline in
life-of-mine production from 3.6M ounces to 2.4M ounces. It should be possible
to do something about this and greatly improve the economics shown in the next
study (the FS due in H2-2014).
The total Back River resource is around 6.4M ounces, 4.5M of which are in the
M&I category and the remainder of which are in the Inferred category. However,
the PFS did not consider any of the Inferred ounces and only considered 2.7M of
the M&I ounces. In other words, almost 60% of the project's total resource was
excluded from the PFS. The result was slightly lower average annual production
and a much shorter mine life than determined in the PEA.
It could be viewed as a plus that even though it used only 40% of the project
resource, the PFS still showed a double-digit IRR at a gold price of only
$1250/oz. This suggests that SBB's Back River project is more viable than most
other exploration-stage gold projects. In any case, the economics will look a
lot better if, by using more of the overall resource, the average annual
production can be bumped up from 287K ounces to 300K ounces and the mine life
can be expanded to 12-13 years.
We continue to like SBB as a long-term speculation. In addition to the Back
River gold project the company has more than $60M of cash and a potentially
valuable silver royalty on Glencore's Hackett River project.
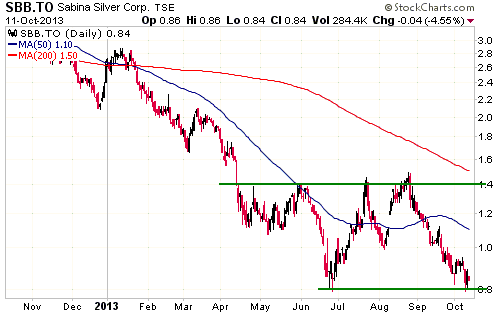
The stock has intermediate-term support near its current price and
intermediate-term resistance at C$1.40-$1.50.
 Candidates
for new buying Candidates
for new buying
From within the ranks of TSI stock selections, below is a list of the best
candidates for new buying at this time. Note that for this list of 'best buys'
to be useful we must limit it to 5 stocks (it could contain less than 5, but not
more than 5). At times like the present, when almost all of our stock selections
are trading at ultra-depressed levels, that involves not mentioning stocks that
offer excellent value and are good -- but not among the best 5 -- candidates for
new buying. Note as well that the stocks included in this list of 'best buys' do
not necessarily offer the best value. In the current market environment we are
placing more emphasis than usual on risk, meaning that we could view a more
expensive stock as a better candidate for new buying due to its lower risk.
That's why we have removed PVG from the list of 'best buys'. PVG clearly offers
better value now than it did a week ago, but last week's news has led to greater
uncertainty and could keep a lid on the stock price until after all sampling
results become available.
1) EDV.TO/EVR.AX (last Friday's closing price: C$0.54)
2) EVN.AX (last Friday's closing price: A$0.76)
3) PG.TO (last Friday's closing price: C$1.98)
4) PLG.TO (last Friday's closing
price: C$0.81)
5) RIO.TO/RIOM (last Friday's closing price: C$1.72/US$1.75)
Chart Sources
Charts appearing in today's commentary
are courtesy of:
http://stockcharts.com/index.html
http://www.decisionpoint.com/

|

