![]()
![]()
![]()
![]()
-- Weekly Market Update for the Week Commencing 15th January 2018
Big Picture
View
Here is a summary of our big picture
view of the markets. Note that our short-term views may differ from our
big picture view.
The BULL market in US Treasury Bonds that began in the early 1980s ended in mid-2016, but there will be many years of topping action in bond prices and bottoming action in bond yields before major new trends get underway. A major decline in government bond prices will unfold during the 2020s. (Last update: 11 September 2017)
The stock market, as represented by the S&P500 Index, commenced a secular BEAR market during the first quarter of 2000, where "secular bear market" is defined as a long-term downward trend in valuations (P/E ratios, etc.), gold-denominated prices and inflation-adjusted prices. This secular trend will bottom in 2020 or later. (Last update: 11 September 2017)
A cyclical BEAR market in the US Dollar began in 2016-2017. (Last update: 11 September 2017)
Gold commenced a secular bull market relative to all fiat currencies, the CRB Index, bonds and most stock market indices during 1999-2001. This secular trend will peak in 2020 or later. (Last update: 11 September 2017)
Commodities,
as represented by the CRB Index, commenced a
secular BULL market in 2001 in nominal dollar terms. The first major
upward leg in this bull market ended during the first half of 2008, but
a long-term peak won't occur until 2020 or later.
(Last
update: 11 September 2017)
Copyright
Reminder
The commentaries that appear at TSI
may not be distributed, in full or in part, without our written permission.
In particular, please note that the posting of extracts from TSI commentaries
at other web sites or providing links to TSI commentaries at other web
sites (for example, at discussion boards) without our written permission
is prohibited.
We reserve the right to immediately
terminate the subscription of any TSI subscriber who distributes the TSI
commentaries without our written permission.
True
Fundamentals Summary
[Notes:
1) The date shown next to the current True Fundamentals Model (TFM) signal is
when the most recent change occurred. 2) Charts of the Gold and Equity
TFMs are included in the "Charts and Indicators" section of the TSI web
site]
| Market | True Fundamentals Model (TFM) |
| Gold (US$ Price) | Bearish (12 Jan 2018) |
| US Equity (SPX) | Neutral (12 Jan 2018) |
| Currency (Dollar Index) | Bullish (15 Dec 2017) |
| Commodities (GNX) | Bullish (29 Dec 2017) |
Last week's posts at the TSI Blog
Monetary
Policy Madness?
A reality check regarding China purchases of US debt
Summary of current
thinking/positioning
1) Expecting that gold will test
its 2016 high of US$1377 during the first half of 2018 (possibly as soon
as next month).
2) Expecting a tradable US stock-market correction
to begin soon and planning to add a bearish position in the form of QID
and/or QQQ puts to the TSI List after a downward reversal in the market.
3) Thinking that industrial commodities such as oil and copper will
make short-term price highs during the first two months of 2018.
4)
Thinking that the Dollar Index (DX) has resumed its longer-term downward
trend and that there is a risk of downward acceleration over the coming
three weeks. At the same time, recognising that currency-market trends are
already stretched on a short-term basis and at risk of sharp reversals.
5) Thinking that the T-Bond has almost completed an intermediate-term
topping pattern within the context of a long-term topping pattern.
6) Holding a cash reserve of about 25% and looking for opportunities to
boost this reserve to 30%-35%.
Commodities
EV Metals
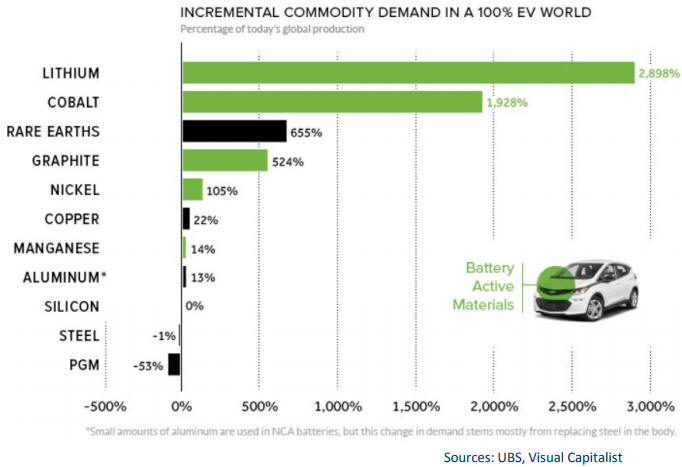
We found the following chart in a presentation by Alkane Resources
(ALK.AX). It shows estimates of the percentage increase in production of
various commodities that would be required if all vehicles were electric.
There are good reasons to expect that all new motor vehicles will be
electric by the middle of the next decade, so in this respect the chart
doesn't assume something outlandish. The estimates are unrealistic,
though, firstly because battery technology* will change dramatically over
the next several years and secondly because it's likely that the
intersection of EV advancement, self-driving technology and ride sharing**
will result in there being a lot less cars on the road. The details are
inestimable at this time, but the chart is still interesting and useful
because it provides a very rough idea of the scale of the production
increases that may be needed to satisfy future demand.
It will not
be possible to get production increases even remotely as large as those
that could be required for lithium, cobalt and the REEs (rare earth
elements) without the incentive of much higher prices. That's why there's
a good chance that the prices of these metals will remain in or enter
powerful upward trends over the next few years.
*To get an idea of what may be possible within the next
several years, watch the short interview linked
HERE. Apparently, the technology already exists to develop a
high-performance EV that can go for 700 miles on a 1 minute charge.
**It's likely that major car manufacturers will be partnering
with companies such as Uber, Google and Amazon to make this happen. An
example is the
new strategy recently announced by Toyota.
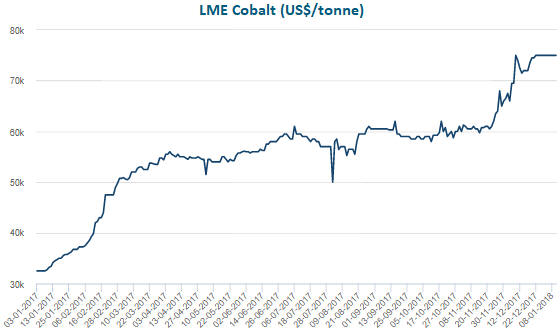
Getting
exposure to cobalt
The following chart shows that the
price of cobalt has more than doubled over the past 12 months to
US$75,000/tonne (US$34/pound). We normally wouldn't be interested in
purchasing exposure to a commodity after it has just doubled within a
year, but, due to the EV trend and the fact that cobalt supply is largely
price-insensitive (thanks to almost all cobalt supply being a byproduct of
copper and nickel mines), it's likely that a much higher price will be
attained within the next two years.
Investors can participate in the cobalt bull market without taking
exploration or country risk (almost all of the world's high-margin cobalt
deposits are in the DRC) by purchasing the shares of Cobalt 27 Capital
Corp. (TSXV: KBLT). KBLT currently owns 2,983 tonnes of physical cobalt
stored in LME warehouses and some royalties on early-stage cobalt
projects. It also plans to do cobalt streaming deals at mines where the
cobalt byproduct is small relative to the mine's total revenue.
KBLT has only existed for about 7 months. It has 34M shares outstanding
and ended Friday's session at C$12.45/share.
Based solely on its cash and physical cobalt, that is, assigning no
value to its royalties, we estimate that KBLT's current net asset value
(NAV) is about C$9.00/share. This means that KBLT is trading at about a
38% premium to NAV.
Taking into account the paucity of choices when
it comes to cobalt-focused investments and KBLT's plan to do streaming
deals, this is not an unreasonable premium. It could therefore make sense
to take an initial position near the current price, although we are hoping
that a better buying opportunity will arrive within the next couple of
months.
A much better buying opportunity is not likely, because a
stock such as this usually will trade at a significant premium to NAV and
there probably won't be a large decline in the cobalt price. Consequently,
we think that the current NAV defines the downside risk.
KBLT will
be added to the TSI Stocks List if it trades at C$11.00.
2018 Commodity Forecast
Our 2017 commodity forecast was
for a Q1-2017 top, an important bottom around mid-year and general
commodity-price strength during the second half of the year. The following
chart shows that this turned out to be exactly right, although some of our
reasoning was wrong.

So, what's on the cards for 2018?
To use a cliche, 2018 will be
a year of two halves for the commodity markets and many other markets. To
begin with, here are some of our commodity-related expectations for the
first half.
If we had written this forecast five weeks ago we would
have stated that the basket of commodity prices that constitutes the GSCI
Spot Commodity Index (GNX) was set to trend upward during the first half
of 2018. That's still our prediction, but due to the intervening price
action there's now a higher risk of it being wrong.
Risk has
increased due to the recent sharp advances in the prices of some
commodities, most notably oil and copper. In particular, the approximately
$9 rise in the price of oil (West Texas Intermediate Crude) from around
$56/barrel in early-December to a high last week of almost $65 has
substantially reduced the intermediate-term upside potential of what is
still the world's most important commodity.
Oil and some metals,
including copper, now look set to make multi-month price highs within the
first two months of 2018.
In oil's case, counter-balancing the
extent to which price and speculative sentiment are stretched into
'overbought' territory is the fact that the fundamental backdrop remains
bullish. As long as the supply-demand situation in the physical market
remains bullish, as evidenced by significant backwardation in the futures
market, it will be reasonable to assume that nothing more bearish than a
run-of-the-mill 1-2 month correction is in store. We therefore expect that
oil will exceed its Q1 price high during Q2.
In copper's case the
fundamental backdrop is now neutral at best. This may mean that whatever
high is made by the copper price during the first two months of the year
will be the high for the first half of the year.
If the first half
pans out roughly as expected then the second half should contain a lot
more downside volatility. In particular, we expect that a substantial
decline in the broad stock market during the second half will lead to
pronounced weakness in the prices of industrial commodities as the
dominant concern temporarily shifts from "inflation" to "deflation".
In the above discussion we singled out oil and copper, because these
are two of the small number of commodities that we follow closely. For
most commodities we have no opinion regarding likely price performance in
2018. For example, we have no idea what will happen over the year ahead to
the prices of wheat, corn, cattle, hogs, cotton, sugar, lumber and coffee.
However, here are some additional brief thoughts on what we expect from
specific commodity markets:
We think that uranium made a long-term
price bottom near $18/pound in late-2016, but that a new bull market will
not begin in the foreseeable future. Uranium-mining stocks should,
however, continue to be good for the occasional short-term trade.
Due to a physical supply-demand situation that remains very supportive, we
think that zinc's bull market has a long way to go.
When platinum
began trading at a discount to gold in 2015 we thought it was a temporary
state of affairs, but we now view it as a more-or-less permanent shift.
Rather than spikes below 1 in the platinum/gold ratio signaling that
platinum offers excellent value relative to gold it may now be the case
that spikes above 1 in this ratio signal that platinum is expensive
relative to gold. Long-term fundamental changes support this conclusion,
with gold benefiting from the increasingly manipulative/counter-productive
efforts of central banks and platinum being hurt by the trend towards an
all-EV world. That being said, we think that there will be an opportunity
to sell platinum in the $1200s (more than 20% above the current price)
during the first half of 2018.
We guess that natural gas will trade
above US$4.00 within the first half of 2018.
2018 T-Bond
Forecast
Here's how we summarised our
annual T-Bond forecast at this time last year:
"We expect that
it will be another losing year for the T-Bond due primarily to rising fear
of inflation during the second half of the year, but that a major T-Bond
decline won't happen. Preventing a major decline will be price-support
from central banks and periodic flights to safety, with the flights to
safety being caused by stock market volatility in the US and political
drama in Europe.
The current price for the T-Bond is 151. We expect
the price to trade near 140 before year-end, but not below 130. This
expectation is based on the strong tendency for intermediate-term declines
in the T-Bond to bottom at or slightly below the 84-month moving
average...".
This forecast proved to be too bearish. 2017
turned out to be a flat year for the T-Bond as what we interpret as a
long-term topping pattern continued to develop. The long-term topping
pattern is evident on the following monthly chart.
The above chart shows that the T-Bond has major support at 146 defined
by its lows of the past three years and its 84-month MA. A monthly close
below this support would confirm that the multi-decade bond bull market
had ended.
We expect that the aforementioned major support will
hold if tested during the first quarter but will be breached during the
second quarter in response to rising fear of "inflation".
In the
second half of the year we expect to encounter substantial 2-way
bond-market volatility, with a strong 2-3 month rally at some point in
reaction to falling equity and commodity prices.
Overall, we are
anticipating a down year for the T-Bond (an up year for long-term interest
rates), but not a large decline. We expect that major weakness in 'risk
free' government bonds will be one of the next decade's big stories.
The Stock Market
The first of the following daily
charts shows that the nominal (US$-denominated) S&P500 Index (SPX) was in
a consistent upward trend throughout 2017 and accelerated upward during
the first two weeks of 2018. Referring to the bottom section of the chart,
notice that the upward acceleration has pushed the SPX's daily RSI(14) to
a very high level. It is actually the highest level achieved by this
momentum indicator in decades, suggesting that on a short-term basis the
SPX is as 'overbought' as it ever gets. What does this mean?
It
probably means that the SPX is close to a short-term top, but not a
long-term or even an intermediate-term top. This is because longer-term
SPX tops rarely -- we are tempted to say never, but there could be
exceptions we aren't aware of -- coincide with short-term RSI extremes.
Instead, they tend to be associated with waning short-term momentum and/or
a bearish momentum divergence (a higher-high for the price in parallel
with a lower-high for momentum).
Also worth mentioning is that the
bearish divergence of market internals that was evident for about two
months beginning in late-October has disappeared. That is, the price surge
of the past two weeks was broad-based.
The second of the following
charts shows the performance of the SPX in euro terms (SPX/euro).
The difference between the two charts is stark. Whereas the nominal SPX
was in a strong and consistent upward trend over the past 12 months,
SPX/euro is no higher today than it was in early-March of last year.
The implication is that what we've witnessed since early-March of 2017
is primarily a reaction to US$ weakness. This is the case for most of the
major asset markets, not just the US stock market.
We are expecting a significant (>5%) short-term correction to occur
during the first quarter of this year, but the correction obviously hasn't
begun yet.
This week's
significant US economic events
[Notes:
1) The most important events
(to the markets) are shown
in bold. 2) A list of global economic events can be found
HERE]
| Date | Description |
| Monday Jan-15 | US markets closed for public holiday |
| Tuesday Jan-16 | No important events scheduled |
| Wednesday Jan-17 |
Industrial Production Housing Market Index TIC Report Fed's Beige Book |
| Thursday Jan-18 |
Housing Starts Philadelphia Fed Business Outlook Survey |
| Friday Jan-19 | Consumer Sentiment |
Gold and the Dollar
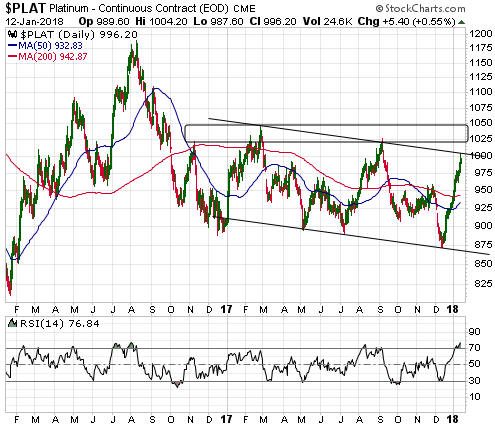
Platinum
Platinum has channel resistance and
'round number' resistance at $1000. Above that there is important lateral
resistance at $1025-$1050.
It is currently short-term 'overbought'
and testing the lower of the aforementioned resistance areas. We expect a
multi-week price peak at around this level or following a near-term spike
to $1025-$1050.
Gold Stocks
Current
Market Situation
A week ago we wrote to expect a 1-2 week
correction in the gold-mining sector that would take the HUI down to the
vicinity of its 50-day MA. Then, in last week's Interim Update we wrote
that a correction may have already come and gone, with Tuesday's touch of
lateral support at 191 marking the end. However, at that time there was
still a chance of some additional corrective activity incorporating a test
of the 50-day MA.
Due to Friday's rise to a new 2-month high we now
know that a minor correction did, indeed, end last Tuesday.
With
regard to the coming week we have no expectations other than we don't
expect the HUI to trade below last week's low. With regard to the next
month or so, a test of resistance at 220 is likely. The 220 level acted as
a ceiling throughout last year, so how the HUI performs when it reaches
220 will be informative.
The First Majestic Silver takeover of
Primero Mining
Primero Mining (P.TO) encountered major
problems at its flagship San Dimas gold-silver mine (Mexico) over the past
couple of years, leading to desperate sales of some non-core assets and a
near-death experience over the past 6 months. However, the company has
been rescued via an agreed takeover bid by First Majestic (FR.TO). The
announcement of this bid on Friday resulted in a 125% increase in the
price of P shares, although the following chart makes it clear that only
recent buyers of the shares could have profited.
Given that San Dimas had gold-equivalent production of about 85K
ounces over the past 12 months and that P's post-bid market cap is only
C$52M, on the surface it seems that FR is getting the San Dimas mine at a
bargain price. However, taking into account P's net debt and the amount
that FR will pay to Wheaton Precious Metals to restructure the San Dimas
streaming deal, the total cost of the purchase will be about $320M. This
seems like a very high price to pay for a troubled 85K-oz/yr mine that
will be subject to a streaming arrangement that limits the gold sale price
to $600/oz on 25% of production.
Prior to this deal FR was a
leveraged play on silver that was only good for the occasional short-term
or intermediate-term trade. That's still the case, although the risk is
now higher.
The Currency Market
Last week,
the intensity of speculative betting on a rising euro continued to ramp
up. The result was a large rise in the total speculative net-long position
in euro futures to another new all-time high and a new high for the open
interest in euro futures. Refer to the following long-term weekly chart
for additional details.
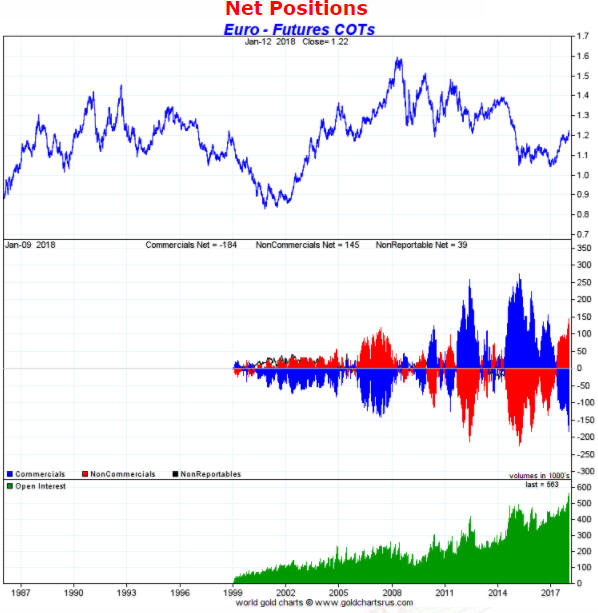
The rapidly-increasing speculative enthusiasm for the euro and the
rising price are self-reinforcing, in that trend-following speculators are
ramping up their bullish exposure in reaction to higher prices and the
speculative buying is fueling the price rise. We know how this ends, but
don't know when.
The speculator-driven rise in the euro to a new
multi-year high broke the Dollar Index (DX) below support defined by its
September-2017 low (refer to the chart below). Unless this breakdown is
painted as false by a reversal within the next few days then a 2-3 week
steep additional decline in the DX may be in store.
We don't have
an opinion on whether it's more likely that last week's breakout will be
quickly reversed or lead to significant additional movement in the
direction of the breakout (down for the DX, up for the euro). However, it
makes sense to assume that the breakout is genuine/sustainable until
proved otherwise.
Updates
on Stock Selections
Notes: 1) To review the complete list of current TSI stock selections, logon at
http://www.speculative-investor.com/new/market_logon.asp
and then click on "Stock Selections" in the menu. When at the Stock
Selections page, click on a stock's symbol to bring-up an archive of
our comments on the stock in question. 2) The Small Stock Watch List is
located at http://www.speculative-investor.com/new/smallstockwatch.html
![]() Company
news/developments for the week ending Friday 12th January 2018:
Company
news/developments for the week ending Friday 12th January 2018:
[Note: AISC = All-In Sustaining Cost, FS = Feasibility Study, FY =
Financial Year, IRR = Internal Rate of Return, ISR = In-Situ Recovery,
MD&A = Management Discussion and Analysis, M&I = Measured and Indicated,
NAV = Net Asset Value, NPV(X%) = Net Present Value using a discount rate
of X%, P&P = Proven and Probable, PEA = Preliminary Economic Assessment,
PFS = Pre-Feasibility Study]
*Alio Gold (ALO)
reported December-quarter gold production of 16K ounces from its San
Francisco mine in Mexico. This was a poor result, but it was in line with
the guidance provided by the company about two months ago.
We
expect that ALO will have positive news-flow during the first half of this
year. In particular, the company should be able to report a much improved
production performance from the San Francisco mine in each of the first
two quarters and good news in the form of the FS for the Ana Paula project
in the second quarter.
Completion of the Ana Paula FS could turn
ALO into a takeover target.
*Premier Gold (PG.TO)
announced positive news that the stock market ignored. The news is that PG
has done a deal with Barrick Gold (ABX) that entails the major gold
producer spending US$22.5M by June-2022 to earn a 60% interest in the
exploration portion of PG's McCoy-Cove gold project in Nevada. PG will
retain 100% ownership of the deposits hosting the project's existing
high-grade resource.
This deal suggests that ABX's management sees
a lot more value in McCoy-Cove than the stock market is presently giving
PG credit for.
The first look at the economics of McCoy-Cove will
come via a PEA that was originally scheduled to be complete by the end of
last year and is now expected by the end of this year's first quarter.
After that, PG will extract a bulk sample of up to 120K tonnes from its
100%-owned portion of the project that will be processed by ABX for an
agreed price.
*Ramelius Resources (RMS.AX)
reported an above-plan production result for the December quarter. The
company produced a record-high 58K ounces during the quarter from its
operations in Western Australia, or about 3K ounces more than the top end
of its guidance range. The newly-acquired Edna May mine contributed 21K
ounces, which was roughly as expected, while the Mt Magnet operations
delivered better-than-expected output.
Production costs and most
other financial details won't be known until the half-yearly report is
published in February, but the press release issued last week noted that
the company had A$61.8M cash on hand after paying $38M for Edna May and
spending $13.2M on capital development during the quarter.
This is
good news. It confirms that RMS has substantial valuation-related upside
potential.
We think that RMS is worth at least A$0.80/share at the
current gold price.
*US Gold (USAU)
announced the results of an updated PEA for its Copper King gold-copper
project in Wyoming. Here are the salient numbers:
- Average
annual production of 41K ounces of gold plus 11M pounds of copper over a
17-year mine life
- Pre-production capex of US$114M
- M&I resource comprising 966K ounces of gold plus 235M pounds of copper
- After tax NPV(5%) and IRR of US$162M and 29.7%, resp., at a
gold price of $1275/oz and a copper price of $2.80/pound
The above
numbers suggest that the Copper King project would be economically robust
at today's metal prices. Copper King underpins USAU's market cap, but it
isn't the main source of the stock's upside potential.
The bulk of
USAU's reward potential is associated with the Keystone project in Nevada.
This project is at a very early stage of exploration, with only scout
drilling having been done to date. The results of the first few scout
holes are expected during the second half of this month.
USAU has
rebounded strongly from its November low near US$1.00. This is not
surprising, because as we mentioned at the time the plunge to the low-US$1
area on no news was another in a long line of examples of the stock market
being wrong.
Despite the strong rebound, the stock is still not
expensive. With only 14.3M shares outstanding the market cap is about
US$40M, which is more than fully justified by the Copper King project.
This suggests that buyers near the current price aren't paying anything
for the upside potential associated with Keystone.
![]() List
of candidates for new buying
List
of candidates for new buying
From within the ranks of TSI
stock selections the best candidates for new buying at this time, listed
in alphabetical order, are:
1) ALK.AX (last Friday's closing price:
A$0.335)
2) ALO (last Friday's closing price: US$3.64)
3)
EGD.V (last Friday's closing price: C$0.36)
4) NSU (last Friday's
closing price: US$2.39)
5) PG.TO (last Friday's closing price:
C$3.53)
The above list is limited to five stocks. It will sometimes
contain less than five, but it will never contain more than five
regardless of how many stocks are attractively priced for new buying.
Chart Sources
Charts appearing in today's commentary
are courtesy of:
http://stockcharts.com/index.html
http://www.goldchartsrus.com/
http://www.lme.com/