|
-- Weekly Market Update for the Week Commencing 15th February 2010
Big Picture
View
Here is a summary of our big picture
view of the markets. Note that our short-term views may differ from our
big picture view.
In nominal dollar terms, the BULL market in US Treasury Bonds
that began in the early 1980s will end by mid-2010. In real (gold)
terms, bonds commenced a secular BEAR market in 2001 that will continue
until 2014-2020. (Last
update: 09 February 2009)
The stock market, as represented by the S&P500 Index, commenced
a secular BEAR market during the first quarter of 2000, where "secular
bear market" is defined as a long-term downward trend in valuations
(P/E ratios, etc.) and gold-denominated prices. This secular trend will bottom sometime between 2014 and 2020. (Last update: 22 October 2007)
A secular BEAR market in the Dollar
began during the final quarter of 2000 and ended in July of 2008. This
secular bear market will be followed by a multi-year period of range
trading. (Last
update: 09 February 2009)
Gold commenced a
secular bull market relative to all fiat currencies, the CRB Index,
bonds and most stock market indices during 1999-2001. This secular trend will peak sometime between 2014 and 2020. (Last update: 22 October 2007)
Commodities,
as represented by the Continuous Commodity Index (CCI), commenced a
secular BULL market in 2001 in nominal dollar terms. The first major
upward leg in this bull market ended during the first half of 2008, but
a long-term peak won't occur until 2014-2020. In real (gold) terms,
commodities commenced a secular BEAR market in 2001 that will continue
until 2014-2020. (Last
update: 09 February 2009)
Copyright
Reminder
The commentaries that appear at TSI
may not be distributed, in full or in part, without our written permission.
In particular, please note that the posting of extracts from TSI commentaries
at other web sites or providing links to TSI commentaries at other web
sites (for example, at discussion boards) without our written permission
is prohibited.
We reserve the right to immediately
terminate the subscription of any TSI subscriber who distributes the TSI
commentaries without our written permission.
Outlook Summary
Market
|
Short-Term
(0-3 month)
|
Intermediate-Term
(3-12 month)
|
Long-Term
(1-5 Year)
|
Gold
|
Bullish
(01-Feb-10)
|
Bullish
(12-May-08)
|
Bullish
|
US$ (Dollar Index)
|
Neutral
(20-Jan-10)
| Bullish
(02-Nov-09)
|
Neutral
(19-Sep-07)
|
Bonds (US T-Bond)
|
Neutral
(18-Jan-10)
|
Bearish
(14-Dec-09)
|
Bearish
|
Stock Market (S&P500)
|
Neutral
(07-Dec-09)
|
Bearish
(11-May-09)
|
Bearish
|
Gold Stocks (HUI)
|
Bullish
(01-Feb-10)
|
Neutral
(16-Sep-09)
|
Bullish
|
| Oil | Neutral
(28-Oct-09)
| Neutral
(14-Oct-09)
| Bullish
|
Industrial Metals (GYX)
| Bearish
(21-Sep-09)
| Bearish
(25-May-09)
| Neutral
(11-Jan-10)
|
Notes:
1. In those cases where we have been able to identify the commentary in
which the most recent outlook change occurred we've put the date of the
commentary below the current outlook.
2. "Neutral", in the above table, means that we either don't have a
firm opinion or that we think risk and reward are roughly in balance with respect to the timeframe in question.
3. Long-term views are determined almost completely by fundamentals,
intermediate-term views by giving an approximately equal weighting to
fundmental and technical factors, and short-term views almost
completely by technicals.
Inflation Update
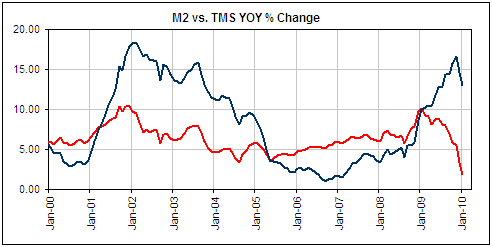
The following monthly chart
compares the year-over-year (YOY) growth rates of True Money Supply
(TMS - the blue line) and M2 (the red line). As at the end of January
the TMS yearly rate of change was down a few percent from its high, but
was still well into double digits and in the top quartile of its
10-year range. The M2 rate of change, however, was at a 10-year low. As
explained in previous commentaries, the large divergence over the past
year between these two monetary aggregates is primarily due to declines
in the NON-monetary components of M2 (the main non-monetary components
of M2 being money-market funds and time deposits).
We have always been
confident in the collective ability of the US Government and the Fed to
perpetuate the inflation of the US money supply. The only question in
our minds has been: how far will they be willing to go? The answer we
have always come up with is that they will at least go as far as they
can without causing interest rates to rocket upward. They may not go
any further than that because monetary inflation becomes
counterproductive -- from the perspective of a policymaker -- once the
point is reached where interest rates are in a steep upward trend due
to speculators anticipating the effects on the currency's purchasing
power of future money-supply growth.
Another way of stating the above is that the US -- along with almost
all other countries -- should experience inflation and nothing but
inflation until the bond market "cries uncle". The inflation could
conceivably continue beyond the point where bond prices begin to
accelerate downward, but there is very little chance of it ending
earlier than that. It won't end earlier because nobody outside of the
relatively obscure "Austrian School" perceives a big problem with
monetary inflation as long as the inflation isn't manifesting itself in
sharply higher consumer prices and interest rates. In fact, many of the
world's most influential economists believe that increasing the money
supply can give a sustainable boost to a flagging economy, so
persistent economic weakness over the years ahead will very likely
prompt a steady stream of calls for more monetary profligacy (a.k.a.
stimulus).
The Fed's "Exit Strategy"
It
is generally easy to figure out what policymakers are going to do
because they are working from 'playbooks' that describe very few plays.
Bernanke's playbook, for instance, has a comprehensive list of all the
problems that could beset the economy or the financial system, and for
all except one of these problems the recommended 'play' is "cut
interest rates and boost the money supply". For the lone exception the
recommendation is "hike interest rates and reduce the money supply".
These days there are a lot of different ways that Bernanke can make his
plays, but it always comes down to either reducing interest rates and
boosting the money supply (Play 1) or hiking interest rates and
reducing the money supply (Play 2). Having used Play 1 repeatedly since
September of 2007, gingerly at first and then with gusto beginning in
September of 2008, there is now a lot of discussion about a switch to
Play 2. Whether Play 2 is achieved via an innovative policy tool
(adjusting interest rates on bank reserves or selling securities to
money-market funds, for example) or via a more traditional approach
(using Open Market Operations to absorb excess bank reserves, for
example) is not of great import. What is of great import is the extent
to which Play 2 will actually be used.
The extent to which Play 2 gets used over the remainder of this year
will largely be determined by what happens to the stock market, the
real estate market, consumer prices and the T-Bond market. For example,
if the equity bear returns then the Fed will almost certainly avoid
Play 2 UNLESS consumer prices begin to rise rapidly and bond prices
begin to fall rapidly. Moreover, if the equity bear doesn't return of
its own accord then a Fed shift from Play 1 to Play 2 will almost
certainly bring it back, prompting an almost immediate about-face on
the Fed's part.
In summary, if there is a shift to Play 2 during 2010 it will likely be
short-lived unless there happens to be a substantial increase in
inflation fear. Therefore, the tightening of monetary policy is not
something that gold investors need to be concerned about.
The Government Debt Crisis
A government debt
crisis is in its infancy. Furthermore, it bears a remarkable similarity
at this early stage of its development to the beginnings of what was
initially called the "US subprime crisis" and eventually became known
as the "global financial crisis".
Outward signs of the "subprime crisis" initially appeared in late 2006,
and reached the front pages of the mainstream financial newspapers
during the first quarter of 2007 when Countrywide Financial and a
couple of Bear Stearns hedge funds ran into big trouble. There was a
sharp downward move in the broad stock market during Q1-2007 when these
debt-related problems bubbled to the surface, but after a short while a
belief took hold that the problems would be contained and that the
global economy would not suffer serious damage. Due to this mistaken
belief the stock market resumed its upward trend and made a series of
new multi-year highs culminating in October of 2007, at which time the
pile of evidence that the problems were not "contained" became too
large to be ignored.
The government debt crisis bubbled to the surface late last year when
Dubai was forced to go 'cap in hand' to its cash-rich neighbour (Abu
Dhabi), and became the dominant news story over the past few weeks due
to Greece's predicament. This prompted sharp downturns in equity
markets that were already acutely vulnerable due to extended price
action and overtly optimistic sentiment.
Senior government representatives and central bankers are now working
overtime to convince themselves and everyone else that the 'Greece
problem' has been contained. However, the situation is not remotely
close to being contained and there is no hope that it will be
contained. This is because Greece's debt-related predicament is
indicative of a widespread problem.
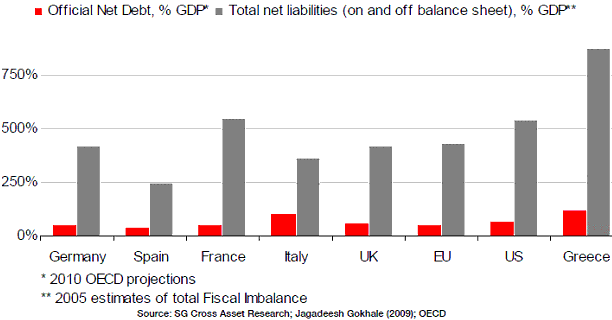
The extent of the problem is revealed by the following chart from http://www.sgresearch.com/.
The chart shows the sum of on-balance-sheet and off-balance-sheet
government debt relative to GDP for several countries, where
on-balance-sheet debt is the debt that has already been incurred and
off-balance-sheet debt is the debt that will be incurred to meet
current commitments for social security and the like. The chart's
message is that the Greek government is not alone in being technically
insolvent. The governments of the US and France, for instance, have
obligations that amount to more than 5-times their countries' GDPs,
while the governments of Germany and the UK have obligations that
amount to about 4-times their GDPs. The Spanish government's current
situation looks comparatively good, but Spain has a 20% unemployment
rate so its government debt will probably increase from here at a
relatively fast pace.
Clearly, the governments of all the countries included in the following
chart will eventually default; the only question is when. It is
therefore absurd for the markets to be calmed by news that Germany will
provide some support to Greece, because the German government is also
moving inexorably towards default.
Of the G7 countries, Japan has the most immediate problem with regard
to the size of its government debt. The ON-balance-sheet debt of the
Japanese government is now almost 2-times the country's GDP, so there's
a good chance that Japan's government will be forced to default -- one
way or another -- within the next few years. Direct default would be
intermediate-term bullish for the Yen, intermediate-term bearish for
the stock market and potentially long-term bullish for the economy,
whereas indirect default via inflation would be intermediate-term
bearish for the Yen, intermediate-term bullish for the stock market and
long-term bearish for the economy. Our guess is that Japan's default
will be indirect.
As was the case during the preceding private-sector debt crisis, the
markets could find ways to ignore the government-sector debt crisis for
many months. We are not forecasting that they will ignore it; we are
just acknowledging that they are quite capable of doing so.
T-Bond Update
We think the next big
move in the Treasury Bond market will be to the downside, but on a
short-term basis we are "neutral". We are short-term "neutral" because
fear about government debt problems in Europe could continue to support
US Treasury debt, and because the Commitments of Traders data is
bond-bullish.
The price action could best be described as non-committal. As evidenced
by the following daily chart, the March T-Bond has just pulled back to
its 200-day moving average after retracing about half of its December
decline.
The Stock
Market
There is a significant risk
that a major stock market decline has begun. This is a risk that
longer-term investors should keep in the forefronts of their minds. The
most likely short-term scenario, however, involves a correction low
having been put in place on 5th February -- when the S&P500 Index
spiked down to 1044 -- and at least some senior stock-market indices
making new 52-week highs BEFORE a major decline gets started.
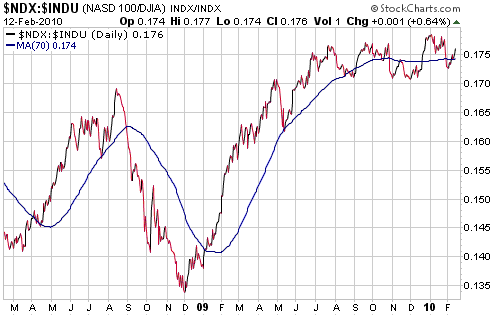
The performance of the NDX/Dow ratio is consistent with the idea that
the US stock market's recent decline will prove to be a short-term
correction rather than the first leg of a new intermediate-term
downward trend. The reason is that this ratio -- which tends to reflect
the overall market's intermediate-term trend -- appears to have turned
upward after making a higher low at the beginning of this month. Refer
to the following chart for details.
Even if a short-term
low was put in place on 5th February it is possible that the low will
be tested prior to the start of a multi-week rally.
This week's
important US economic events
| Date |
Description |
Monday Feb 15
| US markets closed for Presidents Day
| | Tuesday Feb 16 | Treasury International Capital (TIC)
Housing Market Index
| | Wednesday Feb 17
| Housing Starts
Import and Export Prices
Industrial Production
FOMC Minutes
Treasury Budget
| | Thursday Feb 18
| PPI
Leading Economic Indicators
| | Friday Feb 19
| CPI
Expiration of February Options
|
Gold and
the Dollar
Gold
As illustrated by the daily chart displayed below, the April gold
futures contract touched its downward-sloping trend-line late last
week. Gold is therefore now in a similar position to where it was on
3rd February -- just prior to a $50 plunge. This doesn't mean that the
gold futures market is about to plunge to a new correction low; it
means that the US$ gold price hasn't yet rebounded far enough to signal
that a short-term bottom is in place.
As noted in last week's Interim Update, a daily close above $1120 would
be conclusive evidence that a short-term bottom is in place, while a
daily close above the downward-sloping trend-line drawn from the
December-2009 peak -- currently just above $1100 -- would be
preliminary evidence of a short-term bottom. If gold closes above
US$1120 at some point over the next couple of weeks then we will begin
to anticipate a test of the early-December peak, but let's wait until
it achieves such a close before getting enthused about the prospect of
significant short-term gains.
By the way, as at 9th February (the date of latest COT data) the total
speculative net-long position in COMEX gold futures was down by 94,000
contracts from its December-2009 peak. This is more than sufficient to
create a sustainable price low.

While gold is working
on forming a short-term bottom in US$ terms, in euro terms it is very
close to making a new all-time high. Also, it is not far from an
all-time high in Swiss Franc and British Pound terms. Here is a chart
of the euro-denominated gold price.
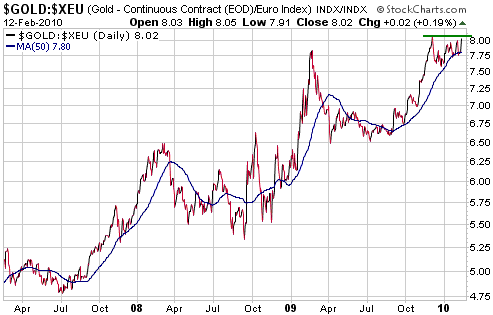
The above chart shows
that the gold correction of the past 2.5 months has been trivial when
performance is measured in euro terms. All we've seen, to date, is a
routine pullback to the 50-day moving average. Consequently, it will
take only a small amount of additional strength to push gold/euro to a
new high. At the same time, it will take a decline of only 5% to push
gold/euro below its late-December pullback low and transform the
correction into something more ominous. This means that for the time
being the euro-denominated gold price will be a better indicator of
gold's situation than the US$-denominated gold price.
Our view is that the next major advance in the gold market will just as likely be driven by euro negatives as US$ negatives.
Gold Stocks
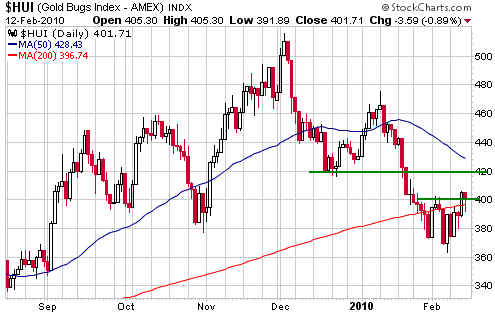
Last week's gold-sector action was moderately bullish in that the HUI
was able to end the week above resistance at 400. More important
resistance lies at 420.
A daily close above 420 would leave little doubt that a short-term
bottom was put in place via the 5th February intra-day spike down to
363. It would also increase the probability of our 440-470 target being
reached within the coming few weeks, but it would not indicate that the
intermediate-term correction was over. We expect that the correction
will continue until at least May.
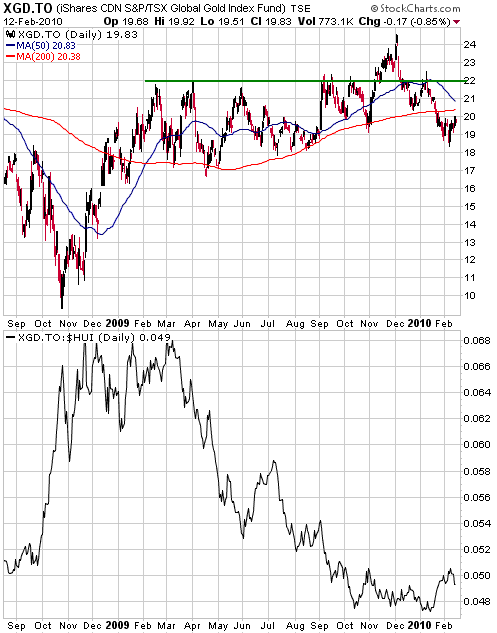
XGD is a
C$-denominated proxy for the gold sector. In other words, XGD's
performance reflects the performance of the gold sector in Canadian
Dollar terms.
The upper section of the following chart shows that XGD broke above
major resistance last November, but peaked only a few weeks later. Like
the HUI it potentially reached a short-term bottom earlier this month,
but also like the HUI its overall correction is probably not yet
complete.
XGD has solid support at C$17-$18, and would, we think, be a good candidate for new buying within that range.
The lower section of the following chart shows XGD's performance
relative to the HUI. Due to strength in the C$ relative to the US$, the
XGD/HUI ratio trended downward from early-March of 2009 through to
early-January of this year. And due to the US dollar's recent strength,
the XGD/HUI ratio has since bounced.
This ratio has probably bottomed on an intermediate-term basis or will do so within the next two months.
Currency Market Update
Evidence of weakness in Germany's economy and more fears about
government debt default in Europe pushed the euro to a new 8-month low
on Friday, but note that the March euro did not close below its 5th
February intra-day low. Refer to the following daily chart for details.
It is possible, therefore, that the 12th February downward spike will
prove to be a test of the preceding week's low, and that an upward
correction in the euro actually commenced on 5th February.
If an upward correction has not already begun, we think it will soon do
so. However, we don't think the euro has much upside potential at this
time. Our guess is that a rebound that begins in the near future will,
at best, take the euro back to former support (now resistance) at 1.42,
but would more likely end at around 1.40.
Update
on Stock Selections
(Note: To review the complete list of current TSI stock selections, logon at http://www.speculative-investor.com/new/market_logon.asp
and then click on "Stock Selections" in the menu. When at the Stock
Selections page, click on a stock's symbol to bring-up an archive of our comments on the stock in question)
 Endeavour Financial (TSX: EDV). Shares: 96M issued, 131M fully diluted. Recent price: C$1.83 Endeavour Financial (TSX: EDV). Shares: 96M issued, 131M fully diluted. Recent price: C$1.83
In late January EDV purchased an 810M-share (38%) stake in Crew Gold
(TSX: CRU), a company with annual gold production of around 220K ounces
from a mine in West Africa. EDV's cost per share was C$0.125.
CRU ended Friday's session at C$0.215, up C$0.07 (48%) on the day. At
Friday's closing price for CRU, EDV had an unrealised gain of about
C$73M on its recent investment. Furthermore, at Friday's closing market
prices EDV's net asset value was in excess of C$4/share (well over
double its current stock price).
The reason for Friday's surge in CRU's stock price was news that an affiliate of Severstal Resources,
one of Russia's largest mining companies, had purchased 336M CRU shares
(15.7% of the company) the day before at C$0.16/share. Severstal began
building a gold-mining division in 2007 and appears to be interested in
adding CRU to its stable of assets.
Severstal's interest in CRU could create the opportunity for EDV to
realise a large and very quick gain on its CRU stake, but even if
Severstal doesn't make a bid for all of CRU its willingness to pay
C$0.16/share for a 16% stake highlights the wisdom of EDV's earlier
purchase at C$0.125/share.
EDV is a buy near its current price.
Chart Sources
Charts appearing in today's commentary
are courtesy of:
http://stockcharts.com/index.html
http://www.futuresource.com/

|

