


-- Weekly Market Update for the Week Commencing 15th February 2016
Big Picture
View
Here is a summary of our big picture
view of the markets. Note that our short-term views may differ from our
big picture view.
The BULL market in US Treasury Bonds
that began in the early 1980s ended in early-2015, but there will be many years
of topping action in bond prices and bottoming action in bond yields before
major new trends get underway. (Last update: 29 June 2015)
The stock market, as represented by the S&P500 Index,
commenced
a secular BEAR market during the first quarter of 2000, where "secular
bear market" is defined as a long-term downward trend in valuations
(P/E ratios, etc.) and gold-denominated prices. This secular trend will bottom sometime between 2018 and 2020.
(Last update: 29 June 2015)
A secular BEAR market in the
US
Dollar
began during the final quarter of 2000 and ended in July of 2008. This
secular bear market will be followed by a multi-year period of range
trading.
(Last
update: 09 February 2009)
Gold commenced a
secular bull market relative to all fiat currencies, the CRB Index,
bonds and most stock market indices during 1999-2001.
This secular trend will peak sometime between 2018 and 2020.
(Last update: 29 June 2015)
Commodities,
as represented by the CRB Index, commenced a
secular BULL market in 2001 in nominal dollar terms. The first major
upward leg in this bull market ended during the first half of 2008, but
a long-term peak won't occur until 2018-2020.
(Last
update: 29 June 2015)
Copyright
Reminder
The commentaries that appear at TSI
may not be distributed, in full or in part, without our written permission.
In particular, please note that the posting of extracts from TSI commentaries
at other web sites or providing links to TSI commentaries at other web
sites (for example, at discussion boards) without our written permission
is prohibited.
We reserve the right to immediately
terminate the subscription of any TSI subscriber who distributes the TSI
commentaries without our written permission.
Outlook Summary
Market
|
Short-Term
(1-3 month)
|
Intermediate-Term
(6-18 month)
|
Long-Term
(2-5 Year)
|
|
Gold
|
N/A |
Bullish
(26-Mar-12) |
Bullish
|
|
US$ (Dollar Index)
|
N/A |
Neutral
(22-Jun-15) |
Neutral
(19-Sep-07) |
|
US Treasury Bonds (TLT)
|
N/A |
Bearish
(19-Oct-15)
|
Bearish |
|
Stock Market
(DJW)
|
N/A |
Bearish
(30-Dec-15) |
Bearish
|
|
Gold Stocks
(HUI)
|
N/A |
Bullish
(23-Jun-10) |
Bullish
|
|
Oil |
N/A |
Neutral
(26-Oct-15) |
Bullish
|
|
Industrial Metals
(GYX)
|
N/A |
Neutral
(09-Nov-15) |
Bullish
(28-Apr-14) |
Notes:
1. Our short-term expectations are discussed in the commentaries, but except in
special circumstances we won't attempt to assign a "bullish", "bearish" or
"neutral" label to these expectations.
2. The date shown below the current outlook is when the most recent outlook change occurred.
3. "Neutral" means that we think risk and reward are roughly in balance with respect to the timeframe in question.
4. Long-term views are determined almost completely by fundamentals and intermediate-term views
are determined by a combination of fundamentals, sentiment and technicals.
Last week's posts at the TSI Blog
The US government debt held by the Fed is interest free
Gold versus silver during bull markets
Anticipating a copper
turnaround
At major price bottoms, gold
leads and copper follows. With gold having provided us with evidence that
something more than a short-term rebound is in the works, it's time to give more
thought to the possibility that a sustained up-turn in the copper market is not
far away.
While gold tends to lead at major bottoms, the lead time is variable. For
example, in 2001 the bottom for gold preceded the bottom for copper by about 7
months, whereas in 2008 the bottom for gold preceded the bottom for copper by
1-2 months. However, if we are right to assume that gold has bottomed then the
next upside breakout in the copper price should signal the start of an
intermediate-term rally.
With reference to the following chart, a daily close above $2.15 would take the
copper price above lateral resistance and the top of a well-defined 9-month
channel. As long as the gold market maintains its longer-term bullish posture we
would therefore take a daily close above $2.15 as evidence of a sustainable
turnaround in the copper market.
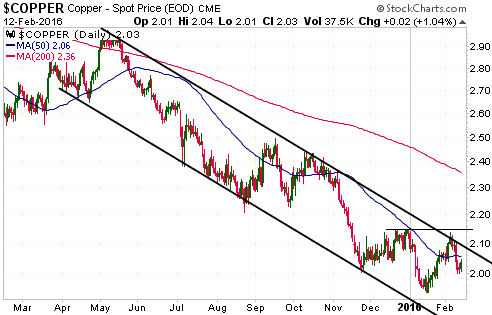
Caution is still warranted, because copper's current chart position looks
similar to its position in late-October of last year -- just prior to the start
of a 3-week plunge from $2.30 to $2.00. That being said, copper's COT situation
is bullish and it was interesting that the copper price managed to hold above
$2.00 during last week's financial-market 'flight from risk'. We are therefore
prepared to take a tentative step back into this market via the new TSI stock
selection discussed later in today's report.
Can a US recession
occur without an inverted yield curve?
One of the bullish arguments on
the US economy and stock market involves pointing out that a) the yield curve
hasn't yet signaled a recession, and b) the historical record indicates that
recessions don't happen until after the yield curve gives a warning signal. This
line of argument arrives at the right conclusion for the wrong reasons.
The bullish argument being made is that every recession of the past umpteen
decades has been preceded by an inverted yield curve (the 10-year T-Note yield
dropping below the 2-year T-Note yield). The following chart shows that while
the yield curve has 'flattened' to a significant degree it is still a long way
from becoming inverted (the yield spread is still well above zero), which
supposedly implies that the US economy is not yet close to entering a recession.
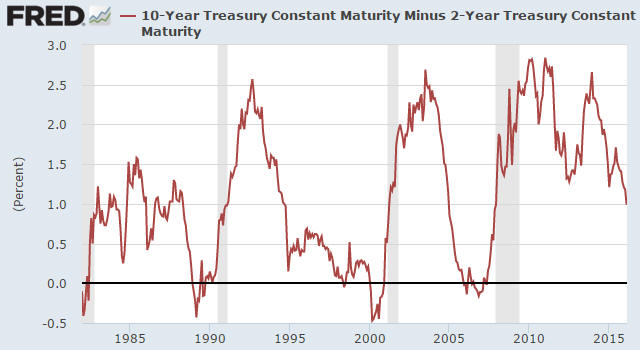
The problem with the argument outlined above is that it doesn't take into
account the unprecedented monetary backdrop. In particular, it doesn't take into
account that as long as the Fed keeps a giant foot on short-term interest rates
it will be virtually impossible for the yield curve to invert, but the Fed
obviously can't hold off a recession indefinitely by taking actions that
undermine the economy.
The logic underpinning the bullish argument is therefore wrong, but it's still
correct to say that the yield curve hasn't yet signaled a recession. The reason
is that an inversion of the yield curve has NEVER been a recession signal; the
genuine recession signal has always been the reversal in the curve from
'flattening' to 'steepening' after it reaches an extreme. It just so happens
that under more normal monetary conditions, the reversal doesn't occur until
after the yield curve becomes inverted.
This time around the reversal will almost certainly happen well before the yield
curve becomes inverted, but it hasn't happened yet.
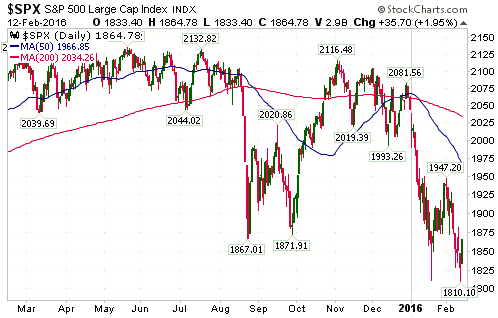
The Stock Market
The US
The US stock market rebounded quite strongly on Friday, but not strongly enough
to avoid a weekly close below the August-2015 low. From our perspective, this
eliminates the small amount of remaining doubt that a bear market is in
progress.
At the same time, the fact that the rebound from last Thursday's low began from
slightly below the 20th January low opens up the possibility that a successful
test of the January low has just taken place and that a multi-week 'corrective'
rally has begun. If this is the case, that is, if a multi-week price bottom was
put in place last Thursday, then there should be significant follow-through to
the upside over the coming few trading days.
This week's
significant US economic events
[Notes:
1) The most important events
(to the markets) are shown
in bold. 2) A list of global economic events can be found
HERE]
| Date |
Description |
| Monday
Feb 15 |
US and Canadian markets
closed |
| Tuesday
Feb 16 |
Empire State Mfg Survey
Housing Market Index
TIC Report |
| Wednesday
Feb 17 |
Housing Starts
PPI
Industrial Production
FOMC Minutes |
| Thursday
Feb 18 |
Philadelphia Fed Business
Outlook Survey
Leading Economic Indicators |
| Friday
Feb 19 |
CPI |
Gold and the Dollar
Gold
Gold and Confidence
A point we've made many times in TSI commentaries over the years is that the
major trends in gold's relative value have nothing to do with what most people
think of as "inflation" (a rising CPI). They are, instead, driven by shifts in
how the financial establishment (the central bank plus the commercial banks) is
perceived and by shifts in the perception of economic growth prospects. In more
general terms, they are driven by shifts in confidence. There are times when a
substantial decline in confidence is related to rising inflation expectations,
but in developed economies there are more times when it isn't. And even when it
is, it's not really the decline or the expected decline in the purchasing power
of money that results in a greater desire to own gold; it's the belief* that
'the authorities' (the stewards of the monetary system) are losing control.
The happenings of the past two months constitute an excellent example. Inflation
expectations were low when gold began to turn upward in December and if anything
are even lower now, but over the past few weeks we had a very fast rally in the
real gold price. It should be clear to any knowledgeable observer that the rally
had absolutely nothing to do with fear of "CPI inflation". Rather, there is
little doubt that it was driven by the combination of fear that the
economically-destructive insanity known as Negative Interest-Rate Policy (NIRP)
will spread to the US and fear of banking collapse in Europe.
Everything that the world's most important central banks are doing is based on
logical conclusions drawn from false premises. The false premise upon which
interest-rate suppression is based is that economic growth is caused by
borrowing and spending. The reality is that saving is the foundation of
sustainable economic growth. By pursuing policies that punish saving and reward
borrowing, central banks set the scene for slower economic progress.
Progress-hindering monetary policy is not something new. It has been the order
of the day for a very long time, but it has never before been taken to such
extremes. Moreover, senior central bankers are making it crystal clear that they
are not close to being done -- that they are ready and willing to continue along
the current path if the relentless beatings fail to lift morale -- even though
it is becoming more obvious by the day that the unconventional monetary policies
of the past several years have hurt far more than helped.
The upshot is that today's central bankers are completely stupid, where stupid
is defined as having an unwitting tendency towards self destruction*.
Unfortunately, due to their immense power these men and women are taking entire
economies along for the ride. The gradual dawning that this is happening is why
gold is becoming more popular.
*Central banks and governments never had genuine control,
but there has been widespread BELIEF over the past several years in the
abilities of central banks to create stronger economies.
**The Doug Casey definition.
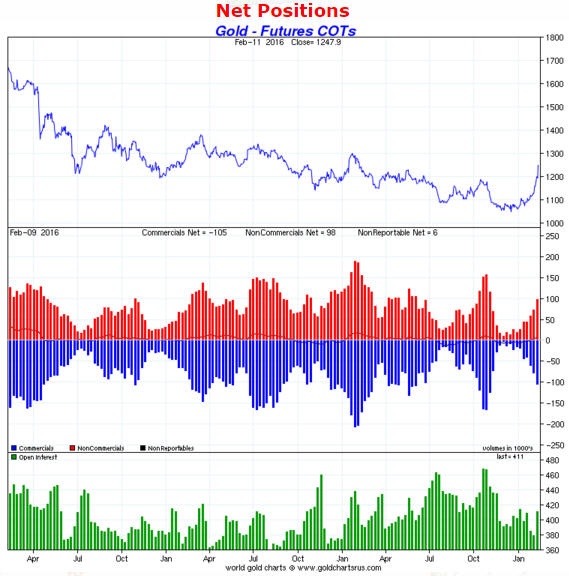
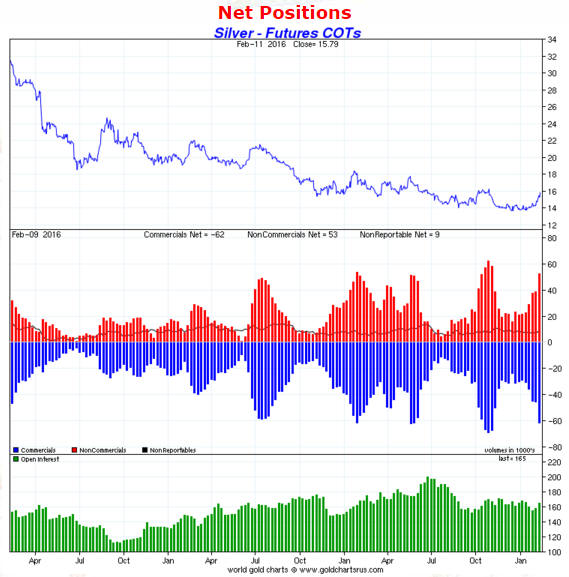
Gold and Silver COTs
The following COT charts are compliments of
www.sharelynx.com.
There was a significant increase in the speculative net-long position in gold
futures during the 5-day period ending 9th February (the date of the latest COT
information), but the increase was not large relative to the price gain. This
tells us that the rise in the gold price to the high-$1100s was driven as much
by the physical market as by the futures market. We'll have to wait until the
end of this week to find out if the subsequent rise to the mid-$1200s was also
supported by the physical market.
As at 9th February gold's COT situation was no longer bullish, but it hadn't yet
turned bearish.
It's a different story in the silver market. As illustrated by the following
chart, at 9th February the speculative net-long position in silver futures had
almost reached the level that typically occurred near short-term price tops over
the past two years.
That is, silver's COT situation is now bearish.
A predictable hike in the margins on gold futures
A margin increase on COMEX gold futures was
announced last Friday.
When the margins on gold futures are increased following a sharp rise in the
gold price the usual suspects invariably scream "manipulation!", but it is no
such thing. Margin changes are a function of price volatility, not price
direction. For example, when the gold price fell sharply in April of 2013 the
margins on gold futures were increased, and when the gold price extended its
sharp decline in June of 2013 the margins were increased again. Strangely, the
perpetual complainers about gold price manipulation did not claim that the
margin increases that occurred in response to downside volatility in 2013 were
an attempt to manipulate the price upward.
Even after Friday's increase, the margins on COMEX gold futures are near the
bottom of their 5-year ranges. Therefore, it's reasonable to expect that
additional margin increases will happen if the price volatility remains high.
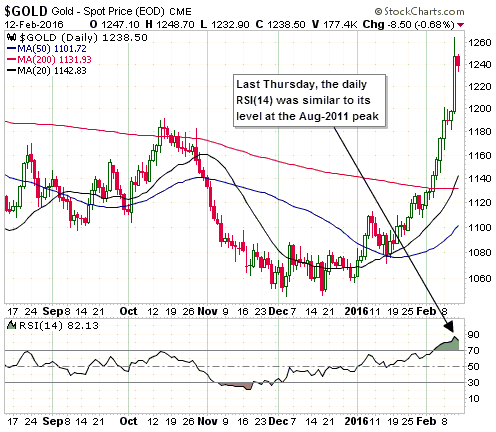
Current Market Situation
The gold market has a short-term problem that has nothing to do with Friday's
small increase in futures margins. The problem actually has two parts. The first
part is that after last Thursday's trading session gold's daily RSI (refer to
the bottom section of the following chart) was as high as it was at the
August-2011 peak.
Another way to see the extent to which the gold market was short-term
'overbought' at last week's peak is to view the position of the price relative
to a moving-average (MA) envelope. The following daily chart shows that the US$
gold price came close to the top of its 50/15 MA envelope (a 15% envelope around
the 50-day MA) last week. The last two times it was this high relative to the
envelope were near the major top in Q3-2011 and near a multi-month top in
late-2009.
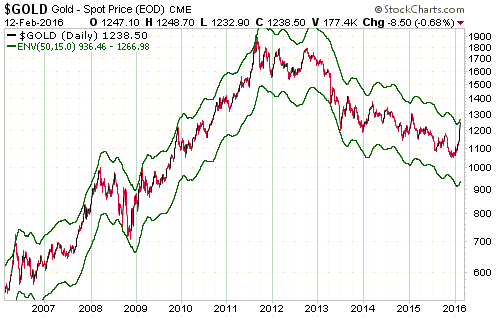
Our point is that on a short-term basis, at last week's high the US$ gold price
was almost as stretched to the upside as it ever gets.
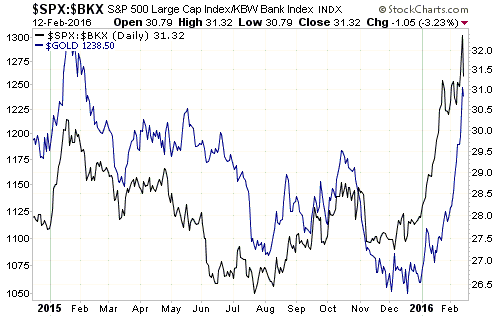
The other part of gold's short-term problem is that the factors that have been
driving the gold price skyward are also now very extended. For example, the
remarkable speed of gold's recent ascent was probably due to the gold market
catching up with the extreme relative weakness in bank stocks since early this
year. As discussed in many previous TSI commentaries and as illustrated by the
following chart, gold is strongly influenced by the SPX/BKX ratio.
With the BKX now very 'oversold' relative to the SPX, some corrective activity
is likely in the near future.
The bottom line is that gold's short-term risk/reward is no longer bullish,
although an additional upside blow-off could happen over the days ahead. If it
does, it will increase the short-term danger.
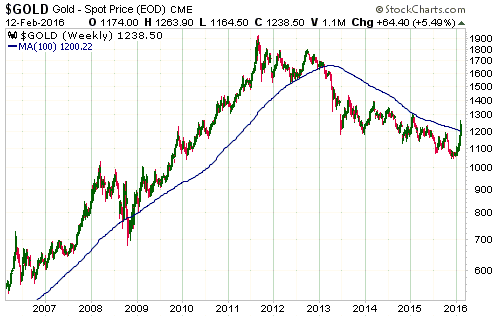
On a more positive note, last week's surge provided evidence that a long-term
reversal has taken place. We are referring to gold's decisive weekly close above
its 100-week MA (see chart below), which differentiates the current rally from
the counter-trend rebounds of 2013-2015.
Gold Stocks
The HUI broke above resistance at 140 during the week before last, which means
that it did more than we thought it would do at such an early stage of the
gold-mining recovery. It then pulled back to test this former resistance (now
support) on Wednesday before extending its advance into the end of the week.
Friday's strength was actually a little surprising, given that it happened in
parallel with a small decline in the gold price and a rebound in the broad stock
market.
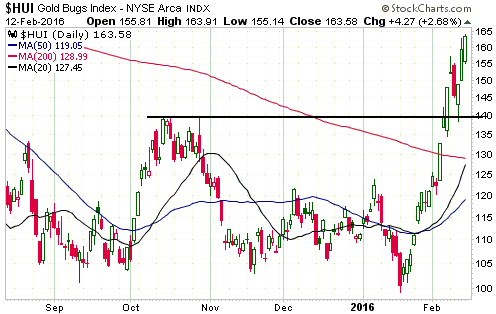
Since bottoming on the 19th of January, the HUI has risen on 15 of 18 trading
days. Of greater significance, it has gained about 60% during this
18-trading-day period. It therefore goes without saying -- but we'll say it
anyway -- that the HUI is now very 'overbought' on a short-term basis.
The HUI was also very 'overbought' on Monday of last week and all we got was a
pullback lasting about 1.5 days. It's certainly possible that something similar
will happen this week, with a pullback lasting only 1-2 days and being followed
by a surge to another new high for the move. However, the higher it goes in the
immediate-term, the bigger the decline will be once a multi-week top is put in
place.
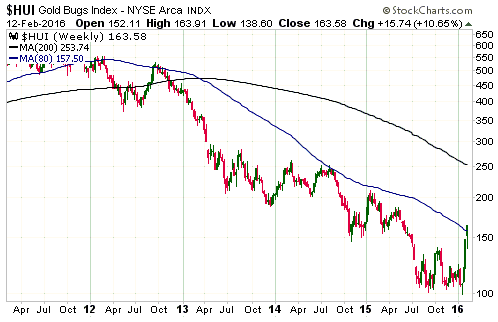
As is the case with gold bullion, at the same time as the HUI's short-term
reward/risk equation has become skewed towards risk, its intermediate-term
outlook has become more definitively bullish. The reason is that the current
rally has just differentiated itself from the counter-trend rebounds of the past
few years by achieving a weekly close above the 80-week MA (see chart below).
The weekly close above the 80-week MA indicates the potential for an extension
to as high as the 200-week MA (the black line on the following chart) before
this year is over.
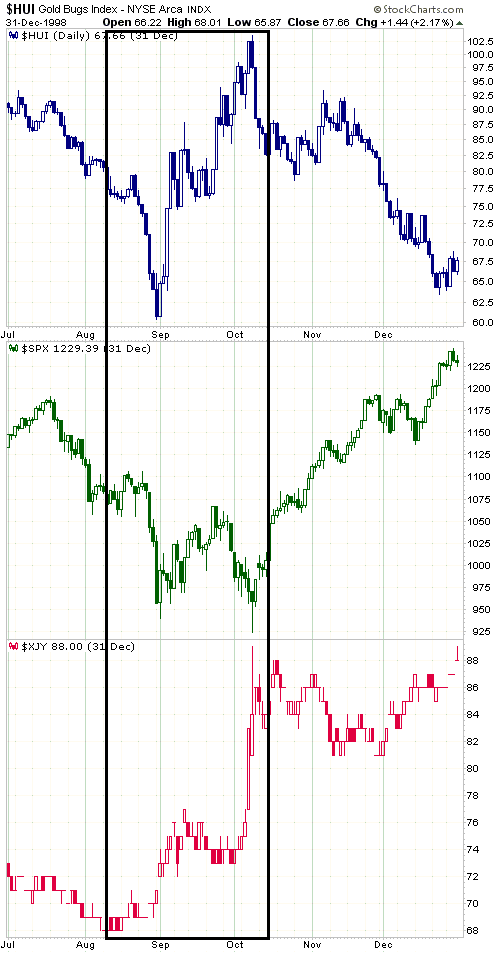
Is there a plausible alternative to a new bull market?
While the evidence suggests that a long-term upward reversal has happened, the
answer to the above question is yes -- at this stage there is still another
realistic possibility.
The plausible alternative to the new-bull-market scenario is that gold-related
investments are benefiting from a short, 1998-style crisis. The following two
sets of charts illustrate this possibility.
The first set of charts shows the performances of the HUI, the SPX and the Yen
during the second half of 1998. Notice that steep declines in the HUI and the
SPX bottomed together at the end of August-1998, after which there was a choppy
rebound in the SPX and a rapid advance in the HUI. Notice, as well, that during
late-September and early-October there was a decline in the SPX to test its
August low in parallel with another surge in the HUI. During the 5-6 week period
when the SPX was rebounding and then dropping to test its low, the HUI gained
70%. As it turned out, this was a bear-market rebound. Lastly, notice the
dramatic rise in the Yen during the 2-week period when the SPX dropped back to
test its August-1998 low.
The next set of charts shows the performances over the past few months by the
same markets. Notice the similarities between the period within the box drawn on
the following set of charts and the period in the box drawn on the above set of
charts.
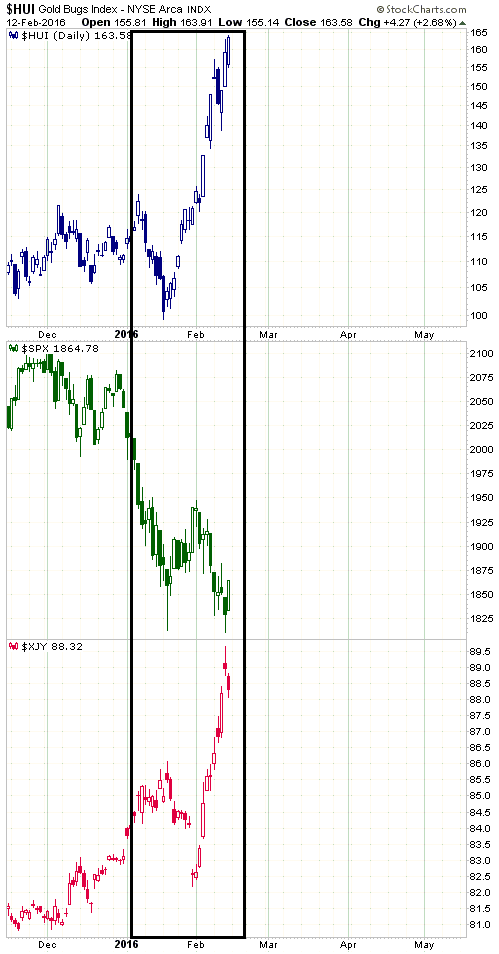
One of the important differences between 1998 and the current situation is that
the entire 1998 decline in the US stock market was over in less than three
months. It was clearly a correction within an on-going bull market, whereas the
recent SPX weakness is an extension of a decline that began about 9 months ago
and shows every indication of being part of a bear market.
If an equity bear-market is underway then it's very likely that new bull markets
in gold and gold-mining have begun. However, the 1998 comparison could still
work in the short-term. That is, short-term extremes in the HUI, the SPX and the
Yen might have occurred last week or could soon occur.
The Currency Market
The Dollar Index closed below support at 96.5 last week. This suggests that the
short-term decline will extend to the bottom of the 12-month range in the
low-90s.
The Dollar Index is also now slightly 'oversold', so even if a drop to the
low-90s is on the cards it would not be surprising to see an intervening 1-2
week consolidation.
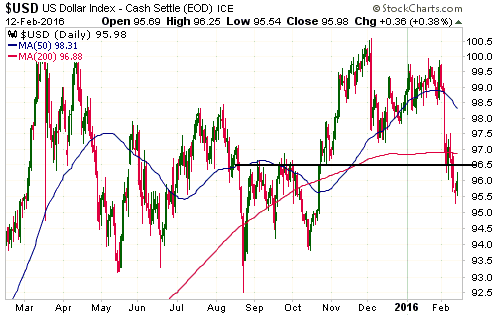
Note that a counter-trend rebound would probably take the Dollar Index back to
former support (now resistance) at 96.5-97.0, but should not result in a weekly
close above 97.5. In other words, a weekly close above 97.5 would mark last
week's downside breakout as false.
Updates
on Stock Selections
Notes: 1) To review the complete list of current TSI stock selections, logon at
http://www.speculative-investor.com/new/market_logon.asp
and then click on "Stock Selections" in the menu. When at the Stock
Selections page, click on a stock's symbol to bring-up an archive of
our comments on the stock in question. 2) The Small Stock Watch List is
located at http://www.speculative-investor.com/new/smallstockwatch.html
 Company
news/developments for the week ending Friday 12th February 2016:
Company
news/developments for the week ending Friday 12th February 2016:
[Note: AISC = All-In Sustaining Cost, FS = Feasibility Study, FY = Financial
Year, IRR = Internal Rate of Return, MD&A = Management Discussion and Analysis,
M&I = Measured and Indicated, NAV = Net Asset Value, NPV(X%) = Net Present Value
using a discount rate of X%, P&P = Proven and Probable, PEA = Preliminary
Economic Assessment, PFS = Pre-Feasibility Study]
*Clifton Star Resources (CFO.V) published its reports for the
quarter ending 31st December 2015. The financial statements included with these
reports confirmed that the company has net cash of about C$12.5M (C$0.26/share),
which is about $500K less than it had at the end of the preceding two quarters
and is well above its current stock price. CFO remains cash rich and asset poor.
The stock is likely to be 'dead money' until there is some corporate activity.
Some corporate activity could happen within the next few months, because it
would make sense for another small gold-mining company to buy CFO in an
all-stock deal just to get hold of CFO's cash.
We wrote the above last Friday. A few hours later it was announced that CFO had
agreed to be bought by First Mining Finance (FF.V) in an all-stock deal (one FF
share for each CFO share). The deal initially valued CFO at C$0.425 (FF's
closing price on Thursday 11th Feb) and currently values CFO at C$0.39/share (FF's
closing price on Friday 12th Feb). CFO ended the week at C$0.37, which is up
about 100% on the day and a slight discount to the value of FF's bid.
Make no mistake that although the press release put out by FF sounds
enthusiastic about the mining projects that it will be getting with this
takeover, the sole reason for the takeover is to get CFO's cash. In effect, FF
is buying CFO in lieu of doing an equity financing.
Despite Friday's doubling, the current CFO price is still a long way below the
price at which the stock entered the TSI List many years ago. However, all
things considered we are pleased to be able to exit at a significant premium to
cash value. CFO has therefore been removed from the TSI List and a large loss
recorded.
Note that we are currently not interested in owning FF shares.
*Endeavour Mining (EDV.TO) had a good week, or at least its
shareholders did. Thanks to a very sharp rise in the gold price, the stock
managed to break above long-term resistance at C$10 and traded at its highest
level in more than 2.5 years.
We continue to be bullish on the intermediate-term prospects for EDV's stock
price, but it is important to keep in mind the risks associated with the region
in which EDV operates. The risks of operating in West Africa are summarised in
the article linked
HERE.
EDV's advantage over companies such as Asanko Gold (AKG), Golden Star Resources
(GSS), Merrex Gold (MXI.V), Roxgold (ROG.V), True Gold Mining (TGM.V) and
Teranga Gold (TGZ.TO) is that its operations are spread over four West African
countries. This means that a crisis in any one or even any two West African
countries is not going to jeopardise EDV's survival. In other words, with EDV
the country risk has been lessened by diversification. However, the country risk
is still significant and will periodically shift to centre-stage.
*Energy Fuels (EFR.TO) provided an update on the status of work at
its Nichols Ranch in-situ recovery (ISR) uranium project in Wyoming. Significant
progress is being made, but the stock market probably won't care as long as the
uranium price continues to flat-line in the mid-$30s.
*Evolution Mining (EVN.AX) reached our valuation-based
intermediate-term upside target of around A$2.00 last week. It is reasonable to
maintain significant exposure, because EVN is the type of stock that will
probably command a substantial valuation premium in the future. However, if,
like us, you have a large position in this stock, then it would be prudent to
now make a partial exit.
*Ramelius Resources (RMS.AX) advised that its pre-tax profit for
the six months to 31 December 2015 is estimated to be A$28.7M. Assuming a tax
rate of 30%, this implies an after-tax 6-month profit of A$20.1M.
Annualising the 6-month profit and dividing the result by the total share count
of 470M gives us an earnings-per-share estimate of A$0.086 for the current
financial year. If we then assume that the company is worth 5-10 times its
current annual earnings, we arrive at a back-of-the-envelope valuation range of
A$0.43-A$0.86.
Given that RMS's profitability currently depends on adding high-grade ore from
small satellite deposits to the ore obtained from its Mt Magnet mine, we think
it makes sense to use the lower end of the aforementioned valuation range.
However, if we became confident that the company was going to at least maintain
its current level of production for several more years then we would use a
higher earnings multiple.
RMS also advised that it has forward sold an additional 60,000 ounces of gold at
a flat forward price of A$1,600 per ounce. It has now locked-in the selling
price on about 50% of its expected production over the coming two years.
It is smart for a gold producer to hedge part of its future production, provided
that a) the hedges are put in place when the gold price is near the top of its
12-month range, and b) the hedges lock-in the price on no more than 50% of one
year's production. RMS has done a good job of managing its hedge book over the
past 1-2 years and the latest forward sales were done at a reasonable price, but
by locking-in the price on 50% of the next 2 years of production the company has
gone too far.
When the stock moved up to near our valuation last week we took profits on half
of the RMS shares in our account (the RMS cost price shown in the TSI List is
A$0.39, but due to averaging down the average cost price of the RMS shares in
our account is much lower). Due to the significant increase in its hedge book
and the lack of clarity on how the company is going to maintain its
profitability beyond the next year or two, our current plan is to exit the
remainder of our shares and to remove the stock from the TSI List if the stock
price rises to around A$0.50 within the next two months. However, this plan is
subject to change as new information becomes available.
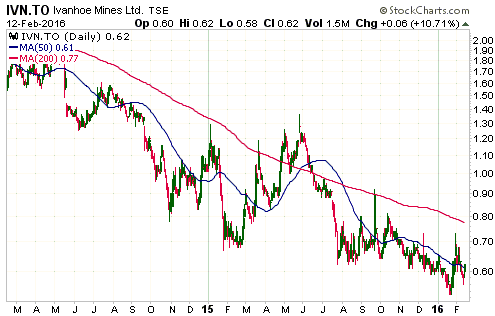
New
TSI stock selection: Ivanhoe Mines (TSX: IVN). Shares: 779M. Recent price:
C$0.62
IVN owns majority stakes in three large undeveloped industrial-metals deposits
in Africa. The time is ripe to begin averaging into an intermediate-term
position in this stock.
Here is an outline of the IVN story:
1) The Balance Sheet
Due to the sale of 49.5% of its Kamoa copper project to China's Zijin Mining
last December, we estimate that IVN currently has US$324M of cash with a further
US$206M of cash to be paid by Zijin in installments over the coming 15 months.
Also, we estimate the company's working capital to be at least C$0.90/share.
Long-term debt is only US$26M, or less than C$0.05/share, so net working capital
is at least C$0.85/share.
2) The Management
The executive chairman is Robert Friedland, one of the all-time great mining
promoters. Friedland will ensure that IVN has the attention of the investing
community during the next industrial-metals bull market.
3) The Mining Assets
a) 50% of the Kamoa copper project in the Democratic Republic of the Congo
(DRC).
With a gargantuan Indicated resource comprising 43.5 BILLION pounds of copper at
an average grade of 2.67%, Kamoa is the world's largest undeveloped high-grade
copper discovery. That's why Zijin was prepared to pay US$412M for half the
project.
According to a PEA completed in Nov-2013, it would cost US$1.4B to develop Kamoa
into a mine with annual copper production of 611M pounds. Assuming a copper
price of US$3.00/pound, the after-tax NPV(8%) and IRR would be $2.5B and 15.2%,
respectively.
The PEA suggests that Kamoa would be viable at $3/pound, but would not be viable
at the current copper price. However, the PEA will soon be superseded by a PFS
that will be based on more up-to-date prices.
b) 68% of the Kipushi zinc project in the DRC.
Late last month IVN reported that the M&I resource for the Kipushi project's
"Big Zinc Zone" contained 10.2M tonnes with a phenomenal average grade of 34.9%
zinc, for 7.8 BILLION pounds of zinc.
IVN is in the process of preparing a PEA for Kipushi.
c) 64% of the Platreef PGM (platinum group metals) project in South Africa (SA)
The Platreef project contains 15.5M ounces of PGM-plus-gold reserves, although
it is no longer appropriate to refer to these ounces as reserves given that the
term "reserve" implies economically viable. A PFS completed in January-2015
showed that the project would be marginal at platinum and palladium prices that
are more than 60% above current market prices, so the project is not remotely
close to being economic at current prices.
4) The Valuation
At current metal prices the Platreef project only has a small amount of option
value. IVN's stake in the Kamoa project is probably worth a few hundred million
dollars based only on Zijin's purchase price, but we'll know more once the PFS
gets published. IVN's stake in the Kipushi project could be very valuable, but
there is currently no engineering study and associated cost/economics analysis
to go on.
Despite the unknowns, we can be confident that the current valuation represents
an attractive entry because the share price is C$0.62 and the company has net
working capital of at least C$0.85/share. This means that the stock market is
presently valuing the above-mentioned assets at less than zero.
5) The Risks
By far the biggest risk is that the company's two most valuable mineral deposits
are located in the DRC. If the DRC were to become immersed in a civil war or
experience a large-scale Ebola outbreak, either or both of which could happen
within the next three years, then IVN's assets in the country would lose all or
most of their value.
The country risk would be a deal-breaker for us if IVN were trading at
C$1.50/share, but it isn't a major concern with the stock trading 27% below its
net working capital.
6) The Price Action
IVN's stock price hit an all-time low of C$0.53 in January. It then rebounded to
a high of C$0.73 in late-January on the back of the Kipushi resource
announcement, some promoting by Friedland and a write-up in Brent Cook's
Exploration Insights newsletter (which is what drew our attention to the stock),
but the enthusiasm was short-lived. Due to a market-wide increase in risk
aversion the stock price returned to the vicinity of its all-time low last week
before rebounding by 10% on Friday.
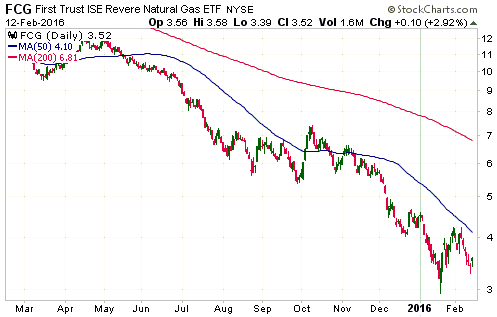
New
trading position in the Natural Gas Equity ETF (FCG). Recent price: US$3.52
Preliminary evidence emerged last week that the broad stock market and the oil
market have made short-term price bottoms. If so, FCG stands a good chance of
rallying over the next few weeks. A short-term trading position in FCG has
therefore returned to the TSI List.
List
of candidates for new buying
From within the ranks of TSI stock selections the best candidates for new buying
at this time, listed in alphabetical order, are:
1) AAU in the low-US$0.60s (last Friday's closing price: US$0.68)
2) COPX (the Global X Copper Miners ETF) (last Friday's closing price: US$10.34)
3) FCG (last Friday's closing price: US$3.52)
4) IVN.TO (last Friday's closing price: C$0.62)
Note that the above list is limited to five stocks. It will sometimes contain
less than five, but it will never contain more than five regardless of how many
stocks are attractively priced for new buying.
Comments
on Kinross Gold (KGC) 2015 results and 2016 guidance
KGC isn't a member of the TSI Stocks List. However, we mentioned several times
in TSI commentaries over the past year that it offered by far the best value
within the realm of 1M-oz/year gold producers and we have periodically traded it
via call options.
After the close of trading last Wednesday KGC published its results for 2015 and
its production guidance for 2016. This information hasn't changed our view that
KGC offers the best value within the ranks of senior gold stocks, although there
were some yellow flags buried in the details. Also, the bulk of the short-term
upside potential has been removed by the large rise in the stock price over the
past two weeks.
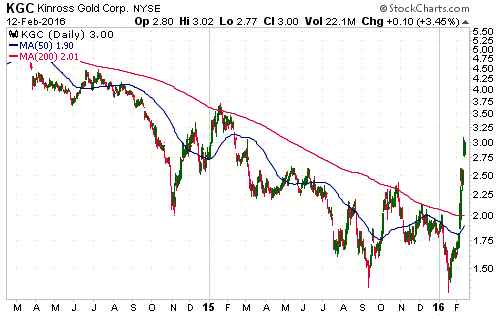
The first yellow flag was the cost performance in 2015. The per-ounce cash cost
was about 3% lower in 2015 than in 2014 and the AISC was about the same in 2015
as it was in 2014. These numbers look fine until you take into account the huge
decline in the average oil price from 2014 to 2015 and the substantial cost
benefit that KGC should have received due to large declines in the Russian
Ruble, the Canadian Dollar and other currencies relative to the US$. This
suggests to us that KGC's operations became less efficient in 2015, with the
decline in efficiency masked by cheaper oil and weaker local currencies.
The second yellow flag was 2016 production guidance of 2.7M-2.9M ounces. The
company produced 2.6M ounces in 2015, so at first glance the 2016 forecast looks
good. However, early this year KGC completed an acquisition that will add about
400K ounces/year to its production, so excluding the effect of the recent
acquisition the 2016 guidance indicates a production decline of 100K-300K ounces
in 2016 compared to 2015.
The third yellow flag was a $127M increase in KGC's net debt position (long-term
debt minus working capital) over the course of 2015, excluding the effects of
acquisitions. We hasten to point out, though, that even after paying $610M for
new assets early this year, KGC's balance sheet is in reasonable shape.
It goes without saying (given the price action) that in the midst of last week's
optimism about the prospects of anything gold-related, these yellow flags didn't
matter.
Chart Sources
Charts appearing in today's commentary
are courtesy of:
http://stockcharts.com/index.html
http://research.stlouisfed.org/
