![]()
![]()
![]()
![]()
-- Weekly Market Update for 15th April 2019
Big Picture
View
Here is a summary of our big picture
view of the markets. Note that our short-term views may differ from our
big picture view.
The BULL market in US Treasury Bonds that began in the early 1980s ended in mid-2016, but there will be many years of topping action in bond prices and bottoming action in bond yields before major new trends get underway. A major decline in government bond prices will unfold during the 2020s. (Last update: 11 September 2017)
The stock market, as represented by the S&P500 Index, commenced a secular BEAR market during the first quarter of 2000, where "secular bear market" is defined as a long-term downward trend in valuations (P/E ratios, etc.), gold-denominated prices and inflation-adjusted prices. This secular trend will bottom in 2020 or later. (Last update: 11 September 2017)
A cyclical BEAR market in the US Dollar began in 2016-2017. (Last update: 11 September 2017)
Gold commenced a secular bull market relative to all fiat currencies, the CRB Index, bonds and most stock market indices during 1999-2001. This secular trend will peak in 2020 or later. (Last update: 11 September 2017)
Commodities,
as represented by the CRB Index, commenced a
secular BULL market in 2001 in nominal dollar terms. The first major
upward leg in this bull market ended during the first half of 2008, but
a long-term peak won't occur until 2020 or later.
(Last
update: 11 September 2017)
Copyright
Reminder
The commentaries that appear at TSI
may not be distributed, in full or in part, without our written permission.
In particular, please note that the posting of extracts from TSI commentaries
at other web sites or providing links to TSI commentaries at other web
sites (for example, at discussion boards) without our written permission
is prohibited.
We reserve the right to immediately
terminate the subscription of any TSI subscriber who distributes the TSI
commentaries without our written permission.
True
Fundamentals Summary
[Notes:
1) The date shown next to the current True Fundamentals Model (TFM) signal is
when the most recent change occurred. 2) Charts of the Gold and Equity
TFMs are included in the "Charts and Indicators" section of the TSI web
site]
| Market | True Fundamentals Model (TFM) |
| Gold (US$ Price) | Bullish (04 Jan 2019) |
| US Equity (SPX) | Neutral (12 Apr 2019) |
| Currency (Dollar Index) | Neutral (15 Mar 2019) |
| Commodities (GNX) | Bearish (01 Jun 2018) |
Last week's posts at the TSI Blog
The gold/commodity ratio makes another T-Bond forecast
Summary of current
thinking/positioning
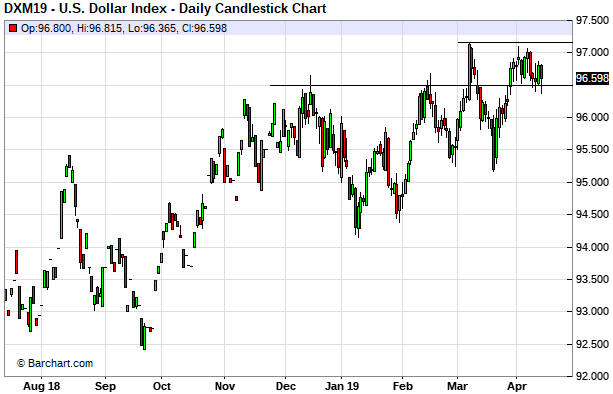
1) The Dollar Index (DX)
probably has commenced a multi-month decline, but a weekly close below the
20th March low (95.17) is required to confirm this scenario.
2)
Regardless of whether or not its short-term correction is complete, gold
probably will trade in the $1400s before the middle of this year. There is
also a chance that a gold bull market will be signaled within the next few
months, but it hasn't been signaled yet.
3) The gold-mining indices
and ETFs are at risk of experiencing quick declines of 5%-8% to end their
corrections, but we expect them to make new highs for the year this
quarter.
4) The US stock market and many other stock markets are
short-term 'overbought'. This could mean that multi-week pullbacks will
begin soon, but the intermediate-term rallies probably aren't over.
5) The T-Bond probably has topped on an intermediate-term basis.
6) We are holding a cash reserve of 30%-35%.
No Interim Update
this week
As forewarned a week ago, due to
family commitments we'll be skipping another Interim Update this week.
Therefore, the next TSI commentary will be the Weekly Update scheduled to
be published on 21st April.
As usual, we will send out a Market
Alert email if something dramatic happens in the markets or we think that
immediate action is required.
Sentiment
Overview
The main drawback with using
sentiment as a market timing indicator is that sentiment almost always
follows price. As a consequence, it's a virtual certainty that important
market peaks will be associated with an optimistic extreme and important
market bottoms will be associated with either extreme fear or total
disinterest. However, a sentiment extreme doesn't necessarily imply a
price extreme. For example, during the course of a bear market there will
be many pessimistic extremes but only the last one will coincide with a
major price low. Sentiment still can be useful, but due to this limitation
it should be viewed as only one piece of a big puzzle.
There are
currently no major sentiment extremes in the markets we follow, but
according to one or more indicators some markets are close to multi-year
extremes and others are in interesting situations (sentiment-wise). Here
are some examples:
1) According to sentiment surveys, the gold
market reached a major sentiment extreme last August. Of particular
significance, at that time the brokerages and advisory services monitored
by Consensus-inc became, as a
group, more bearish on gold than they had been at any time since 2004. In
other words, the Consensus-inc bullish sentiment index for gold hit a
14-year low in August of 2018.
The following chart shows that the
bullish sentiment index for gold has since rebounded, as would be expected
given the price action, but not by anywhere near enough to generate a
danger signal. Regardless of gold's long-term prospects, it would be
normal for the upward price trend to continue until the bullish percentage
rose to at least 70.
Gold's COT situation was very bullish in early December of last year
and presently is slightly bullish. Overall, the sentiment backdrop is
supportive for gold, but not decisively so.
2) Based on the
Consensus-inc survey, the silver market reached a major sentiment extreme
last September. At that time the Consensus-inc bullish sentiment index was
near a 14-year low. However, based on the COT data the sentiment situation
for silver did not become unequivocally bullish until December.
The
bullish sentiment index for silver is still in the bottom third of its
17-year range, but the COT data are not supportive. Overall, the current
sentiment situation for silver is neutral at best.
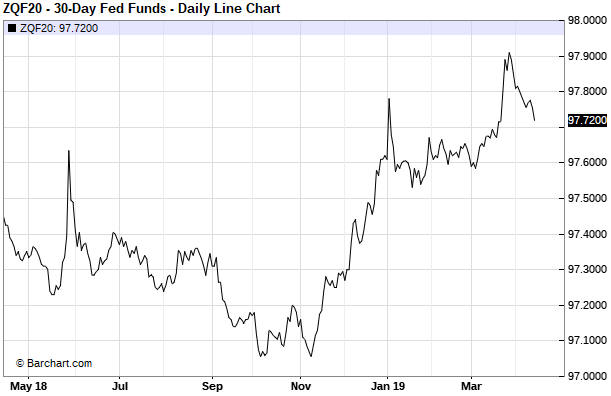
3) The bullish sentiment index for the T-Bond hit a 4-year low late
last year and at the same time the COT data were indicating extreme
negativity on the part of speculators in T-Bond futures. This meant that a
sentiment platform capable of supporting a strong rebound was in place.
The situation is very different now. A few weeks ago the NonReportable
(that is, small) traders became net-long T-Bond futures for the first time
since 2012 and the following chart shows that the Consensus-inc bullish
percentage for the T-Bond is at a 2-year high. This suggests that
sentiment is now a strong head-wind for the T-Bond price.
4) The COT data and the Consensus-inc bullish sentiment index
indicated substantial, albeit not quite extreme, negativity in the oil
market late last year. The following chart of the Consensus-inc bullish
percentage shows that the level of optimism has since rebounded, but not
by enough to suggest that an intermediate-term price top is near. It's a
similar story with the COT data.
As is the case with the gold
market, it would be normal for the upward price trend in the oil market to
continue until the bullish percentage rose to at least 70.
5) The message from the majority of the sentiment measures we follow
is that the general level of optimism about the US stock market's
prospects has rebounded strongly from its December-2018 nadir but remains
well below last year's peak. In fact, only one of our favourite US stock
market sentiment indicators is warning of substantial downside risk right
now. The warning is coming from the TSI Put/Call Indicator (TPCI).
With reference to the bottom section of the following chart, TPCI
generates a sell signal when it drops below 0.30 and a buy signal when it
moves above 0.80. Historically, the buy signals have been more reliable
than the sell signals.
The sell signal generated during the first
half of February was not followed by a significant decline in the SPX, so
that signal can be considered to have failed. New sell signals were
generated in late March and last week.
It is unusual for the TPCI
to do what it has just done, which is generate two signals within such a
short period of time. Because the TPCI is supposed to warn of downside
risk within the coming month and because the most recent two signals were
separated by only three weeks, it makes sense to view the two signals as a
single warning.
6) The Swiss Franc (SF) is the major currency with the most bullish
sentiment set-up at this time. In this regard it is slightly ahead of the
Australian dollar.
As illustrated below, the SF's bullish sentiment
index has spent the past 12 months near the bottom of its 17-year range.
Also, the COT data shows that speculators are betting aggressively against
the SF at the moment. This combination creates a sentiment platform
capable of supporting a strong multi-month rally.
Commodities
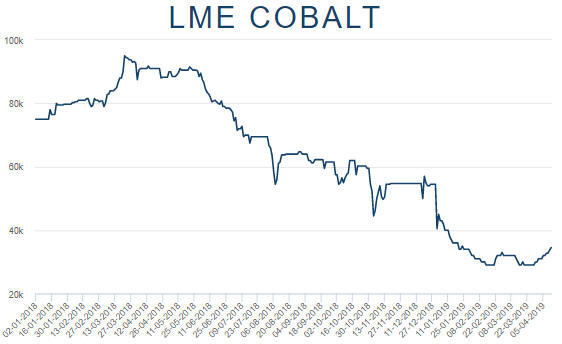
Cobalt revival?
The price of cobalt has rebounded from a February-March double bottom
of US$29,000/tonne to US$34,500/tonne. That's a gain of almost 20% in less
than a month.
There have been two other rebounds of 20% or more
during the major decline that got underway at around this time last year.
For the current rebound to differentiate itself from the counter-trend
bounces of 2018 there will have to be a correction to a higher low (above
$29,000/t) followed by a rise to a higher high, that is, to above the
April high assuming a correction starts before the end of this month.
We remain long-term bullish on cobalt. Cobalt 27 Capital (KBLT.V)
continues to be our favourite way to gain exposure to the metal and we
also like eCobalt Solutions (ECS.TO) at around C$0.34.
Buy
a pullback in the platinum price
A week ago we noted that
the US$ platinum price had broken above lateral resistance and had risen
to its highest level since June of last year. We also wrote that the
market was a little stretched to the upside on a short-term basis and
could soon commence a correction, but that significant additional gains
were likely prior to the next multi-month top. We guessed that platinum
would trade at/near $1000 prior to the middle of this year.
It's
possible that a correction has begun. Whether it has or not, we wanted to
point out that the next short-term buying opportunity would be created by
a decline to around the 50-day MA. As illustrated by the following daily
chart, this MA is at $845 and rising.
The weekly chart displayed below shows that over the past two weeks
the platinum price hit a trend-line drawn from the 2016 top. Once this
trend-line is exceeded on a weekly closing basis, subsequent pullbacks
should hold at/above the 20-week MA until an intermediate-term top is
reached.
The Stock Market
Money supply and the
stock market
A popular view is that the Fed has given up
on monetary tightening and as a result the stock market should continue to
trend upward over the months ahead. This view is based on flawed
reasoning.
The reality is that the Fed possibly will give up on
monetary tightening later this year, but currently the Fed is pulling
quite firmly on the monetary reins via its on-going balance-sheet
reduction program. Moreover, the Fed's on-going withdrawal of money from
the economy is not being fully offset by the actions of the commercial
banks, so the overall US monetary situation is becoming increasingly
restrictive. This is evidenced by the following chart of the
year-over-year (YOY) change in US True Money Supply (TMS). The chart shows
that in March-2019 the US monetary inflation rate made a 12-year low.
The unusually-low rate of US money-supply growth is not a good reason
to be short-term bearish on the US stock market, because changes in the
financial markets lag changes in the monetary backdrop by long and
variable amounts of time. However, the monetary situation leads us to the
conclusion that if a bear market did not begin in September-October of
last year then it will begin by the second half of next year at the
absolute latest. Other indicators will be required to narrow-down the
timing.
Current Market Situation
As
evidenced by the TSI Put/Call Indicator (discussed above), optimism in the
US stock market is at a level that suggests high downside risk. Also, all
of the important US stock indices are stretched in momentum terms. In
other words, the market is 'over-bullish' and 'overbought'.
At the
same time, there isn't a single bearish divergence worth mentioning. On
the contrary, the NYSE Advance-Decline Line (ADL) ended last week at
another new all-time high, as did the economically-sensitive Semiconductor
Index (SOX). These are significant bullish divergences given that the
senior stock indices (the SPX, the NDX and the Dow Industrials Index)
remain below last year's highs.
Here are three charts that
encapsulate the current situation in the US stock market.
First up
is a daily chart of the SPX and the NYSE ADL. Notice that the SPX is now
within about 1% of major resistance defined by last year's high, which is
a reason to be cautious about the market's near-term prospects but not a
reason on its own to expect a substantial decline to begin soon.
Next up is a daily chart of the Dow Transportation Average (TRAN).
TRAN eliminated a bearish divergence when it broke above its February high
during the week before last and extended its short-term rally last week.
Last up is a weekly chart of the SOX. The RSI at the bottom of this
chart shows that the SOX is as 'overbought' now as it was 'oversold' in
December, but given that there has been a decisive break to new all-time
highs the most likely way for the overbought condition to be alleviated is
via a short-term correction as opposed to an intermediate-term downward
trend.
Partly because we have a direct financial interest in its performance
and partly because it represents one of the few sectors of the market
where there is scope for significant additional upside, the Oil Services
ETF (OIH) warrants a comment.
OIH essentially traded sideways near
resistance at $18.00 last week and maintains the potential to surge to
around $20 in the near future. If this happens it will create a short-term
selling opportunity, but unless it happens this week it won't be enough to
rescue the OIH call options that are in the TSI List. These options expire
on Thursday 18th April.
$20 is a reasonable upside target for the
first half of this year, but note that OIH could trade much higher before
year-end if the stock market remains in an intermediate-term upward trend.
That, of course, is a big 'if'.
At this stage we expect that a large stock market decline will start
from whatever peak is made this quarter. That was our forecast at the
beginning of the year and we currently see no reason to alter it. However,
due to the complete absence of bearish divergences the next downward
reversal will more likely mark the start of a short-term correction than
the start of the aforementioned large decline.
This week's
significant US economic events
[Notes:
1) The most important events
(to the markets) are shown
in bold. 2) A list of global economic events can be found
HERE]
| Date | Description |
| Monday Apr-15 | No important events scheduled |
| Tuesday Apr-16 | Industrial Production |
| Wednesday Apr-17 |
International Trade Balance Fed's Beige Book |
| Thursday Apr-18 |
Retail Sales Business Inventories Leading Economic Indicators |
| Friday Apr-19 |
Housing Starts Building Permits |
Gold and the Dollar