![]()
![]()
![]()
![]()
-- Weekly Market Update for 15th July 2019
Big Picture
View
Here is a summary of our big picture
view of the markets. Note that our short-term views may differ from our
big picture view.
The BULL market in US Treasury Bonds that began in the early 1980s ended in mid-2016, but there will be many years of topping action in bond prices and bottoming action in bond yields before major new trends get underway. A major decline in government bond prices will unfold during the 2020s. (Last update: 11 September 2017)
The stock market, as represented by the S&P500 Index, commenced a secular BEAR market during the first quarter of 2000, where "secular bear market" is defined as a long-term downward trend in valuations (P/E ratios, etc.), gold-denominated prices and inflation-adjusted prices. This secular trend will bottom in 2020 or later. (Last update: 11 September 2017)
A cyclical BEAR market in the US Dollar began in 2016-2017. (Last update: 11 September 2017)
Gold commenced a secular bull market relative to all fiat currencies, the CRB Index, bonds and most stock market indices during 1999-2001. This secular trend will peak in 2020 or later. (Last update: 11 September 2017)
Commodities,
as represented by the CRB Index, commenced a
secular BULL market in 2001 in nominal dollar terms. The first major
upward leg in this bull market ended during the first half of 2008, but
a long-term peak won't occur until 2020 or later.
(Last
update: 11 September 2017)
Copyright
Reminder
The commentaries that appear at TSI
may not be distributed, in full or in part, without our written permission.
In particular, please note that the posting of extracts from TSI commentaries
at other web sites or providing links to TSI commentaries at other web
sites (for example, at discussion boards) without our written permission
is prohibited.
We reserve the right to immediately
terminate the subscription of any TSI subscriber who distributes the TSI
commentaries without our written permission.
True
Fundamentals Summary
[Notes:
1) The date shown next to the current True Fundamentals Model (TFM) signal is
when the most recent change occurred. 2) Charts of the Gold and Equity
TFMs are included in the "Charts and Indicators" section of the TSI web
site]
| Market | True Fundamentals Model (TFM) |
| Gold (US$ Price) | Bullish (04 Jan 2019) |
| US Equity (SPX) | Bearish (19 Apr 2019) |
| Currency (Dollar Index) | Neutral (15 Mar 2019) |
| Commodities (GNX) | Bearish (01 Jun 2018) |
Last week's posts at the TSI Blog
Gold and Inflation Expectations
Summary of current
thinking/positioning
1) The Dollar Index (DX) has
commenced a downward trend, but it could be a few months before the new
trend becomes consistent. In the meantime the price action could be
choppy, possibly involving a test of the June high near 98.
2) The
US$ gold price has broken out to the upside on a monthly basis.
Significant additional gains are likely within the next three months --
after the current correction has run its course. The US$ silver price
stands a good chance of making a catch-up move over the months ahead.
3) The gold-mining indices/ETFs became extremely 'overbought' late
last month and have since been in correction mode. The correction may or
may not be over, but either way there probably will be additional gains
within the coming two months.
4) The SPX probably will commence a
sizable multi-week decline soon.
5) An upside blow-off has set the
stage for a large T-Bond decline. The decline probably began on Friday 5th
July, although it could be September-October before the market starts
trending downward with conviction.
6) Oil's correction is probably
over, although there is still a risk that stock market weakness during
July-August will push the oil price to a new multi-month low.
7) We
are holding a cash reserve of 25%-30%.
A reversal in the
Treasury market
We now have evidence that a top
of at least short-term importance is in place for the prices of long-dated
US Treasury securities. The evidence is last Thursday's break by the 20+
Year Treasury ETF (TLT) below the bottom of the price channel that formed
over the preceding 6 weeks.
We think that TLT will trade a lot lower before year-end in response
to expectations for higher "inflation" and a rapid increase in government
debt supply, but other than expecting the early-July high to remain the
high for the year we don't have a firm opinion regarding performance over
the next two months. One realistic short-term possibility is a topping
process involving a multi-week low before the end of this month followed
by a rebound to a lower high over the ensuing few weeks.
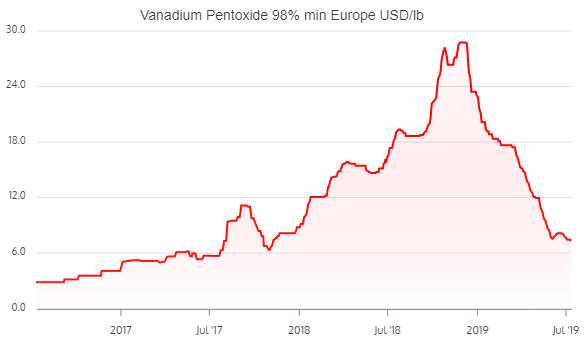
Commodities
Vanadium extends its
downward trend
Our most recent comment on vanadium was in
the 17th June Weekly Update, at which time the price had just bounced
following a major decline. We wrote:
"Our guess is that the
industrial demand for vanadium will increase over the next six months due
to the rebuilding of stockpiles that were drawn down over the past six
months and new Chinese rebar standards coming into full effect. This
should result in an upward bias in the price, but not the sort of
spectacular rally that occurred in 2018."
Our vanadium outlook
is unchanged. However, the following chart shows that the vanadium
pentoxide price in Europe made a new 18-month low last week, so the
anticipated upward bias hasn't commenced yet.
The Palladium bubble is intact
From the 1st
April Weekly Update:
"As ridiculously expensive as palladium
appears to be relative to other metals, most notably platinum, the decline
from the mid-March peak is more likely to be the start of a multi-month
correction than the start of a bubble collapse."
And from the
6th May Weekly Update:
"It's possible that the sharp decline in
the palladium price from its March-2019 high marked the bursting of the
bubble, but as mentioned in the 1st April Weekly Update it's more likely
that the decline is the start of a multi-month correction. This is based
on a comparison with the palladium rally of 1997-2000 and the fact that
the end of the first parabolic move in a cyclical advance generally
doesn't mark the end of the cycle.
If we are dealing with a
multi-month correction rather than the start of a bubble collapse then the
palladium price should not give a weekly close below its 50-week MA (the
blue line on the following chart)."
Our view that the sharp
decline in the palladium price from its March-2019 peak was probably the
start of a multi-month correction rather than the start of a bubble
collapse was correct, because over the past week the metal traded at a new
all-time high.
Palladium is in a bubble, but the bubble is not yet
fully inflated.
Despite the potential for another parabolic rally in the palladium
price over the months ahead, we are not the slightest bit interested in
buying palladium at its current stratospheric valuation. However, we would
buy platinum in anticipation of at least a partial catch-up move. Platinum
has a vastly superior risk/reward.
Platinum is still
relatively weak
The platinum price remains near an
all-time low in gold terms and not far from a 10-year low in US$ terms. We
suspect that in US$ terms it is 'coiling' in preparation for a large
advance, although the chart pattern (see below) leaves open the
possibility that last year's low will be tested prior to the start of such
an advance.
A weekly close above US$920 would confirm that the
expected large advance had begun.
More evidence of a correction low in the oil price
Last week the oil market added to the evidence that its correction
ended during the first half of last month. It did so by closing above its
early-July high, a short-term trend-line drawn from the April peak and its
50-day and 200-day MAs.
The big test for oil will occur during the
US stock market's next meaningful decline, because there is still a strong
positive correlation between the oil price and the SPX.
The Stock Market
Current US Market
Situation
Last week the S&P500 Index (SPX), the NASDAQ100
Index (NDX) and the Dow Industrials Index (Dow) all broke into new
all-time high territory on a weekly closing basis. Refer to the following
weekly charts for the details. Also, the new highs were confirmed by the
NYSE Advance-Decline Line (ADL). This is evidence that the bull market is
intact, but it doesn't provide any information about the market's likely
path over the coming 1-2 months.
As well as breaching previous highs, last week's closes in the SPX and
the Dow were above big round numbers: 3,000 for the SPX and 27,000 for the
Dow. Also, the NDX ended the week within spitting distance of a big round
number of its own (8,000).
Getting to these big round numbers
generates headlines in the press, but otherwise doesn't mean much for
investors. Also, as is the case with the upside breakouts it doesn't
provide any information about the market's likely path over the coming 1-2
months.
Based on sentiment and cycles, we continue to expect a
significant multi-week decline. However, for risk management purposes we
would exit short-term bearish speculations if the SPX were to make a new
high after this week.
The monetary inflation headwind
The year-over-year rate of growth in US True Money Supply (TMS) made a
new cycle low in June-2019 and is not far from its 20-year low. The
relevant monthly chart is displayed below.
This means that the
money-supply situation constitutes a steadily increasing headwind. Note,
though, that the cyclical equity bull market of 2003-2007 didn't die until
about 12 months after the TMS growth rate plumbed a similar level in
September-2006. This simply means that the monetary inflation rate is not
a good short-term or intermediate-term stock-market timing indicator.
Time to bet against Tesla?
In the 10th June
Weekly Update we wrote that almost regardless of what happens to the US
stock market, Tesla (TSLA) probably is on the road to extinction. We
thought that TSLA would be a good candidate for a bearish speculation if
the stock price were to rebound to around $240 (it was trading at $204 at
the time).
The following chart shows that TSLA has since rebounded
to the $240s and that the rebound is a test of the May-2019 downside
breakout. If you are interested in betting against this over-priced,
cash-consuming, debt-laden company, now would be a reasonable time to do
so.
Note that betting against TSLA is not a trade that we will be
doing in the near future, but only because right now we are involved in
more than enough different speculations.
This week's
significant US economic events
[Notes:
1) The most important events
(to the markets) are shown
in bold. 2) A list of global economic events can be found
HERE]
| Date | Description |
| Monday Jul-15 | No important events scheduled |
| Tuesday Jul-16 |
Retail Sales Industrial Production Business Inventories |
| Wednesday Jul-17 |
Housing Starts Fed's Beige Book |
| Thursday Jul-18 | Leading Economic Indicators |
| Friday Jul-19 | Consumer Sentiment |
Gold and the Dollar
The 1980s comparison discussed above suggests that the HUI's breakout
will prove to be sustainable, in which case it will be confirmed by
related prices this week. However, it isn't reasonable to blindly assume
that over the next several weeks the gold-mining sector will mimic the
near-vertical ascent of March-April 1987. It possibly will, but additional
corrective action of sufficient magnitude or duration to push the daily
RSI(14) down to around 50 is required to create a new short-term buying
opportunity for the popular mining ETFs.
Unlike the gold-mining
sector, the silver market is not remotely close to being 'overbought'.
Consequently, for new buying at this time we prefer silver bullion to the
mining ETFs.
The Currency Market
Last
Tuesday the Dollar Index (DX) tested lateral resistance at 97.2 and
managed to close above its 50-day MA for the first time since early-June.
It then dropped over the remainder of the week. The catalyst for the
pullback was the non-subtle hint of easier US monetary policy in testimony
delivered by the Fed Chairman on Wednesday.
The Wednesday-Friday
pullback took the DX from lateral resistance at 97.2 to moving-average
support at 96.4.
It's possible that the DX's rebound from its June low ended last
Tuesday, but an extension of the rebound is also a realistic possibility.
Either way, we are anticipating significant weakness in the DX over the
next several months.
Future US$ weakness has been signaled by the
gold market and by the recent performances of the Swiss Franc, the Yen and
the Canadian dollar. Also, future US weakness meshes with how we see the
fundamental backdrop developing over the months ahead, although we hasten
to point out that the true fundamentals are US$-neutral at this time.
Updates
on Stock Selections
Notes: 1) To review the complete list of current TSI stock selections, logon at
http://www.speculative-investor.com/new/market_logon.asp
and then click on "Stock Selections" in the menu. When at the Stock
Selections page, click on a stock's symbol to bring-up an archive of
our comments on the stock in question. 2) The Small Stock Watch List is
located at http://www.speculative-investor.com/new/smallstockwatch.html
![]() Company
news/developments for the week ending Friday 12th July 2019:
Company
news/developments for the week ending Friday 12th July 2019:
[Note: AISC = All-In Sustaining Cost, EBITDA = Earnings Before
Interest, Tax, Depreciation and Amortisation (a measure of cash flow), EV
= Enterprise Value or Electric Vehicle, FS = Feasibility Study, FY =
Financial Year, IRR = Internal Rate of Return, ISR = In-Situ Recovery, JV
= Joint Venture, MD&A = Management Discussion and Analysis, M&I = Measured
and Indicated, NAV = Net Asset Value, NPV(X%) = Net Present Value using a
discount rate of X%, NSR = Net Smelter Return or Net Smelter Royalty, P&P
= Proven and Probable, PEA = Preliminary Economic Assessment, PFS =
Pre-Feasibility Study]
*Alkane Resources (ALK.AX)
published its quarterly report for the June-2019 quarter (the final
quarter of FY2019). After another above-plan quarterly performance from
the Tomingley Gold Operation (TGO), gold production for the full financial
year was 49K ounces. This was at the top of the upwardly-revised guidance
range and about 60% above the original guidance. In other words, the TGO
performed very well in FY2019.
Production guidance for FY2020 (the
financial year ending 30th June 2020) is 27K-32K ounces of gold at an AISC
of A$1300-$1450. Note: The current A$ gold price is around $2000/oz.
The Tomingley open pit is depleted and the current production is
solely from the processing of stockpiles. That's why the amount of gold
produced has been trending downward. However, the life of the operation
has been extended by the construction of an underground mine that is
scheduled to go into production during the March quarter of 2020. Also,
exploration results indicate the potential to establish a new pit within a
few kilometres of the existing plant.
With regard to the Dubbo
specialty metals project, which is where the bulk of ALK's value and
upside potential lies, the company's efforts to arrange financing and
offtake agreements are on-going.
ALK has a strong balance sheet,
with no debt and cash, bullion plus listed investments of about A$81M.
This figure is roughly the same as it was 6 months ago.
*Alliance
Mineral Assets (A40.AX) reported June-quarter lithium concentrate
production from its Bald Hill mine that was roughly the same as the March
quarter, enabling the company to achieve a production result for the first
half of CY2019 that was close to the top of its guidance range.
Specifically, during the first half of this calendar year A40 produced
78,937wmt (wet metric tonnes) of 6.0% Li2O-equivalent versus guidance of
65,000-80,000 wmt. This constitutes a solid production performance,
although production costs won't be known until the end of this month and
the complete financial picture won't be known until the annual financial
report is published in September.
Production for the next 6 months
is expected to be similar to production over the past 6 months.
We
are comfortable with the way A40 is performing on the ground, but like all
lithium producers the company is struggling against market headwinds in
the form of a downward trending lithium price. There's a high probability
that it eventually will be taken over by either Galaxy Resources (GXY.AX)
or Mineral Resources (MIN.AX), two companies that have lithium mines in
the same part of Western Australia as A40's Bald Hill project, but
hopefully the takeover will happen during a more bullish period for
lithium miners.
*eCobalt Solutions (ECS.V)
will hold a shareholders meeting on 19th July to vote on the proposed
merger with Jervois Mining (JRV.AX, JRV.V). If the merger is approved then
each ECS share will be exchanged for 1.65 JRV shares. Based on JRV's
current price of A$0.20 on the ASX and the current A$/C$ exchange rate,
the merger values ECS at around C$0.30/share.
We added ECS to the
TSI List as an intermediate-term trading position primarily due to the
stock's discount to the implied value of the JRV merger proposal. Also,
our view is that combining the two companies is in the best interest of
both ECS and JRV, so we think that shareholders should vote in favour of
the merger.
First Cobalt (FCC.V), the holder of a 6% stake in ECS,
has been sending out letters advising ECS shareholders to vote against the
merger. FCC obtained its ECS stake via a share swap with a third party
AFTER the proposed ECS-JRV merger was announced, for reasons that aren't
clear to us.
Note that FCC does not have significant financial
resources (the company had minimal working capital at 31st March and
probably has negative working capital right now) and therefore is not in a
position to make a positive contribution to ECS. JRV, on the other hand,
has about A$20M of working capital and is positioned to advance projects
in Australia and Africa in addition to the Idaho-based project currently
owned by ECS.
*Cobalt 27 Capital (KBLT.V)
is subject to a takeover bid from Pala Investments, its largest
shareholder. In the 19th June Interim Update we wrote that the bid was not
even remotely close to full value.
In June-2018 KBLT purchased from
Vale, at a cost of US$300M, a "stream" that entitles it to cobalt
production from the Voisey's Bay (VB) nickel mine in Canada beginning on
1st January 2021. The stream entitles KBLT to 32.6% of the cobalt
production from VB until 23.8M pounds have been delivered and 16.3%
thereafter. The timing of this purchase was inopportune to put it mildly,
as the cobalt price has subsequently crashed from US$35/pound to only
US$12/pound. However, by selling now the senior managers of KBLT would be
compounding their error. Having bought near a major high they would be
selling near what very likely will turn out to be a major low.
Furthermore, since production linked to the VB project doesn't commence
until 2021, the current price of cobalt is not relevant. What really
matters is what the cobalt price will be from 2021 onwards. By then it
could well be where it was in early 2018 or even higher.
All of
which raises the question: Why is KBLT's management supporting the Pala
takeover bid? After all, the company has a strong balance sheet and
therefore is not under financial pressure to dump high quality assets at
fire-sale prices.
A possible answer to the above question was
mentioned in the detailed and scathing response to the proposed takeover
provided by Anson Funds, a large KBLT shareholder. The full response, with
which we are in total agreement, can be read
HERE.
Anson notes that if the takeover is successful then
KBLT's existing managers will receive change of control payments and will
manage the spin-out company to be called "Nickel 28". In other words, they
will receive financial bonuses and will continue to draw their salaries.
Fortunately, minority shareholders will have an opportunity to vote
against this nonsensical takeover, and thus prevent it from happening, at
a future shareholders meeting.
![]() List
of candidates for new buying
List
of candidates for new buying
From within the ranks of TSI
stock selections the best candidates for new buying at this time, listed
in alphabetical order, are:
1) AAU in the low-US$0.60s (last
Friday's closing price: US$0.65)
2) CGT.TO (last Friday's closing
price: C$0.18)
3) ECS.V (last Friday's closing price: C$0.21)
4) PEY.TO (last Friday's closing price: C$4.01)
5) PG.TO near
C$2.00 (last Friday's closing price: C$2.06)
The above list is
limited to five stocks. It sometimes will contain less than five, but it
never will contain more than five regardless of how many stocks are
attractively priced for new buying.
Chart Sources
Charts appearing in today's commentary
are courtesy of:
https://stockcharts.com/
http://www.goldchartsrus.com/
https://www.vanadiumprice.com/