|
-- Weekly Market Update for the Week Commencing 15th August 2005
Big Picture
View
Here is a summary of our big picture
view of the markets. Note that our short-term views may differ from our
big picture view.
Bonds commenced a secular BEAR market in
June of 2003. Bond prices will move considerably lower (long-term
interest rates will move considerably higher) during 2005. (Last
update: 29 November 2004)
The stock market, as represented by the S&P500 Index, commenced a secular BEAR market during the first quarter of 2000. The rally that
began in October of 2002 ended in March of 2005 and the October-2002
bottom (775 for the S&P500) will be tested during 2006. (Last update: 25 April 2005)
The Dollar commenced a secular BEAR market during the final quarter of 2000. The
first major downward leg in this bear market ended during the first
quarter of 2005, but a long-term bottom won't occur until 2008-2010. (Last update: 28 March 2005)
Gold commenced a secular BULL market during 1999-2001. The first major upward leg in this bull market ended in December of 2004, but a long-term
peak won't occur until 2008-2010. (Last update: 28 March 2005)
Commodities, as
represented
by the CRB Index, commenced a secular BULL market in 2001. The first
major upward leg in this bull market ended during the first quarter of
2005, but a long-term
peak won't occur until 2008-2010. (Last update: 28 March 2005)
Copyright
Reminder
The commentaries that appear at TSI
may not be distributed, in full or in part, without our written permission.
In particular, please note that the posting of extracts from TSI commentaries
at other web sites or providing links to TSI commentaries at other web
sites (for example, at discussion boards) without our written permission
is prohibited.
We reserve the right to immediately
terminate the subscription of any TSI subscriber who distributes the TSI
commentaries without our written permission.
Outlook Summary
Market
|
Short-Term
(0-3 month)
|
Intermediate-Term
(3-12 month)
|
Long-Term
(1-5 Year)
|
Gold
|
Neutral
(30-May-05)
|
Neutral
(6-Dec-04)
|
Bullish
|
US$ (Dollar Index)
|
Bullish
(20-Dec-04)
| Bullish
(31-May-04)
|
Bearish
|
Bonds (US T-Bond)
|
Bullish
(15-Aug-05)
|
Neutral
(20-Jul-05)
|
Bearish
|
Stock Market (S&P500)
|
Bearish
(08-Aug-05)
|
Bearish
(05-Jan-05)
|
Bearish
|
Gold Stocks (HUI)
|
Bullish
(03-Aug-05)
|
Bearish
(01-Dec-04)
|
Bullish
|
General Commodities (CRB)
|
Bearish
(23-Mar-05)
|
Bearish
(23-Mar-05)
|
Bullish
|
Notes:
1. In those cases where we have been able to identify the commentary in
which the most recent outlook change occurred we've put the date of the
commentary below the current outlook.
2. "Neutral", in the above table, means that we either don't have a
firm opinion on which way the market will move or that we expect the
market to be trendless during the timeframe in question.
3. Long-term views are determined almost completely by fundamentals,
intermediate-term views by giving an approximately equal weighting to
fundmental and technical factors, and short-term views almost
completely by technicals.
Bonds
With
an upward reversal having just occurred in the bond market at the
approximate time when the bond-oil relationship was projecting an
upward reversal, we have changed our short-term view on bonds from
"bearish" to "bullish" in anticipation of a rally lasting at least 3
months.
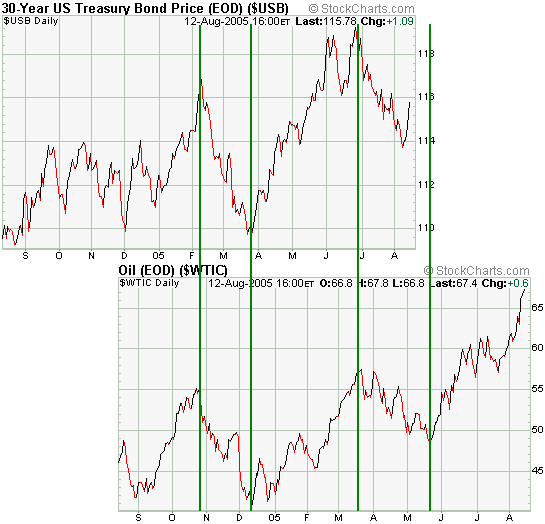
For some reason turning points in the oil market have consistently led
turning points in the US bond market over the past four years by 3-4
months. Furthermore and as illustrated on the below chart, this
relationship has been particularly tight over the past year.
The chart suggests that an upward reversal in the bond market will
occur at the end of this month, so if we were to take the chart
literally we would assume that last week's low in the T-Bond price was
going to be tested or exceeded at some point over the coming fortnight.
That may well turn out to be the case, but it's not reasonable to
expect that a chart such as this will be able to predict a turning
point with such accuracy. Instead, a reasonable interpretation is that
we are into a time window when a short-term trend change in the bond
market (from down to up) is likely to occur.
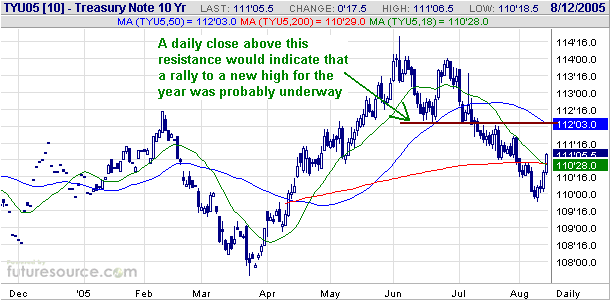
Below is a chart of
September T-Note futures. A daily close above resistance at 112 is
needed to confirm a trend change, but last week's upward reversal looks
significant. Unfortunately, from a risk management perspective, support
lies a considerable distance below the current price (T-Note futures
would need to breach the March low at around 108 in order to negate the
potential for a rally to a new high for the year).
With an upward
reversal having just occurred in the bond market at the approximate
time when the bond-oil relationship was projecting an upward reversal,
we have changed our short-term view on bonds from "bearish" to
"bullish" in anticipation of a rally lasting at least 3 months.
Interestingly, at the same time as the short-term outlook for bonds
appears to be improving the long-term outlook has become more bearish
as a result of last week's upside breakout by Japan's Nikkei225 Index.
We think the Nikkei will move much higher over the next few years, a
view that is consistent with our long-term bearish outlook on bonds due
to the inverse correlation between bonds and the Japanese stock market.
However, the Nikkei looks very extended on a short-term basis so it
will probably soon begin to consolidate its recent gains.
The Stock
Market
The Fed and the Markets
Despite the 10 official rate hikes that have already occurred the Fed
still characterises its monetary stance as "accommodative", which it
undoubtedly is. However, will it remain accommodative?
Stock market bulls are betting that it will, as are gold bulls,
commodity bulls and real estate bulls. Either all of these 'bulls' are
going to be right about Fed policy or they are all going to be wrong.
We think they will be wrong because the Fed will continue to 'push'
until its monetary tightening is clearly taking a toll on the financial
markets.
Current Market Situation
...some additional downside is likely, so we'll remain short-term bearish for now.
Our intermediate-term outlook for the US stock market is becoming
increasingly bearish, but right now there are just too many divergent
signals for us to be able to hold any short-term view with confidence.
For example, the relentless rise in the oil price is a major negative,
but at the same time the stock market's ability to shrug-off each
successive new high in the oil price demonstrates remarkable
resilience. Also, while the recent price action in the US stock market
tips the scales in favour of additional downside over the next 1-2
weeks, the general strength stock markets around the world suggests
that the US market is simply consolidating in preparation for another
advance.
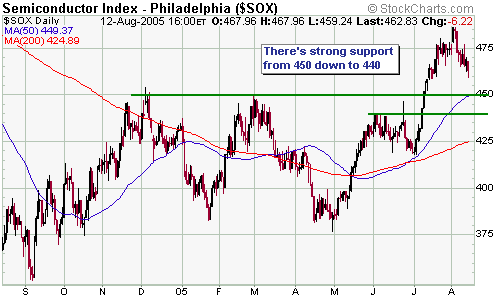
An index that has led the US market to both the downside and the upside
over the past two years is the Semiconductor Index (SOX). The below
chart shows that the SOX has pulled back since the beginning of this
month and is approaching support at 440-450. A daily close below 440
would indicate that an important peak was in place for the SOX and
would be a bearish omen for the overall market. By the same token,
until the SOX is able to close below 440 it will be reasonable to
assume that the current pullback in the market will be followed by a
rally to a new high for the year.
In addition to
monitoring the SOX's performance in absolute terms we will also pay
close attention to how it performs relative to the NASDAQ100 Index
(NDX) over the coming weeks. The reason is that SOX/NDX generally
trends in the same direction as the overall market and leads the market
at important turning points.
The below chart shows a modest downturn in SOX/NDX over the past
fortnight, which is not significant yet but could develop into
something significant.
Over the next two
weeks the market is likely to either extend its decline to the point
where important support levels give way, thus indicating that this
year's peak is in place, or reverse higher without first breaching any
important support levels. In each case some additional downside is
likely, so we'll remain short-term bearish for now.
This week's
important US economic events
| Date |
Description |
Monday Aug 15
| No Significant Events
|
| Tuesday Aug 16
| CPI
Housing Starts
Industrial Production
Capacity Utilisation
| | Wednesday Aug 17
| PPI
| | Thursday Aug 18
| Leading Economic Indicators
|
| Friday Aug 19
| No Significant Events
|
Gold and
the Dollar
Gold Overview
...Genuine
gold bull markets are all about increasing risk aversion and declining
confidence in central banks, but the recent run-up in the gold price
has occurred in an environment where investors, as a group, have
exhibited minimal risk aversion... ...although gold and gold stocks
should be eventual standout beneficiaries of downturns in pro-growth
investments, they are likely to be initial casualties.
There are very few objective observers of the financial scene who are
as bullish on gold, as far as the coming 2-4 years are concerned, as we
are. We not only expect that gold will trade at a multiple of its
current level in US$ terms before the end of this decade, we expect
that it will trade at a multiple of its current level relative to oil,
copper, most other commodities, the S&P500 Index, and the average
home. However, we don't expect great things from gold over the next 3-6
months, especially in US$ terms. This is partly because we think the
US$ rally that began in January is not yet even halfway complete in
terms of either time or price, but there's a lot more to it than that.
The main reason we don't think gold's recent advance is the start of
the next major upward leg in its long-term bull market is that
gold-related investments are rising in price alongside rises in the
prices of almost all other assets. Genuine gold bull markets are all
about increasing risk aversion and declining confidence in central
banks, but the recent run-up in the gold price has occurred in an
environment where investors, as a group, have exhibited minimal risk
aversion and supreme confidence that the Fed will neither overshoot nor
undershoot in its rate-hiking campaign. In particular, inflation
expectations have remained low enough to give bond investors that 'warm
and fuzzy feeling' at the same time as those playing the "inflation
trade" have been having a great time.
Gold trades like money and tends to out-perform other investments when
confidence in the official forms of money is falling, but as a result
of the current widespread perception of a 'goldilocks' economic
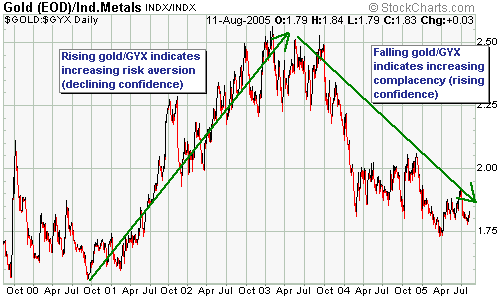
environment gold is not receiving any monetary premium. The below chart
of the gold/GYX ratio (the gold price divided by the Industrial Metals
Index) is evidence of this lack of monetary premium in the current gold
price and the generally low level of risk aversion prevailing today in
the financial markets. Putting it another way, the low price of
counter-cyclical gold relative to the average price of cyclical metals
such as copper, nickel and zinc, tells us that most investors believe
the economic growth to be real (not inflation-induced)*.
That gold is not
receiving a monetary premium does not mean that we shouldn't attempt to
benefit from the current up-swing in the gold price. In fact, anyone
positioned roughly in accordance with the suggestions made at TSI will
have a larger-than-normal cash position and perhaps a small put-option
position, but will also have a sizeable net-long position in gold
stocks and will therefore be benefiting from the current rally. They
won't be benefiting as much as the 'permabulls' who perpetually
maintain a maximum long position in gold, but they also wouldn't have
experienced the large draw-downs suffered earlier this year by the more
rabid of the gold bulls.
The lack of a monetary premium means that the financial markets are
presently not differentiating between gold and other metals
(speculators are jumping into gold as part of a general commodity
play). This, in turn, indicates that regardless of how high prices go
in the short-term the gains will most likely prove to be unsustainable
because something that rallies hard along with everything else will
probably fall hard along with everything else. Therefore, we don't
consider this to be a great time to be INCREASING our overall exposure
to gold stocks. Actually, in order to avoid significantly increasing
our exposure to the gold sector we will have to do some selling if the
rally continues (the recent gains in stock prices have taken the cash
percentage in our own account down to about 40% and in the current
environment we wouldn't want it to get any lower than that).
Gold, in our opinion, will eventually benefit greatly from downturns in
the stock and commodity markets because these downturns will pave the
way for the next inflation cycle. Also, the fact that gold is not
receiving a significant monetary premium and is, therefore, incredibly
cheap right now compared to almost everything else greatly enhances its
longer-term upside potential. However, one of the INITIAL effects of a
sharp downturn in the stock market and/or the commodity market will
most likely be a further decline in inflation expectations and a
consequential rise in REAL interest rates, a negative development for
gold. As a result, although gold and gold stocks should be eventual
standout beneficiaries of downturns in pro-growth investments, they are
likely to be initial casualties.
To summarise the above in one sentence: What we are probably seeing in
the financial markets right now is the end of something (blow-off moves
in the investments that performed well over the past few years), not
the start of something.
*One of the main
reasons cyclical commodities have been able to rally as much as they
have without generating inflation fears is the 'China story'.
Specifically, the link between a currency problem and rising commodity
prices has not been made in the minds of most investors because they
believe that the higher commodity prices can be put down to rapid REAL
growth in China (as opposed to a fall in the relative value of fiat
currencies). However, China's rapid growth has been fueled by a massive
expansion of credit and is no less inflation-induced (no more
sustainable) than the growth achieved by the US economy over recent
years.
Current Market Situation
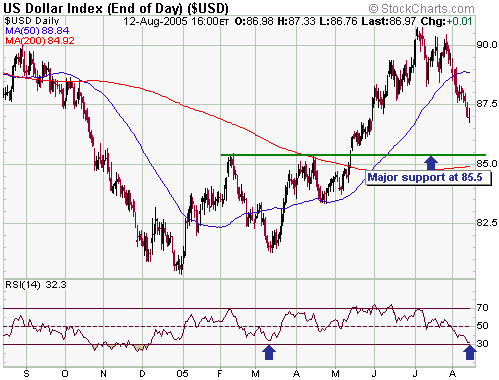
The downside target we've previously mentioned for the current
correction in the Dollar Index is 86.5, which is slightly below
Friday's low. Major support lies a point lower at 85.5 (refer to the
below chart for details). With the US$ now as 'oversold' as it was at
the March low (based on momentum indicators such as the RSI) we expect
it to reverse higher from near its current level or, at worst, to
reverse higher following a drop to test the aforementioned support.
As far as the next few months are concerned we think the Dollar Index
has 1-2 points of downside risk versus 5-8 points of upside potential.
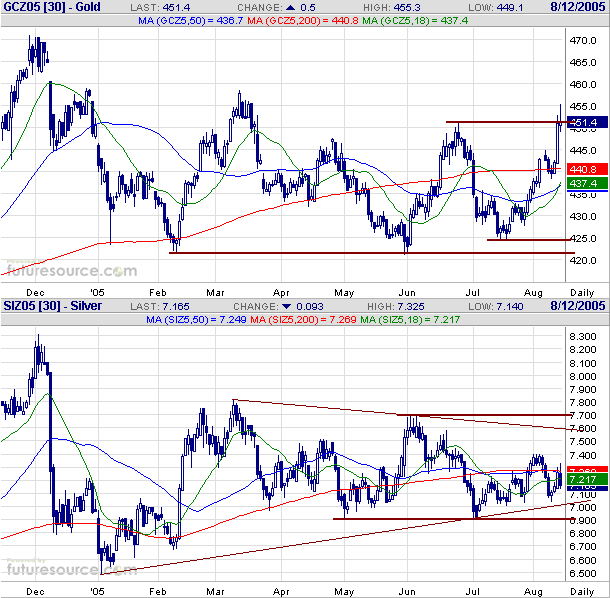
Below are daily charts of December gold futures and December silver futures.
Silver's under-performance relative to gold over the past month has
been quite dramatic, and given that silver has tended to lead gold at
turning points since the beginning of this year the current divergence
between the two metals is bearish. However, despite this bearish
divergence the weight of evidence suggests that the current rally in
the gold price has not yet peaked. In particular, Friday's new recovery
high in the HUI/gold ratio indicates that both the gold price and the
HUI will probably move higher before their respective rallies come to
an end.
We consider the current situation in the gold market to be very risky.
For one thing, gold spiked well above resistance at $451 -- a level
that we did not think would be exceeded in the short-term -- last
Friday before giving up most of its gains and ending the day right at
this resistance. Therefore, the possibility of a failure at $451 still
exists even though the performance of the HUI/gold ratio suggests that
we haven't yet seen the ultimate rebound peak. For another thing, the
gold market is clearly extended on a short-term basis. Lastly, we won't
know for sure until the Commitments of Traders data are reported at the
end of this week but it's likely that commercial traders now have a
larger net-short position (speculators have a larger net-long position)
in COMEX gold futures than they had at the March, April or June peaks
in the gold price. An uncommonly large speculative net-long position in
gold futures will never cause a gold rally to end, but when such a
situation arises it indicates that the downturn following the rally
will probably be steep.
As a result of it having been such as laggard over the past few weeks
silver appears to offer the best risk/reward right now for anyone
wanting to trade the precious metals from the 'long' side. Unlike gold,
silver is presently in the lower half of its trading range and well
below important resistance (important resistance for December silver
lies at $7.60-$7.80). Also, there is good support (at $6.90-$7.00) not
far below Friday's closing price.
Gold Stocks
Price action in the gold sector remains bullish, so although we are
skeptical with regard to the sustainability of recent gains we will
remain short-term bullish.
From a technical perspective Newmont Mining (NEM) is of more interest
to us right now than either the HUI or the XAU because it is closer to
an important support level. NEM has well-defined support at $40 and
should hold above this level during any near-term pullbacks as long as
the up-trend remains intact. In other words, a close below $40 would be
a clear warning that a trend reversal had happened.
Update
on Stock Selections
 American
Bonanza (TSX: BZA), a small exploration-stage gold company, was a
member of the TSI Stocks List during 2002 and 2003. We exited the stock
at a split-adjusted price of C$1.82 in November of 2003 because we
thought it had become relatively expensive. American
Bonanza (TSX: BZA), a small exploration-stage gold company, was a
member of the TSI Stocks List during 2002 and 2003. We exited the stock
at a split-adjusted price of C$1.82 in November of 2003 because we
thought it had become relatively expensive.
We are now going to return BZA to the TSI Stocks List at Friday's
closing price of C$0.435 because a) it has fallen to a level where it
offers very good value in both relative and absolute terms, and b) we
like the chart.
The company owns 3M ounces of gold resources, meaning that with 90M
shares outstanding and at C$0.435 per share this in-ground gold is
being valued by the stock market at only US$11/ounce. What makes the
valuation particularly attractive, though, is that the gold resources
are high-grade and located in parts of the world where the political
risk is low.
The company's main assets are the Copperstone project in Arizona, which
is currently in the feasibility stage and is expected to be producing
gold at the rate of 80K oz/yr by 2007, and the Fenelon project in Quebec. BZA plans to bring its total annual gold production
up to 150K oz/yr by putting Fenelon into production in 2008.
Given the quality of BZA's gold resources, and in particular the high
probability that the above-mentioned projects will be developed into
profitable mining operations over the next three years, we think
US$25-$35 per ounce-in-the-ground would be a reasonable market
valuation for BZA at this stage of its life. Therefore, the stock
appears to have considerable upside potential.
Now, there are always reasons why an under-valued stock is
under-valued, and in BZA's case we think the main reasons are the
general lack of interest in exploration-stage mining companies (many
stocks in this sector of the market are very under-valued right now)
and the fact that BZA's senior managers are 'serial dilutors' (they
have, in the past, issued a lot of new shares at inopportune times and
at large discounts to current market prices, thus severely diluting the
interests of long-term shareholders). Management's poor record in the
area of stock dilution is a longer-term risk, but since the company is
presently cashed-up thanks to a recent equity financing it hopefully
won't be an issue over the next 12 months.
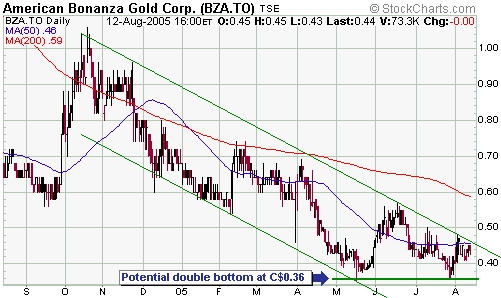
As mentioned above, we also like BZA's chart. Specifically, there are
signs that the stock has 'bottomed out' (the stock bottomed in May and
looks to have successfully tested the May low in July) and it wouldn't
take much to break it out of the downward-sloping channel in which it
has been mired since last October.
 First
Majestic Resource (TSXV: FR) remains our favourite silver stock.
Management's goal is to develop the company into a 10M oz/yr silver
producer by 2007. Importantly, this goal looks realistic taking into
account the company's current asset base (FR owns several
advanced-stage silver projects in Mexico) and management's track record. First
Majestic Resource (TSXV: FR) remains our favourite silver stock.
Management's goal is to develop the company into a 10M oz/yr silver
producer by 2007. Importantly, this goal looks realistic taking into
account the company's current asset base (FR owns several
advanced-stage silver projects in Mexico) and management's track record.
At current metal prices a company with 10M ounces of low-cost annual
silver production (FR's production cost per ounce is expected to be
around US$3.00) would be worth at least US$320M, or about C$11/share
based on FR's current fully-diluted share count of 34M. In order to
finance the development of its various projects the company will have
to issue a lot more shares, but we expect that the positive impact of
gains in the silver price over the next two years will offset the
negative impact of a higher share count.
FR is not the sort of stock that should be bought by a trader looking
to play a short-term rally in the silver price. We think it does,
however, deserve a place in the portfolio of someone who believes that
silver is in a long-term bull market and who can tolerate the
volatility inherent in small-cap mining stocks.
As far as a reasonable entry price for this stock is concerned, over
the past several months we've identified C$1.50-C$2.00 as the range in
which new buying would be appropriate. It's spent much of the past 3
months within this range and actually spiked as low as C$1.65 at the
end of June, so there have been plenty of opportunities to purchase the
stock at attractive levels. We continue to think that the
aforementioned range is a good place to be accumulating this stock (FR
closed at C$1.97 on Friday). Remember, the idea is to scale into
positions over time during periods of weakness.
BTW, Endeavour Silver (TSXV: EDR) appears to be a similar company to FR
in terms of size, assets and strategy, but we know a lot more about FR
and are therefore more comfortable with it.
 De Grey Mining is a small exploration-stage mining company (mostly
gold, but also other metals) that trades in Australia under the symbol
DEG. It's too 'early-stage' to be part of the TSI Stocks List -- we've
made a couple of exceptions in the past, but we usually won't add an
exploration-stage company to the List unless it has already defined a
resource of at least 1M ounces of gold -- but is one that our
Australian-based readers might want to look into.
With reference to the below chart, DEG rocketed higher in late-2003 on
the back of a new gold discovery and has spent much of the past 18
months retracing that move despite the fact that more good drilling
results have been announced in the mean time. The main difference
between DEG at 70c in early 2004 and DEG at 24c today is the attitude
of investors towards exploration-stage gold mining companies (they were
ebullient during the first quarter of 2004 and are disinterested
today).
With about A$9M of cash in the bank and a good exploration team, DEG
looks like a reasonable speculation near its current depressed level.
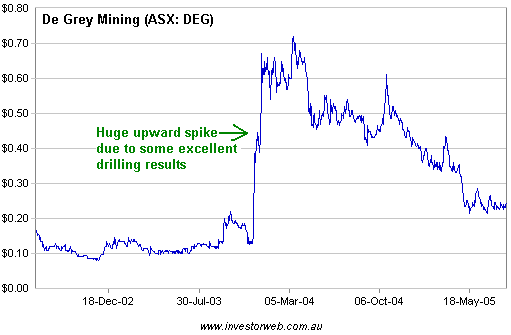
Chart Sources
Charts appearing in today's commentary
are courtesy of:
http://stockcharts.com/index.html
http://www.futuresource.com/

|

