|
-- for the Week Commencing 15th December 2003, 2nd Page
Bonds and
Oil
The bond market sets long-term interest
rates while the Fed controls interest rates at the short end of the curve.
Also, the behaviour of the Fed effects the bond market and the behaviour
of the bond market influences the Fed. For example, if the Fed's monetary
policy is perceived to be too 'easy' then the bond market will begin to
move long-term interest rates higher in anticipation of an inflation problem.
After long-term interest rates have moved higher for a while the Fed usually
gets the message and begins to tighten its monetary policy. As things currently
stand, Greenspan and Co. have expressed a desire to hold the official short-term
interest rate at low levels for a considerable period. But whether or not
they will actually be able to do so will be determined by the behaviour
of the bond market.
Bonds peaked in June, crashed into
an August low, and have since recovered about one-third of their losses.
Our view is that the post-August recovery is a consolidation within a continuing
downward trend, that is, we expect that the next big move will be to the
downside. The below chart shows this consolidation pattern and what we
consider to be the most important short-term support and resistance levels.
A break below the higher of the two support levels shown on the chart (around
105.50) would strongly suggest that our view was correct and would set
the stage for a series of rate hikes by the Fed, while a break above the
resistance level shown on the chart would suggest that something other
than our expected scenario was playing out.
Our interest-rate view received a figurative
kick in the teeth at the end of last week when the oil price broke out
to the upside (see chart below). This is because bonds have, over the past
two years, been following oil with a lag of 3-4 months (refer to the 24th
November Weekly Update for an explanation). In other words, if last Friday's
breakout in oil 'sticks' then we should expect bonds to break upwards out
of their consolidation pattern in March-April of next year.
It is not uncommon for a market to
break above an obvious resistance level only to reverse lower a short time
later. Therefore, to confirm that any breakout is 'real' (sustainable)
we always like to see some follow-through. In oil's case, remaining above
$32.50 (basis the January contract) over the next two weeks would do the
trick. If this happens we would need to re-think our forecasts for long-term
and short-term interest rates.
We speculated, in the aforementioned
commentary, that the reason for the strong positive correlation between
the oil and bond markets over the past 2 years has been that geopolitics
has been the primary driver of the oil price. So, would the positive correlation
remain in effect if the oil price were driven higher by something other
than, for example, instability in an oil-producing region? After all, a
higher oil price could quite easily be explained by a combination of a
weakening US$, Chinese demand, and weather-related concerns.
In the current environment the positive
correlation between oil and bonds probably would remain in effect due to
the falling money-supply growth trend. Let's explain.
A rising oil price is not inflationary
because only money-supply growth can, by definition, be inflationary. Furthermore,
a rising oil price cannot cause the general price level to increase.
In the past, a rising oil price has
often been accompanied by an increase in the general price level. But this
was only possible because the total supply of money was increasing at a
fast enough rate to enable a price rise in one part of the economy (for
example, the energy sector) to push prices upward throughout the economy.
However, in an economy where the total supply of money is constant it is
axiomatic that a price increase somewhere in the economy will be offset
be a price decrease somewhere else.
Another way of saying the above is
that a rising oil price can only appear to have an inflationary effect
if the Fed monetises the price rise. At the present time, though, the money-supply
growth rate is trending strongly lower so the ability of the Fed to monetise
a rise in the price of oil is doubtful. Therefore, the bond market's initial
reaction to a sharp rise in the oil price would probably be a negative
one, but a sharp rise in the oil price at this time would likely have longer-term
bullish implications for bonds.
The bottom line is that the downward
trend in the money-supply growth rate is going to loom even larger if last
week's upside breakout in the oil price 'sticks'.
Natural
Gas
Below is a weekly chart of natural
gas (NG) futures. For the third time since 2000 the NG price is spiking
sharply higher during the December-February period.
The stock market's reaction to the
rising NG price has been subdued. For example, over the past 4 weeks the
NG price has gained 57% while the AMEX Natural Gas Index (XNG) has risen
by 9% and Chesapeake Energy (NYSE: CHK) -- a gas producer with substantial
leverage to the NG price -- has risen by 10%. A gain of 10% in 4 weeks
is not something to be sneezed at, but this gain is in line with the general
increase in commodity-related equities over the same period (the Morgan
Stanley Index of Commodity-Related Equities is up by 7.4% over the past
4 weeks). It seems, therefore, that the stock market expects this latest
spike to end the same way as the previous two.
We like the longer-term fundamentals
for the natural gas sector and expect that a large stock-market decline
over the coming year will create a very good buying opportunity for these
stocks.
Gold and
the Dollar
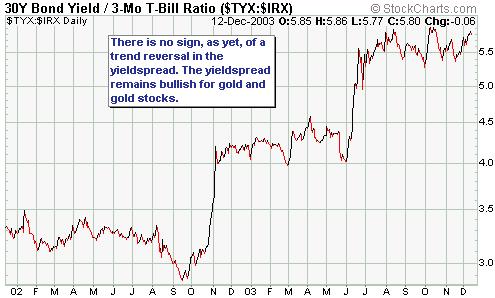
Yield-Spread Update
When long-term interest rates are rising
relative to short-term interest rates it is bullish for gold, and, even
more so, for gold stocks. As the below chart shows, the yield-spread (the
30-year interest rate divided by the 13-week interest rate) has been consolidating
over the past few months but is still close to its highs. This continues
to be a bullish factor for the gold market.
The Commitments of Traders (COT)
Report
The latest COT data are very bullish
for the US$ and are therefore consistent with the idea that the dollar
is close to a short-term bottom. The data, however, are not so lopsided
as to indicate that anything more significant than a 1-2 month dollar rally
is on the cards. That would change, though, if a downward spike in the
Dollar Index to around the 85 level were accompanied by aggressive buying
on the part of commercial traders. In this case a much longer dollar rebound
would likely occur. In other words; if a US$ rebound begins from near the
current level then we would look for it to last 1-2 months, but if the
dollar first drops another 4% or so then the ensuing rebound would likely
be much longer (3-6 months).
The COT data for gold indicate the
potential for additional price gains. We say this because the small traders
-- the 'dumb money' -- have a net-long position that is about 14,000 contracts
smaller than it was in early February despite the fact that the gold price
is now about $30 higher. In other words, the 'dumb money' is now less bullish
than it was it February despite the improved performance of the gold price.
The COT data suggest that gold is either
going to move sharply higher now, or consolidate for a while (in parallel
with a US$ rebound?) before moving sharply higher.
Gold Stocks
The Dow Industrials Index and the S&P500
Index hit new recovery highs at the end of last week, suggesting that gold
stocks are still a few weeks or more from a peak (since gold stocks aren't
likely to peak until some time after the broad market peaks). Last Thursday's
price action, with the HUI dropping sharply to test its 50-day moving average
and then rebounding (see chart below), is consistent with the view that
new highs will be seen over the coming months.
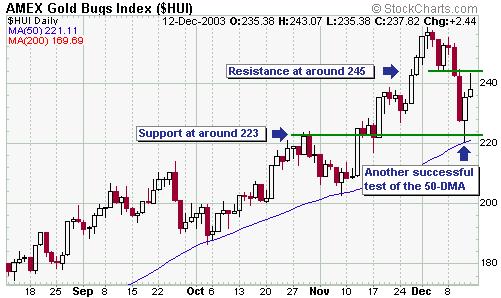
Last Thursday's upward reversal in
the gold sector doesn't mean that the correction is complete. The HUI has
some minor resistance at around 245 and on Friday it reversed lower from
just below this resistance. A daily close above 245 would suggest that
a move to a new high was underway.
By the way, investors in gold stocks
should consider the action over the past two weeks to be a warning shot.
Note, in particular, that the 15% decline in the HUI from its 2nd December
intra-day peak to its 11th December intra-day bottom occurred concurrently
with a marginal INCREASE in the gold price. Based on all the historical
data we have reviewed we expect that the HUI's next intermediate-term peak
will be followed by a fall of 40% or more in the space of 2 months and
that this fall will likely occur in parallel with a rising gold price.
Update
on Stock Selections
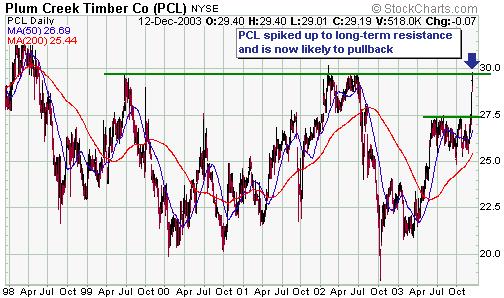
 We
added Plum Creek Timber (NYSE: PCL) to the Stocks List in early November
and since that time the stock price has gained 11% and the company has
paid a 35c dividend. PCL is one way for conservative investors -- people
who might be put off by the huge volatility in many of our junior resource
stocks -- to play the bull market in commodities. Timber is actually one
of the safest and best long-term investments because depletion isn't a
problem (assuming the resource is well managed) and it grows (literally). We
added Plum Creek Timber (NYSE: PCL) to the Stocks List in early November
and since that time the stock price has gained 11% and the company has
paid a 35c dividend. PCL is one way for conservative investors -- people
who might be put off by the huge volatility in many of our junior resource
stocks -- to play the bull market in commodities. Timber is actually one
of the safest and best long-term investments because depletion isn't a
problem (assuming the resource is well managed) and it grows (literally).
In the short-term there's a good chance
that the PCL stock price will pullback because it has just moved up to
a level at which substantial resistance will probably be encountered (see
chart below). It would, however, be a low-risk buy on a drop to around
27.50. We expect that PCL will trade up to $40 within the next 18 months.
Argentine
agricultural company Cresud (NASDAQ: CRESY) is another reasonably conservative
commodity play, although the stock price has been quite volatile over the
past two months. CRESY, we think, will benefit from the fact that there
are very few ways for stock market investors to gain exposure to grains
and cattle.
We think CRESY is a 'hold' at Friday's
closing price of $13.85 and would be suitable for new buying below $11.
As
mentioned earlier in today's commentary, a position in USPIX (ProFunds
UltraShort OTC Fund) has been added to the Stocks List. USPIX is quite
risky, but it does have two significant advantages over put options. First,
time decay is not a problem with USPIX as it is with any out-of-the-money
option (all else being equal, the market value of an option will fall over
time). Second, active risk management -- for example, making an exit if
the market moves against you -- is more feasible with an inverse fund such
as USPIX than it is with an option (if you buy an option that is well out
of the money, by the time you realise you've made a mistake there probably
won't be much value left to salvage).
Metallica
Resources (AMEX: MRB) has completed a major equity financing. It now has
C$85M in cash and therefore has more than enough money to take its Cerro
San Pedro project -- a gold/silver project in Mexico -- through to production.
Cerro San Pedro is scheduled to be in production by the end of next year
and is forecast to produce 120,000 gold-equivalent ounces per year.
In addition to Cerro San Pedro MRB
owns the El Morro porphyry copper-gold project in Chile (Noranda has a
right to earn a 70% interest in this project). El Morro has an inferred
resource of 6.2B pounds copper and 7.4M ounces gold and provides some 'blue
sky' potential for MRB shareholders.
With the financing out of the way MRB
is a lower risk speculation and is suitable for new buying at around US$1.50.
Chart Sources
Charts appearing in today's commentary
are courtesy of:
http://stockcharts.com/index.html
http://www.futuresource.com/

|
