|
-- Weekly Market Update for the Week Commencing 15th December 2008
Big Picture
View
Here is a summary of our big picture
view of the markets. Note that our short-term views may differ from our
big picture view.
Bonds commenced a secular BEAR market in
June of 2003. (Last
update: 22 August 2005)
The stock market, as represented by the S&P500 Index, commenced
a secular BEAR market during the first quarter of 2000, where "secular
bear market" is defined as a long-term downward trend in valuations
(P/E ratios, etc.) and gold-denominated prices. This secular trend will bottom sometime between 2014 and 2020. (Last update: 22 October 2007)
The Dollar commenced a secular BEAR market during the final quarter of 2000. The
first major downward leg in this bear market ended during the first
quarter of 2005, but a long-term bottom won't occur until 2008-2010. (Last update: 28 March 2005)
Gold commenced a
secular bull market relative to all fiat currencies, the CRB Index,
bonds and most stock market indices during 1999-2001. This secular trend will peak sometime between 2014 and 2020. (Last update: 22 October 2007)
Commodities, as
represented
by the CRB Index, commenced a secular BULL market in 2001. The first
major upward leg in this bull market ended during the first half of 2008, but a long-term
peak won't occur until 2014-2020. (Last update: 03 November 2008)
Copyright
Reminder
The commentaries that appear at TSI
may not be distributed, in full or in part, without our written permission.
In particular, please note that the posting of extracts from TSI commentaries
at other web sites or providing links to TSI commentaries at other web
sites (for example, at discussion boards) without our written permission
is prohibited.
We reserve the right to immediately
terminate the subscription of any TSI subscriber who distributes the TSI
commentaries without our written permission.
Outlook Summary
Market
|
Short-Term
(0-3 month)
|
Intermediate-Term
(3-12 month)
|
Long-Term
(1-5 Year)
|
Gold
|
Bullish
(30-Jun-08)
|
Bullish
(12-May-08)
|
Bullish
|
US$ (Dollar Index)
|
Bearish
(17-Nov-08)
| Bearish
(24-Nov-08)
|
Neutral
(19-Sep-07)
|
Bonds (US T-Bond)
|
Bearish
(21-Nov-08)
|
Bearish
(22-Sep-08)
|
Bearish
|
Stock Market (S&P500)
|
Bullish
(16-Oct-08)
|
Bullish
(08-Oct-08)
|
Bearish
|
Gold Stocks (HUI)
|
Bullish
(30-Jun-08)
|
Bullish
(12-May-08)
|
Bullish
|
| Oil | Bullish
(17-Nov-08)
| Neutral
(22-Sep-08)
| Bullish
|
Industrial Metals (GYX)
| Bullish
(26-Nov-08)
| Neutral
(22-Sep-08)
| Bullish
|
Notes:
1. In those cases where we have been able to identify the commentary in
which the most recent outlook change occurred we've put the date of the
commentary below the current outlook.
2. "Neutral", in the above table, means that we either don't have a
firm opinion or that we think risk and reward are roughly in balance with respect to the timeframe in question.
3. Long-term views are determined almost completely by fundamentals,
intermediate-term views by giving an approximately equal weighting to
fundmental and technical factors, and short-term views almost
completely by technicals.
The next bubble to burst
When a market's upward trend
is consistent with an existing opinion the market will not be viewed as
being in a bubble by the holder of the opinion, regardless of how far
the price moves outside the bounds of normal valuation. For example,
true believers in the idea that "Peak Oil" was creating a long-term
irreversible shortage were not open to the possibility that the oil
market was in 'bubble territory' earlier this year. Similarly,
enthusiastic supporters of the idea that the world is now experiencing,
and will continue to experience, deflation are quick to dismiss the
possibility that the bond market could be just another in a long line
of bubbles. They are quick to dismiss this possibility because a sharp
increase in the bond price (a sharp decline in the bond yield)
validates their existing beliefs.
The huge and almost uninterrupted run-up in the T-Bond price began at
the start of November and has been accompanied by a $100/oz rise in the
gold price and a 30% rise in the AMEX Gold BUGS Index, so unless
deflation has suddenly become good for gold and very good for gold
stocks it is reasonable to assume that the bond market is NOT
discounting deflation. But even if it is discounting deflation it
doesn't mean that deflation is actually occurring or is likely to occur
in the near future. The reason is that markets can be wrong, especially
when they 'go parabolic'. What, for instance, was the NASDAQ
discounting when it shot up to 5000 in March of 2000? And what was the
oil market discounting when it surged above $140/barrel just 5 months
ago?
What, then, makes the deflation forecasters so sure that the bond
market is right when other markets that have experienced similar upside
blow-offs proved to be less than prescient?
The one thing that makes them sure is that the bond market's price
action confirms their existing beliefs. As a result of the recent bond
market moon-shot the deflationists are as confident today as the oil
bulls were in July of 2008 and the tech bulls were in March of 2000.
One of the interesting aspects of the current situation is that even if
the deflationists are right the Treasury market has become so
over-priced that it is potentially still an accident waiting to happen.
We say this because the yield on the long bond is already near the lows
reached in the midst of great deflation of the early 1930s. Moreover,
shortly after the yield on long-dated US Government bonds dropped to
near today's ultra-low levels in 1931 there was a large multi-month
decline in the bond price and rise in the bond yield. And this was
despite the fact that bonds were, at that time, denominated in a
currency that was convertible into gold at a fixed rate.
The point we are trying to make is that there is substantial downside
risk in the T-Bond price right now regardless of what the market is
discounting. Given that bonds have been rallying with gold and gold
stocks it is likely that the bond market is expecting the Fed to start
targeting long-term interest rates via large-scale debt monetisation.
In other words, the bond market has probably been rallying in
anticipation of additional monetary INFLATION. If the Fed announces
such a scheme then the bond yield will likely remain near its current
depressed level or move even lower (depending on the Fed's target), but
if the Fed does not announce some form of artificial support then
there's a good chance that the T-Bond price will plunge.
The Fed
According to the Fed Funds futures, the market expects the Fed to cut
its targeted short-term interest rate by either 0.75% or 1.00% at this
week's FOMC Meeting. Such a cut would take the official target to
either 0.25% or ZERO.
Anyhow, the size of the impending cut in the Fed Funds rate target is
of less interest to us than the potential for some innovative or
unusual monetary policies to come out of this meeting. One possibility
worth considering is that the Fed will announce a new policy to target
LONG-TERM interest rates. As noted above and also in the 3rd December
Interim Update, this could be what the bond market has been
anticipating. Another potential new policy is one that gives the Fed
the option of issuing its own debt securities.
The Fed can create an unlimited amount of new money, so why would it
ever need to issue its own debt? As far as we can tell, the only reason
for doing so would be to 'soak up' some of the money it had previously
injected into the system. In other words, in paving the way to issue
its own debt the Fed would be preparing for the time when inflation is
again perceived to be "public enemy number one". In the past the Fed
has removed money from the banking system by selling US Treasury
securities to the banks, but the amount of Treasury securities owned by
the Fed is now small -- and getting even smaller by the day -- relative
to the amount of money it will probably have to 'soak up' at some point
in the future. It appears, therefore, that the Fed needs a new
'liquidity draining' method.
Being able to issue its own debt would give the Fed greater leeway to
create new money now by giving it greater ability to withdraw money in
the future, although it will probably be a long time before the Fed
becomes sufficiently concerned about inflation that it starts
withdrawing money from the economy. Moreover, by the time the Fed
begins taking decisive action to quell inflation an inflation problem
will almost certainly be 'baked into the cake'. This is because the Fed
relies on inflation indicators that are inherently unreliable and have
multi-year lags.
The Stock
Market
Near the ends of the previous
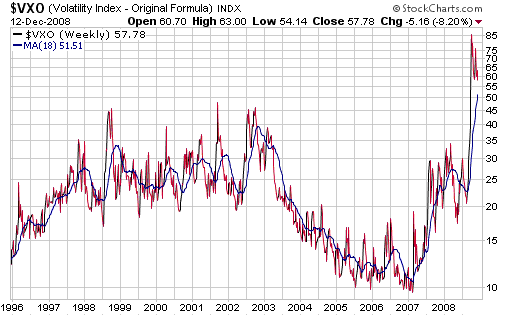
major stock market declines of the past few decades the OEX Volatility
Index (VXO) has tended to spike up to the 45-50 range and then quickly
drop back to a more normal level. However, the following weekly chart
shows that about 3 months ago the VXO moved well above the range that
had previously marked volatility peaks, and stayed there. As far as we
know, the only other time that the US stock market's volatility
remained at such a high level for such an extended period was during
the 1929-1932 debacle. We take this as a warning sign that if the stock
market rebounds over the coming months it will very likely be a
counter-trend move and will not point to better times ahead for the
economy.
The US stock market
bottomed on 10th October. After a brief rebound the senior indices then
made lower lows in late November, but these lower price lows were not
confirmed by momentum indicators and most market 'internals'. It has
since been building a base that should lead to some interesting upside
over the coming few months.
This week's
important US economic events
| Date |
Description |
Monday Dec 15
| Net foreign purchases of US securities
Capacity Utilisation
Industrial Production
| | Tuesday Dec 16 | FOMC Policy Statement
CPI
Housing Starts
| | Wednesday Dec 17
| No important events scheduled
| | Thursday Dec 18
| Leading Economic Indicators
| | Friday Dec 19
| No important events scheduled
|
Gold and
the Dollar
Gold
The Yield Spread
The yield spread is one of several drivers of the gold price. When the
yield spread is widening, that is, when long-term interest rates are
rising relative to short-term interest rates, gold tends to do well
relative to other commodities and investments. Another way of putting
it is that gold tends to do relatively well when the yield curve is
'steepening'. The reason is that a 'steepening' yield curve normally
goes hand-in-hand with either contracting financial-market liquidity
(usually associated with short-term interest rates falling faster than
long-term interest rates, such as the situation over the past 18
months) or rising inflation expectations (usually associated with
long-term interest rates rising faster than short-term interest rates).
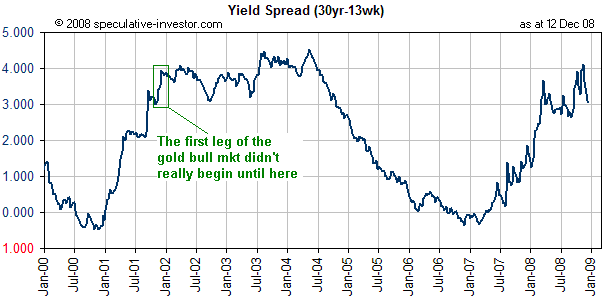
The following weekly chart shows the performance of the yield spread
since January of 2000. In this case the yield spread is the difference
between the 30-year T-Bond yield and the 13-week T-Bill yield. Note
that in the past we have often shown the yield spread as a ratio rather
than a difference, but ratios don't work when the denominator is zero
or close to zero.
There are three points we'd like to make with regard to the yield spread's current situation.
First, although the gold price hit its bear-market bottom in April of
2001 the first leg of gold's long-term bull market didn't really get
going until the final quarter of 2001. That is, the first leg of gold's
long-term bull market only got going after the yield spread had risen
to the 3%-4% range, which is where it has been over the past couple of
months.
Second, with the T-Bill yield now at zero the only way to get a further
widening of the yield spread is for the T-Bond yield to rise.
Third, a decision by the Fed to peg the T-Bond yield at or below its
current level would prevent the yield spread from widening any further.
This would not, however, be bearish for gold because the yield spread
is already wide and because the only way the Fed could keep the T-Bond
yield at an artificially low level would be via monetary inflation.
Current Market Situation
Due to the potential importance of Tuesday's monetary policy statement, this should be an interesting week in the gold market.
It is probably now too late to take a trading position in gold in
anticipation of Tuesday's event because last week's $60 rise removed a
significant chunk of the near-term upside potential. Instead, we think
it will be prudent for traders to take some money off the table IF gold
spikes upward during the hours/days following this week's main event.
As noted in earlier commentaries, resistance at $850-$870 would be a
reasonable price range in which to take some gains. Above that lies the
more important resistance at $920. A decisive move above $920 would
break the sequence of declining tops dating back to the March-2008 peak
and signal an end to the correction.
News-related fluctuations, such as whatever the gold market does in
response to the Fed's monetary policy statement, should be irrelevant
to longer-term investors.
Lastly, there is considerable internet chatter about a potential
squeeze in the gold market related to December deliveries at the COMEX.
We won't mind if the COMEX short-sellers get squeezed because we are,
after all, positioned for a higher gold price, but this is not
something we would count on or trade on.
Silver
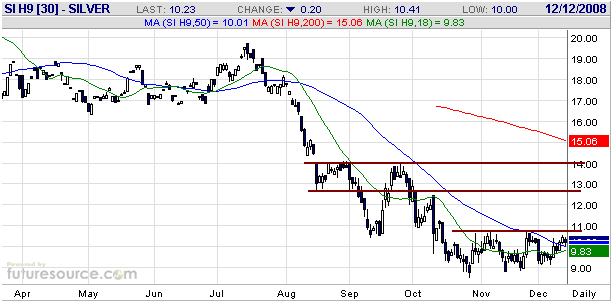
With reference to the following daily chart of the March contract,
silver is basing below $11. A break above resistance at $10.80-$11.00
will probably soon occur, after which resistance at $12.80-$14.00 will
become a reasonable upside objective.
By the way,
backwardation in the silver market would not have the same significance
as backwardation in the gold market because silver is at least as much
an industrial metal as a monetary metal.
Gold Stocks
Gold versus other investments and commodities
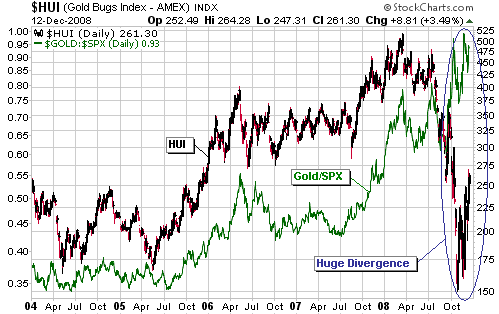
One of the most important gold-stock drivers is gold's performance
relative to the broad stock market, as measured by the gold/SPX ratio.
The following chart, for example, shows that the HUI and the gold/SPX
ratio trended together over the past 5 years, with divergences usually
being quickly eliminated. At least, that was the case until about 4
months ago when a huge divergence began to develop thanks to the HUI
plunging at the same time as gold/GYX was rising.
If the broad stock market does what we currently expect it to do and
rebounds over the next few months then a multi-month period of
consolidation is probably on the cards for the gold/SPX ratio. However,
because the HUI is so far below where it SHOULD be based on the current
value of gold/SPX, some short-term weakness in gold relative to the
broad stock market shouldn't prevent the gold sector from maintaining
an upward bias.
As noted in our 26th
November and 1st December commentaries, it is reasonable to expect that
gold will also consolidate for a few months relative to industrial
commodities such as oil and the base metals. Quite simply, gold's
recent near-vertical rises relative to other commodities will most
likely have to be 'corrected' over the months ahead. However, some
short-term weakness in gold relative to other commodities, which would,
by the way, be more likely to arise from strength in other commodities
than weakness in gold, should again not prevent the gold sector from
maintaining an upward bias. This is because current gold-stock prices
are yet to reflect the substantial improvement in gold-mining profit
margins that will stem from the dramatic relative strength exhibited by
gold over the past few months.
Current Market Situation
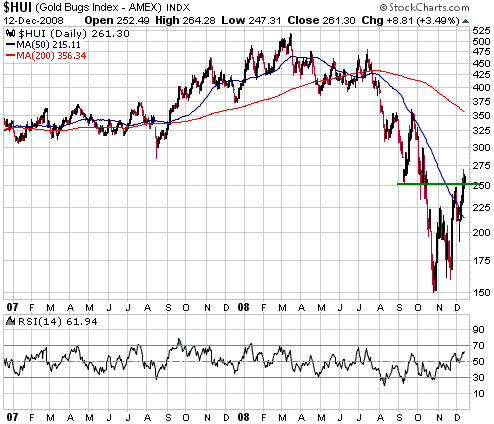
A daily chart of the HUI is displayed below.
As is the case with many other stock indices, a reasonable 2-4 month
upside target for the HUI is the 200-day moving average. But as we see
it, the difference is that the HUI's rebound to near its 200-day MA
would be part of a new multi-year bull market, whereas rebounds by most
other US stock indices to near their 200-day moving averages would be
counter-trend moves (rebounds within on-going bear markets).
If the HUI were to spike up to the high-200s this week it would, we think, present a short-term selling opportunity.
Regular TSI readers
would know that we use Royal Gold (RGLD) as a proxy for the overall
gold sector. As a gold-focused royalty company RGLD is largely
unaffected by changes in mining costs and is thus a pure play on the
gold price.
As evidenced by the following daily chart, RGLD has been in correction
mode since early 2006 and is currently testing the top of its 3-year
trading range. Consecutive daily closes above $41 would constitute an
upside breakout for RGLD and would be a bullish intermediate-term omen
for the overall sector.

The Juniors
The TSX Venture Composite Index (CDNX) has barely moved off its low,
but some microcap gold stocks have begun to show signs of life. For
example, Gold-Ore Resources (TSXV: GOZ) broke out from a basing
formation and surged to a 2-month high last week. The stock is still
ridiculously cheap, though, as it is now producing gold at the
annualised rate of 43K ounces in a politically secure location and yet
has a market cap of only US$16M.
As we get closer to year-end the effects of tax-related selling will
become less significant and the smallest gold/silver stocks should
begin to perform better. Therefore, if the HUI moves up to the
high-200s at some point over the coming week it might make sense, for
those who can handle the risk and the lack of liquidity, to shift some
money out of the larger/more-liquid stocks with the aim of accumulating
a batch of microcaps during the final 1-2 weeks of the year. We will
identify specific buying opportunities when we see them, but we expect
that over the coming three months most of our 'minnows' will achieve
large percentage gains from their current ultra-depressed levels.
At the moment, the following microcaps look particularly interesting on
both a short- and intermediate-term basis: ADM.V, ATW.V, FVI.V, GOZ.V,
KGN.V and USA.V.
Currency Market Update
Short-term pullbacks in the Dollar Index that occur within
intermediate-term upward trends will often find support near the 50-day
moving average. For example, the following daily chart shows that the
September pullback ended at the 50-day moving average. Therefore, last
week's decisive break below the aforementioned moving average is
evidence that an intermediate-term decline is in progress.
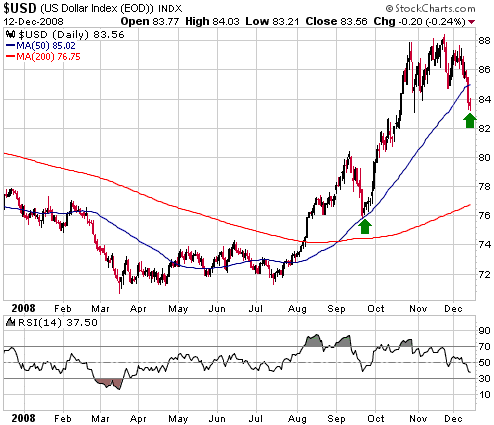
The Dollar Index is
probably headed to the low-80s (80-82) and will potentially even test
its 2008 low during the first half of next year. However, it is
becoming oversold on a short-term basis. Be aware that an extension of
the decline over the coming week could create a low that holds for a
few weeks.
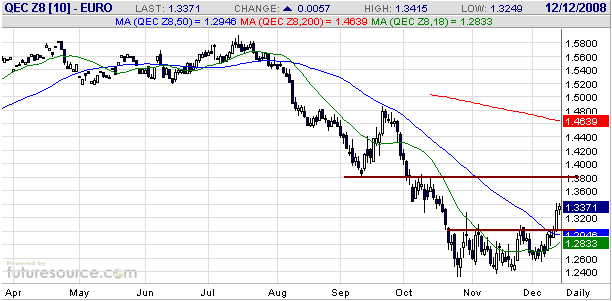
The likely downside target of 80-82 for the Dollar Index roughly
corresponds to resistance at 1.38 for the euro (refer to the following
daily chart for details).
In the 3rd December Interim Update we suggested that short-term traders
buy the euro at 1.27 or lower in anticipation of an upside breakout.
The anticipated breakout occurred last week, opening up the possibility
that the euro will trade as high as 1.38 in the near future. Our
current suggestion is that traders employ a fairly tight 'stop' to
protect existing profits and take gains if the euro moves above 1.37
over the coming fortnight.
As far as the next
2-4 months are concerned the currency trades that we think have the
best risk/reward are long-A$ and short-Yen. The A$ has been driven
downward over the past few months by de-leveraging and the associated
declines in equity and commodity prices, whereas the Yen has been
driven upward by the same forces. Based on our expectations that
counter-trend rebounds in equities and commodities will unfold over the
next few months we should be entering a period in which the A$ is
relatively strong and the Yen is relatively weak. Furthermore, recent
price action has been consistent with the idea that the A$ is bottoming
and the Yen is peaking.
With reference to the following daily chart, a break above the top of
the A$'s base formation (0.70) would create an upside target of 0.78.
Update
on Stock Selections
(Note: To review the complete list of current TSI stock selections, logon at http://www.speculative-investor.com/new/market_logon.asp
and then click on "Stock Selections" in the menu. When at the Stock
Selections page, click on a stock's symbol to bring-up an archive of our comments on the stock in question)
 Time to buy Sprott Time to buy Sprott
At their current prices two of the Sprott funds that trade on the TSX
provide investors with a relatively low-risk way of gaining exposure to
the high-risk world of junior resource companies. Both funds are not
only trading a long way below their respective NAVs (net asset values),
they are currently trading below their net cash values. In other words,
buyers at current prices are paying LESS THAN ZERO for the equity
investments held by the funds and the investing expertise of the Sprott
team. As we occasionally point out, the stock market is NOT efficient.
The first fund we'll highlight is Sprott Resource Corp. (TSX: SCP). SCP
has 84M shares outstanding and, as per our calculations, a net asset
value of about C$290M (C$3.45/share). Furthermore, we estimate that the
company has about $290M (C$3.45/share) of cash (it has about $290M of
cash plus about $50M of equity investments less about $50M of
liabilities).
SCP is in the fortunate position of being cashed up at what should turn
out to be the bottom of the cycle for junior resource stocks. The
company is well positioned to take advantage of the current market
situation and investors who buy near Friday's closing price of C$1.89
are getting the added benefit of being able to buy dollars for around
55c.
We have decided to add SCP to the TSI Stocks List.
The second Sprott fund we'll highlight is Sprott Molybdenum
Participation Corporation (TSX: MLY), "an investment holding company
created to invest in securities of private and public companies that
explore for, mine and/or process molybdenum". As at 5th December MLY
had a net asset value of C$1.74/share, including net cash of
C$1.31/share. It closed at C$1.25 on Friday.
We aren't interested in adding MLY to the TSI List at its current
price, but we may become interested if it drops below C$1 at some point
over the next few weeks.
 Precision Drilling Trust (NYSE: PDS, TSX: PD.UN). Shares: 126M. Recent price: US$6.66 Precision Drilling Trust (NYSE: PDS, TSX: PD.UN). Shares: 126M. Recent price: US$6.66
PDS announced some unexpected bad news last Thursday. About 4 months
ago PDS agreed to purchase Grey Wolf, a US-based drilling company, for
a combination of stock and cash. The merger seemed to be proceeding as
planned, with the last remaining hurdle being a meeting of Grey Wolf
shareholders on 23rd December. However, last Thursday PDS announced
that there had been a substantial increase in the cost of the merger's
debt financing. It was surprising to us that PDS's management had
proceeded this far along the merger path without locking down the terms
of the required financing. It was particularly surprising given that
just one week earlier PDS had confirmed that its lenders had committed
to provide the funds required to complete the merger.
The increased cost of the debt means that PDS will have to focus more
intently on debt reduction after the merger is completed, which could
lead to the reduction or suspension of its monthly distribution. On the
positive side of the ledger, last week's negative surprise didn't push
the stock price to a new low and the stock now trades at only 3-4 times
earnings.
We think PDS has huge upside potential at its current price and for
this reason it will remain in the TSI List, but obviously the stock
will now have less appeal for investors looking for steady distribution
income (assuming that the distribution is, in fact, cut or suspended).
Chart Sources
Charts appearing in today's commentary
are courtesy of:
http://stockcharts.com/index.html
http://www.futuresource.com/

|

