|
-- Weekly Market Update for the Week Commencing 16th January 2012
Big Picture
View
Here is a summary of our big picture
view of the markets. Note that our short-term views may differ from our
big picture view.
In nominal dollar terms, the BULL market in US Treasury Bonds
that began in the early 1980s ended in December of 2008. In real (gold)
terms, bonds commenced a secular BEAR market in 2001 that will continue
until 2014-2020. (Last
update: 4 April 2011)
The stock market, as represented by the S&P500 Index, commenced
a secular BEAR market during the first quarter of 2000, where "secular
bear market" is defined as a long-term downward trend in valuations
(P/E ratios, etc.) and gold-denominated prices. This secular trend will bottom sometime between 2014 and 2020. (Last update: 22 October 2007)
A secular BEAR market in the Dollar
began during the final quarter of 2000 and ended in July of 2008. This
secular bear market will be followed by a multi-year period of range
trading. (Last
update: 09 February 2009)
Gold commenced a
secular bull market relative to all fiat currencies, the CRB Index,
bonds and most stock market indices during 1999-2001. This secular trend will peak sometime between 2014 and 2020. (Last update: 22 October 2007)
Commodities,
as represented by the Continuous Commodity Index (CCI), commenced a
secular BULL market in 2001 in nominal dollar terms. The first major
upward leg in this bull market ended during the first half of 2008, but
a long-term peak won't occur until 2014-2020. In real (gold) terms,
commodities commenced a secular BEAR market in 2001 that will continue
until 2014-2020. (Last
update: 09 February 2009)
Copyright
Reminder
The commentaries that appear at TSI
may not be distributed, in full or in part, without our written permission.
In particular, please note that the posting of extracts from TSI commentaries
at other web sites or providing links to TSI commentaries at other web
sites (for example, at discussion boards) without our written permission
is prohibited.
We reserve the right to immediately
terminate the subscription of any TSI subscriber who distributes the TSI
commentaries without our written permission.
Outlook Summary
Market
|
Short-Term
(0-3 month)
|
Intermediate-Term
(3-12 month)
|
Long-Term
(1-5 Year)
|
| Gold
|
Bullish
(14-Dec-11)
|
Neutral
(24-Jan-11)
|
Bullish
|
| US$ (Dollar Index)
|
Neutral
(22-Nov-11)
| Neutral
(09-Jan-12)
|
Neutral
(19-Sep-07)
|
| Bonds (US T-Bond)
|
Neutral
(19-Sep-11)
|
Bearish
(24-Aug-11)
|
Bearish
|
| Stock Market (S&P500)
|
Neutral
(22-Nov-11)
|
Bearish
(28-Nov-11)
|
Bearish
|
| Gold Stocks
(HUI)
|
Bullish
(28-Dec-11)
|
Bullish
(23-Jun-10)
|
Bullish
|
| Oil | Neutral
(31-Jan-11) | Neutral
(31-Jan-11)
| Bullish
|
| Industrial Metals
(GYX)
| Neutral
(22-Nov-11)
| Neutral
(29-Aug-11)
| Neutral
(11-Jan-10)
|
Notes:
1. In those cases where we have been able to identify the commentary in
which the most recent outlook change occurred we've put the date of the
commentary below the current outlook.
2. "Neutral", in the above table, means that we either don't have a
firm opinion or that we think risk and reward are roughly in balance with respect to the timeframe in question.
3. Long-term views are determined almost completely by fundamentals,
intermediate-term views by giving an approximately equal weighting to
fundamental and technical factors, and short-term views almost
completely by technicals.
The elephant in the room
Here is an excerpt from an email we received last week from a long-time subscriber. The comments in this excerpt explain, in an interesting way, one of the major challenges facing investors at this time.
"It's been five years now that we've been living with the burst of a credit and leverage bubble as big as the world itself. This massive, threatening cloud has been coming at us steadily, and in the fall of 2008 gave us a taste of what it can really do. That's the elephant in the room -- constantly, always. It's as though everything else we used to look at -- technicals, stock fundamentals, parameter relationships -- is now somewhat diminished by that elephant and where it'll plant its next foot, squishing everything underneath. I read as many articles today as I did five years ago, but I find myself reading them faster, skipping paragraphs. I still take notes on a revolving spreadsheet for TSI Updates and Chartworks -- which I often refer to later for refreshment when making a portfolio decision -- but in the past year my synopsis writing has withered. I read John Mauldin and 'Over My Shoulder' articles, but seldom take notes now; and same with David Rosenberg. The clouds are getting thicker, darker. Got that. I notice that Bob Hoye's Pivotal Events is down to 3-4 pages now perhaps three times a month from 5-7 pages. Maybe Bob feels the same way. I find myself skimming Jim Grant's bi-monthly letters -- been there, saw that. I'm almost certain that there are times now when Steve Saville sits down to write an Update and wonders if he should just say something like "The elephant continues to come this way, wandering through Europe right now, but can swim oceans in a matter of minutes, and yes I still think governments will print enough paper to keep deflation in the 1930's closet" -- and push the send button and hit the beach. I've asked myself several times if I'm becoming less interested in the markets and economy than I was five years ago. And I think the answer is no. It is still a panoramic window into the state of the human condition and where it's going. Am I getting angry? I'm a little old for that, but rueful yes: looking at all those young people attending classes in college or university believing they'll do just as well or better than their parents. Well in the end they might, but only after getting toughened up with much harder times in the next decade than their parents ever had."
We expect that there will be a lot more inflation -- the monetary kind and the price kind -- over the years ahead, but it is probably fair to characterise our views on the inflation/deflation issue as lying somewhere between the typical views of those who reside in the inflation camp and those who reside in the deflation camp. Unlike most of the analysts who are forecasting a lot more inflation, we believe that a secular contraction in private-sector credit (the "elephant" mentioned above) commenced during 2007-2008. This differentiates us, because most of the people who expect a lot more inflation appear to believe that due to the huge volume of excess bank reserves it's just a matter of time until another private-sector borrowing boom gets underway.
Most of the analysts forecasting deflation are correct to believe that a secular contraction in private-sector credit is in its infancy, but incorrect when they argue that the central bank will be unable to create monetary and/or price inflation in parallel with a reduction in the private sector's total indebtedness. This argument has already been conclusively disproved by the events of the past four years (despite the contraction in private lending/borrowing, the US central bank has engineered a large rise in the money supply that has pushed some prices substantially higher and led to a significant reduction in the dollar's purchasing power), but some analysts still cling to it.
Most believers in a deflationary outcome also incorrectly conflate credit and money, meaning that they make the wrong assumption that the effects of an expansion in the supply of money can be offset by a contraction in the supply of credit*. This could only ever be the case on a short-term basis due to a temporary increase in the demand for money. Over the long-term, the change in the purchasing power of money is determined by the change in the supply of money and the change in the supply of goods and services. A change in the supply of credit is not relevant to the economy-wide purchasing power of money except to the extent that it causes a change in the supply of money.
*Note that up until now the private sector de-levering trend that began in 2007-2008 has not led to a contraction in the total supply of credit in the US economy. The reason is that government indebtedness has grown by more than private indebtedness has shrunk. However, some supporters of the deflation case get around this inconvenient truth by claiming that the total supply of credit must be marked to market. They claim that the total supply of credit can be seen to have fallen when all credit is marked to market.
Managing the risk of
stockbroker failure
We have previously recommended that investors mitigate brokerage and general financial institution risk by spreading their assets across multiple brokers/banks in multiple countries. This method should be effective unless there is a total systemic breakdown.
If for some reason it is difficult for you to spread your assets across multiple institutions or if you want to take additional precautions you should consider the more secure method of share ownership explained in a report called "BulletProof Shares". This report includes:
1. Detailed descriptions of all three share ownership methods (two of which your broker will not tell you about)
2. Risk ratings for each of the three share ownership methods
3. Counter-party risk diagrams
4. How-to instructions for all share ownership methods
5. Detailed instructions for two share ownership methods that de-risk your shares and sever them from the financial system
6. Tips on getting around unhelpful broker dealers
7. Recommendations for two brokers who offer alternative share ownership at no additional cost
8. Instructions for both domestic and foreign investors seeking alternative forms of share ownership
9. Resources for investors looking to protect stock investments held within 401ks and IRAs
10. A list of resources to help you get started in protecting your stock portfolio
The report can be ordered at http://ss.bulletproofshares.com. (Note: The first 75% of the afore-linked page is marketing spiel, which you could skip if pressed for time. The "Order" button is at the bottom of the page. Also, there is a "Commonly Asked Questions" section near the bottom of the page that could be of interest.)
The price of the report is US$44.95, but TSI subscribers can get a 35% discount -- reducing the price to around $29 -- by entering the discount code DB20S2012 during the checkout process.
We will get a commission on the reports sold to TSI subscribers, but we doubt that the amount of money involved will be significant. The reason we are helping to sell the report is that it contains information that could be useful to some of our readers.
If you use the low-risk method of share ownership explained in "BulletProof Shares" your shares will not be at risk from brokerage failure, but it will usually take a few days to make the shares available for sale. This means that the method could be put to good use for "core" positions (positions that you expect to hold for another 1-2 years or longer), but would not be well suited for trading positions. One way to use the ultra-secure method of share ownership and also maintain some trading flexibility would be to separate your core positions from your trading positions. For example, you have 15,000 shares of Sabina Gold and Silver (TSX: SBB), 10,000 shares of which are considered "core" and 5,000 of which are for trading (selling during the next sizeable rally). You could register your 10,000-share core component as discussed in the report and keep the 5,000-share trading component at a brokerage. This way only the trading component of your overall position would be exposed to the risk of brokerage failure.
Yearly Forecast, Part 1
Despite our scepticism regarding the practical value of forecasting, we follow the tradition of doing a 12-month forecast near the beginning of each year.
Here is the set of expectations with which we begin 2012. It is a snapshot of how we view the financial world right now and is presented with the caveat that the amount of profit made by a speculator over the course of any year should not rely on his ability to forecast the year's market action in January. Successful speculation is based on consistently making sensible money-management decisions in real time.
Random Thoughts
*There are similarities between the current situation in the US, the US of the 1930s and post-bubble Japan, but the monetary backdrop is very different in the US today than it was in the earlier post-bubble periods. The most obvious effect of the monetary difference is that the prices of most goods and services have continued to rise in the US since the bursting of the private-sector credit bubble in 2007.
*The less obvious effects of the current period's much higher rate of monetary inflation include the slowing of the corrective process and the introduction of additional price distortions and inefficiencies.
*The US eventually recovered from the bursting of the 1920s bubble despite the many idiotic policies implemented by the Hoover and Roosevelt administrations, but the US will not be able to recover from the bursting of the more recent credit bubble if the Fed continues to engineer a high rate of monetary inflation. If current Fed policies continue for at least a few more years, the US economy will end up in a far worse state than it has ever been before.
*Our view continues to be that a global economic depression of the inflationary kind began in 2007.
*At the beginning of last year we thought that the potential for China's real estate bubble to burst was the biggest risk facing the stock and commodity markets, and that tighter Chinese monetary policy prompted by rising food prices was the most likely catalyst for the bursting of the bubble. As we write today, it looks like China's real estate bubble has burst and that Chinese officialdom has begun to ease monetary conditions despite the country's inflation problem. Also, there is a lot less optimism about China's prospects now than there was at this time last year. The upshot is that there is nowhere near as much scope for a negative surprise out of China in 2012 as there was in 2011, which means that China-related risk has fallen.
*At the beginning of last year we thought that the euro-zone government debt problem was the second biggest risk facing the stock and commodity markets. This is still a sizeable risk, but its potential to wreak havoc has been substantially reduced by virtue of the fact that it has been a "Page 1" story for the past several months.
*We perceive this year's biggest risk to be 'unexpected' weakness in the US economy. Reliable leading indicators tell us that the US economy will probably get a lot weaker over the coming few quarters, but most people are still expecting the economy to "muddle through" and most equity analysts are still anticipating good earnings growth in 2012. The risk relates to a mismatch between expectations and reality.
*This year's second biggest risk is that there will be much greater instability in the Middle East. We doubt that there will be open military conflict between Iran and the US or between Iran and Israel, but fear of such conflict could have a big effect on the markets. Also, the political situations in Egypt and Syria are likely to become more turbulent, and there is an outside -- but not insignificant -- chance that Saudi Arabia will get caught up in the 'revolutionary wave'.
The potential financial consequences of this risk could be mitigated via the purchase of long-dated oil call options. Ideally, the options would be accumulated during periods of weakness in the oil market.
*Going into 2011 we thought that money-making would be far more difficult over the year ahead than it had been over the preceding two years, and that our primary focus should therefore be on 'playing defense'. As 2012 gets underway we think it is still appropriate to maintain a defensive posture, meaning that we continue to advocate an above-average cash position.
The US Stock Market
Our 2011 Yearly Forecast included the following statement:
"Our best guess at this time is that the stock market will be 'choppy' during the first half of this year, with a sizable downward correction occurring within the first two months. A lengthy decline is expected to begin during the third quarter of the year."
This guess turned out to be roughly correct, although it is not yet known if the decline that began during the third quarter of 2011 will turn out to be "lengthy". At this stage there is a possibility that it was nothing more than a sharp 3-month correction within a cyclical bull market, but our favoured scenario is that it was the first leg of a new cyclical bear market. Our favoured scenario requires that the market do no better than test its 2011 peak before commencing a downward trend that eventually pushes it well below last year's low.
We expect the market to hold up fairly well during the first few months of this year and then roll over into a major downward trend. To be more specific, we expect that the stock market will be supported over the first few months of the year by loose monetary policy and the fact that two of the most obvious threats (Europe's debt predicament and China's slowdown) have already been discounted. However, spreading realisation that the US economy is in recession will probably cause a major downward trend to begin after the aforementioned period of relative stability has run its course.
Lastly, we reiterate our view that the March-2009 low will prove to be the ultimate bear-market bottom in nominal dollar terms. This is due to the Fed-promoted depreciation of the US$. Furthermore, a floor has effectively been placed under the stock market's dollar-denominated price by the virtual certainty that the Fed will be a lot quicker to crank up the money pumps in reaction to stock market weakness during 2012-2014 than it was during 2007-2008.
That concludes Part 1 of our Yearly Forecast. Part 2 will be in this week's Interim Update and will cover the US$, the T-Bond, gold, silver, gold and silver equities, oil, and the industrial metals.
The Stock
Market
The US Economy
John Hussman regularly makes the point that many commentators on the economy continually adjust their views on how the economy will likely perform in the future based on the latest data, without regard to whether the data in question have demonstrated any predictive ability in the past. When the data are better than expected for a few weeks, the commentators become more optimistic. When the data are worse than expected for a few weeks, the commentators become more pessimistic. Hussman calls this a "flow of anecdotes" approach to economic forecasting.
The "flow of anecdotes" approach is not useful at the best of times and is very prone to error near the start of a recession. The reason is that the economic data tend to oscillate between better-than-expected and worse-than-expected during the months leading up to a recession and the first few months of a recession. Several weeks of weaker data tend to be followed by several weeks of stronger data, etc., as the economy gradually rolls over.
The solution is to focus on indicators that, when considered as a group, have a long history of a) reliably signaling recessions in a timely manner and b) being largely immune to the noise generated by normal weekly fluctuations in the data. ECRI's Weekly Leading Index (WLI) is comprised of one such group of indicators. The WLI is not the "holy grail" of economic forecasting, but using it to steer your economic outlook would be much better than becoming increasingly optimistic or pessimistic in reaction to the most recent news on the economy.
Click HERE
to view a long-term interactive chart of the WLI. The WLI's performance over recent months doesn't provide any ironclad guarantees, but it is consistent with the view that the US economy is either in recession or will soon be entering recession.
This points to considerable downside risk in the stock market, because the prevailing expectation appears to be for significant earnings growth in 2012.
Current Market Situation
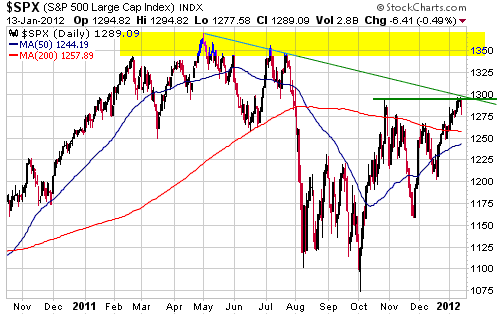
The S&P500 Index is currently testing resistance in the 1290s and is 'overbought' on a short-term basis. This suggests to us that a multi-week peak has either just been put in place or will be put in place this week.
If our 2012 outlook is close to the mark then the S&P500 will do no better over the next three months than test resistance at 1340-1370. A move up to this resistance range would create a relatively low-risk opportunity to enter bearish speculations.
This week's
important US economic events
| Date |
Description |
| Monday Jan 16 | US
stock and bond markets closed
| | Tuesday Jan 17 | Empire
State Manufacturing Survey
| | Wednesday Jan 18 | PPI
TIC Report
Industrial Production
Housing Market Index | | Thursday
Jan 19 |
CPI
Housing Starts
Philadelphia Fed Survey
|
| Friday Jan 20 | Existing
Home Sales
|
Gold and
the Dollar
Gold
A daily chart of the euro-denominated gold price (gold/euro) is displayed below.
Gold/euro's correction low to date occurred on Monday 26th September. Two days later we wrote:
"Over the past several years, the best opportunities to buy gold have often coincided with gold/euro dropping to its 200-day moving average. There's a good chance that gold/euro will trade at its 200-day moving average before the next major advance gets underway, but it could do so a few months from now at a price that's significantly higher than Monday's intra-day low. This is because the moving average is rising. The period from July-2010 through to February-2011 is an example of what we are talking about."
On 22nd November we then wrote:
"Despite's the abnormal backdrop created by Europe's sovereign debt crisis, the euro-denominated gold price (gold/euro) has been behaving the way it normally behaves during an intermediate-term correction. If it continues to behave normally, that is, if the current correction follows a similar pattern to earlier corrections, then it will a) spend at least 6 more months between its September-2011 peak and its October-2011 trough, and b) meet up with its 200-day moving average before commencing its next major advance."
Gold/euro eventually met up with its 200-day moving average in late December. As we suspected would be the case back in September, the meeting with the 200-day MA happened above September's intra-day low.
The bottom line is that despite everything that's happening in the world and the fears in the minds of some analysts that a deflationary collapse is imminent, gold/euro is continuing to behave as if it were experiencing a routine intermediate-term correction. The typical intermediate-term correction pattern suggests that it will be several more months before gold/euro makes a sustained break to new highs. It also suggests that a correction low is in place and that a sustained break to new highs will occur in 2012.
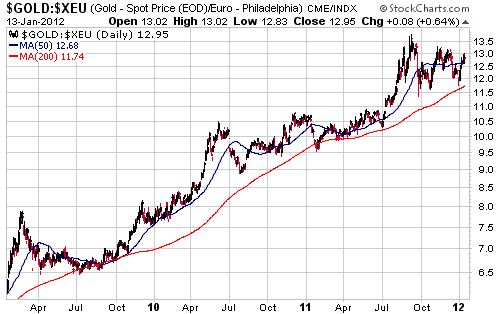
In US$ terms, gold is not close to being 'overbought' on even a short-term basis. Anything more bearish than a routine pullback is therefore unlikely. The same goes for silver.
Gold Stocks
In last week's Interim Update we wrote that the XAU has considerable resistance at 195-205 and that it wouldn't surprise us if the initial rally peaked within this range. The XAU traded within this resistance range on Thursday 12th January and then reversed course.
Our guess is that if a multi-week peak wasn't put in place last Thursday, it will be put in place this week.
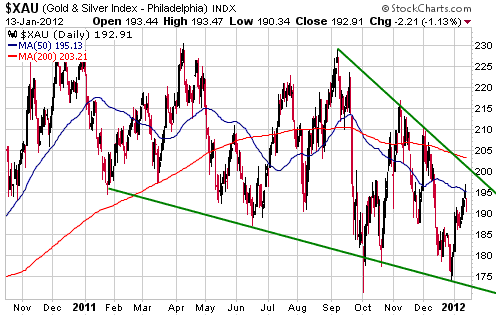
As previously advised, following a peak in the initial rally from the late-December low it would be normal to get a pullback that retraced between 50% and 100% of the initial rally. The next leg up would then commence. Based on the historical record and assuming that the peak of the initial rally will be between 197 (last Thursday's intra-day high) and 205, the low-180s is the most likely place for the XAU's next pullback low.
Currency Market Update
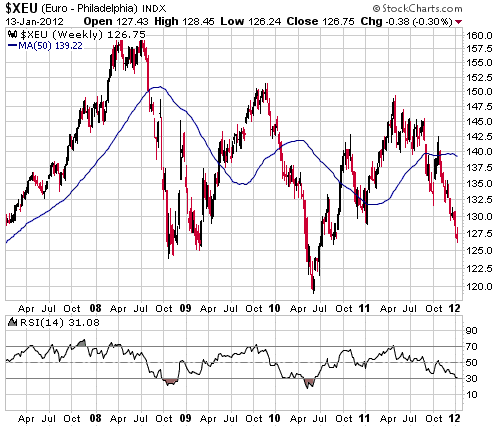
Ratings-agency downgrades of European sovereign debt aren't significant because the ratings agencies are a long way behind the markets. The downgrades do nothing other than bring the 'official' ratings closer to the ratings that the markets have already priced in. That being said, there will often be momentary shock value associated with an official downgrade, as was the case last Friday when market volatility increased in response to S&P's announcement that it was downgrading the debt of nine euro-zone governments.
Friday's action pushed the euro down to near support at 126. There is a lot of support at 125-126, which will probably hold for now.
We get the impression that most people expect the euro to drop to 120 or lower. We also expect that it will eventually drop below 120, but not before there is a rebound of sufficient size and duration to substantially reduce the massive speculative short position in euro futures and make sentiment less lopsided.
For anyone choosing to bet on the aforementioned counter-trend rebound, the risk is that there will be a blow-off decline in the euro in reaction to worse-than-expected news on the sovereign debt front. This is a risk worthy of consideration, because although the euro is now very 'oversold' it experienced blow-off declines the last two times it reached a similar 'oversold' extreme (September-October of 2008 and April-May of 2010).
Update
on Stock Selections
Notes: 1) To review the complete list of current TSI stock selections, logon at
http://www.speculative-investor.com/new/market_logon.asp
and then click on "Stock Selections" in the menu. When at the Stock
Selections page, click on a stock's symbol to bring-up an archive of
our comments on the stock in question. 2) The Small Stock Watch List is
located at http://www.speculative-investor.com/new/smallstockwatch.html
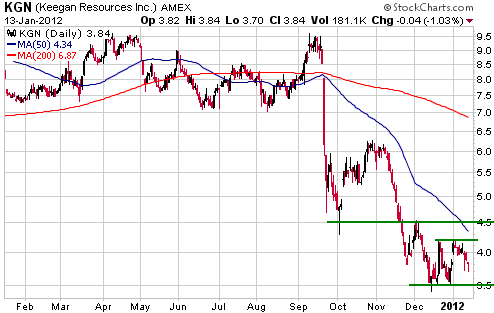
 Keegan Resources (TSX: KGN, AMEX: KGN). Shares: 75M issued, 81M fully diluted. Recent price: US$3.84 Keegan Resources (TSX: KGN, AMEX: KGN). Shares: 75M issued, 81M fully diluted. Recent price: US$3.84
KGN's stock price has never recovered from the disappointment caused by the Pre-Feasibility Study (PFS) reported last September, but 'the market' appears to be overlooking the fact that although the PFS was worse than expected it still revealed that KGN's Ghana-based Esaase gold project would be economically viable at a gold price as low as $1300/oz. The PFS also revealed that the economics would be robust at $1500/oz and that the project would be hugely profitable at $1800/oz. At a gold price of $1500/oz, for example, Esaase's NPV (5%) was estimated to be US$693M. Taking into account KGN's $210M of cash, this equates to US$11 per fully diluted share.
Even though gold is currently about $140/oz above the price used when calculating the NPV figure mentioned above, we don't think that KGN deserves to be trading at $11/share right now. This is due to various risks and the fact that the tax rate in Ghana is likely to increase. However, the present discount to NPV appears to be way too high.
Turning to the chart, we see that KGN has support at US$3.50. There is some resistance at $4.20, but the most important nearby resistance lies at $4.50. A daily close above $4.50 would confirm that the stock had bottomed and create a short-term chart-based target of $5.50-$6.00.
KGN is one of the best buys in the gold sector at this time.
Sabina Gold and Silver (TSX: SBB). Shares: 161M issued, 170M fully diluted. Recent price: C$3.97
SBB rebounded strongly from early October through to early November. As illustrated on the following daily chart, it has since oscillated within a contracting triangle.
The triangular price pattern of the past 2.5 months is neutral, although we think the odds favour an upside breakout from the 'triangle'. An upside breakout would create a short-term chart-based target of around C$5.00. The chart-based target following a downside breakout would be around C$3.00, but we will be very surprised if the market gives us another opportunity to purchase SBB shares at such a low level.
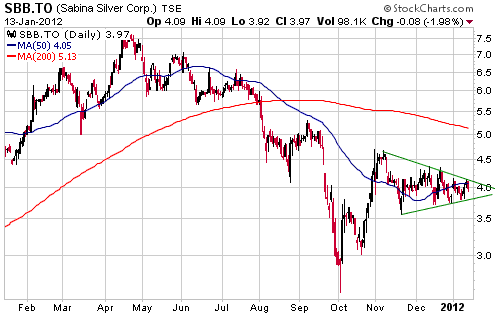
SBB is one of the highest quality exploration-stage gold mining stocks we know of, with a 6M-ounce (and growing) gold resource at its Back River project, a valuable silver royalty associated with Xstrata's Hackett River project, and a very strong balance sheet. Near the current price it also offers plenty of value and is a good candidate for new buying.
Chart Sources
Charts appearing in today's commentary
are courtesy of:
http://stockcharts.com/index.html

|
