


--
Weekly Market Update for the Week Commencing
16th January 2017
Big Picture
View
Here is a summary of our big picture
view of the markets. Note that our short-term views may differ from our
big picture view.
The BULL market in US Treasury Bonds
that began in the early 1980s ended in early-2015, but there will be many years
of topping action in bond prices and bottoming action in bond yields before
major new trends get underway. (Last update: 29 June 2015)
The stock market, as represented by the S&P500 Index,
commenced
a secular BEAR market during the first quarter of 2000, where "secular
bear market" is defined as a long-term downward trend in valuations
(P/E ratios, etc.) and gold-denominated prices. This secular trend will bottom sometime between 2018 and 2020.
(Last update: 29 June 2015)
A secular BEAR market in the
US
Dollar
began during the final quarter of 2000 and ended in July of 2008. This
secular bear market will be followed by a multi-year period of range
trading.
(Last
update: 09 February 2009)
Gold commenced a
secular bull market relative to all fiat currencies, the CRB Index,
bonds and most stock market indices during 1999-2001.
This secular trend will peak sometime between 2018 and 2020.
(Last update: 29 June 2015)
Commodities,
as represented by the CRB Index, commenced a
secular BULL market in 2001 in nominal dollar terms. The first major
upward leg in this bull market ended during the first half of 2008, but
a long-term peak won't occur until 2018-2020.
(Last
update: 29 June 2015)
Copyright
Reminder
The commentaries that appear at TSI
may not be distributed, in full or in part, without our written permission.
In particular, please note that the posting of extracts from TSI commentaries
at other web sites or providing links to TSI commentaries at other web
sites (for example, at discussion boards) without our written permission
is prohibited.
We reserve the right to immediately
terminate the subscription of any TSI subscriber who distributes the TSI
commentaries without our written permission.
Outlook Summary
Market
|
Short-Term
(1-3 month)
|
Intermediate-Term
(6-18 month)
|
Long-Term
(2-5 Year)
|
|
Gold
|
N/A |
Neutral
(21-Nov-16) |
Bullish
|
|
US$ (Dollar Index)
|
N/A |
Neutral
(17-Aug-16) |
Neutral
(19-Sep-07) |
|
US Treasury Bonds (TLT)
|
N/A |
Neutral
(21-Nov-16)
|
Bearish |
|
Stock Market (DJW)
|
N/A |
Neutral
(14-Nov-16) |
Bearish |
|
Gold Stocks
(HUI)
|
N/A |
Neutral
(21-Nov-16) |
Bullish
|
|
Oil |
N/A |
Neutral
(26-Oct-15) |
Bullish
|
|
Industrial Metals
(GYX)
|
N/A |
Neutral
(10-Oct-16) |
Bullish |
Notes:
1. Our short-term expectations are discussed in the commentaries, but except in
special circumstances we won't attempt to assign a "bullish", "bearish" or
"neutral" label to these expectations.
2. The date shown below the current outlook is when the most recent outlook change occurred.
3. "Neutral" means that we think risk and reward are roughly in balance with respect to the timeframe in question.
4. Long-term views are determined almost completely by fundamentals and intermediate-term views
are determined by a combination of fundamentals, sentiment and technicals.
Last week's posts at the TSI Blog
Revisiting the gold market's "London bias"
A wide-angle view of the US stock market
Summary of current
thinking/positioning
1) Thinking that the rebounds in
gold, silver and the associated mining indices are not yet close to being
over, but on the lookout for profit-taking opportunities in individual
stocks.
2) Maintaining long-term exposure to non-gold commodities
(natural gas, coal, uranium, copper, zinc, nickel, agricultural products),
but concerned that an intermediate-term correction will begin this
quarter. Hedged via EEM and USO put options.
3) Thinking that the
US Treasury Bond has significant additional short-term upside (within a
long-term bearish trend).
4) Expecting an extension of the US
equity bull market and expecting a generally-bullish global equity trend,
but concerned about short-term downside risk.
5) Thinking that the
Dollar Index is immersed in a 2-3 month correction, after which its
longer-term upward trend will resume.
6) Maintaining a large cash
reserve to hedge downside risk in equities (current cash percentage is
about 40%).
Industrial
Commodities
2017 Forecast
Here's how our 2016 annual forecast for industrial commodities (oil
and the industrial metals) was summarised:
"For this year there
is no reason to make separate forecasts for different industrial
commodities, because they are in synch. They are all massively 'oversold'
and poised for at least intermediate-term and possibly long-term upward
reversals from whatever lows are made during the first quarter."
The forecast 'panned out', although there is an as-yet-unanswerable
question as to whether the Q1-2016 upward reversals were the
intermediate-term or the long-term kind.
In one respect, this
year's forecast for industrial commodities is the opposite of last year's.
Whereas last year we were expecting an intermediate-term bottom during the
first quarter, this year we are expecting an intermediate-term top during
the first quarter. This is partly because speculators have built up
unusually-large long positions in some commodities, most notably copper
and oil. It is also because the forces that have caused the recent
strength in the prices of industrial commodities are likely to soon
disappear, at least temporarily. These forces are the US$ correction and
the Trump-related enthusiasm for any perceived beneficiary of "fiscal
stimulus".
To further explain, the Dollar Index will probably make
a new multi-year high during the second quarter of this year and the
Trump-related enthusiasm is misplaced. It is misplaced because a) the
additional US infrastructure spending will be less than anticipated (due
to budget constraints) and will have no meaningful effect on global
commodity consumption, and b) the planned tax cuts will take longer to
implement and will bring about less additional spending than currently
believed.
We expect that the Q1-2017 top will be followed by a
multi-month correction and an important bottom around mid-year in parallel
with an important top for the US$. With the US$ no longer a headwind and
speculative long positions having been greatly reduced in response to
price weakness, the stage will then be set for general commodity-price
strength during the second half of the year.
Overall, we expect
that 2017 will be an up-year for commodity prices.
Also, as part of
last year's annual forecast we wrote:
"In the commodity
markets, measures of negativity and downside momentum have reached rare
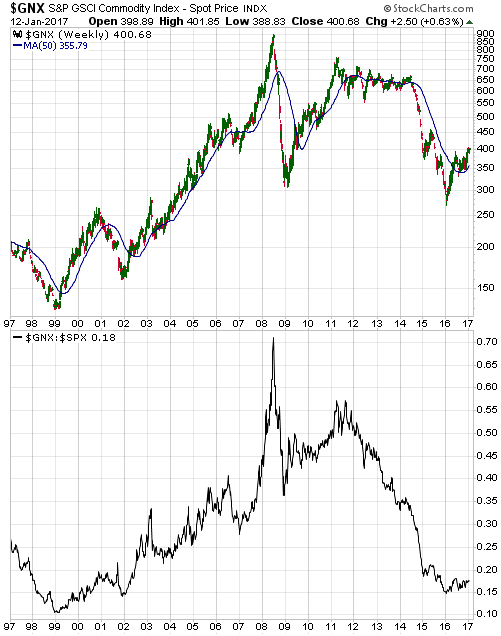
and in some cases unprecedented extremes. Also, the bottom section of the
following chart shows that the Goldman Sachs Spot Commodity Index (GNX)
has fallen to near its 2001 low relative to the S&P500 Index (SPX)."
Here is an updated version of the same chart. Note that although there
was a significant rebound in commodity prices (as represented by GNX) from
the early-2016 bottom, the GNX/SPX ratio is still near its 2001 low.
Regardless of how the commodity markets fare in nominal dollar terms, this
suggests that the risk/reward favours commodities over equities.
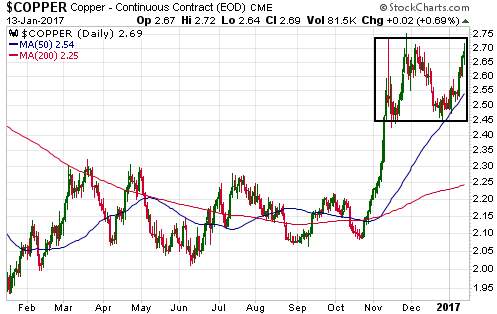
Copper Update
When the copper price held above
lateral support at $2.45 and bounced off its 50-day MA during the recent
pullback it opened up the possibility of a rise to as high as $3.00 prior
to a more substantial decline. Last week's price action increased the
probability of this outcome, in that the multiple tests of the $2.70-$2.75
range that have now taken place make it likely that this range will soon
be exceeded (the more times a support or resistance level is tested the
higher the probability that it will eventually be breached).
Critical support remains at $2.45, although a daily close below the 50-day
MA would warn of a downward trend reversal.
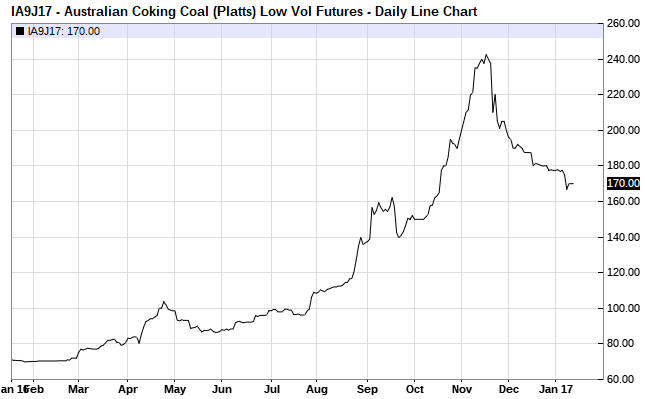
Coal Crash
The following chart shows last
year's incredible rally in the price of coking coal (the type of coal used
in steel making) to a November high of more than $240/tonne and the
subsequent plunge to a current level of $170/tonne.
Coal mining stocks haven't reacted in a big way to the 'coal crash' of
the past two months. For example, the Coal ETF (KOL) ended last Friday
within a few percent of its November-2016 closing high.
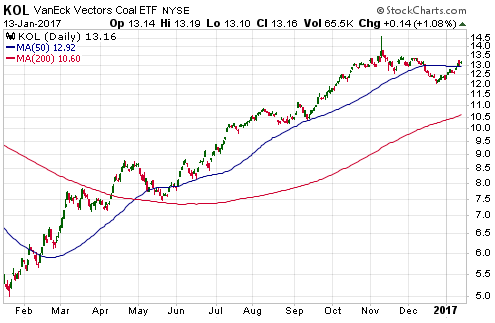
There are two reasons that coal-mining equities have taken coal's
price crash in stride. One is that despite the recent crash, the coal
price is still almost 150% higher than it was a year ago. The other is
that coal producers generally sell at contract prices that follow the spot
price with a significant lag and that rise/fall at a much slower pace than
the spot price. Consequently, the price at which most coal producers sell
is still on the rise and will be significantly higher in Q1-2017 than it
was in Q4-2016.
The TSI Stocks List has indirect exposure to coal
via Sprott Resource Corp. (SCP.TO) due to SCP's stake in Corsa Coal
(CSO.V). According to the most recent financial statements, CSO is SCP's
largest equity investment.
Coal's price plunge is almost certainly
due to the increase in supply that is occurring in response to the huge
preceding price gain. As the saying goes, in the commodity markets "the
cure for high prices is high prices".
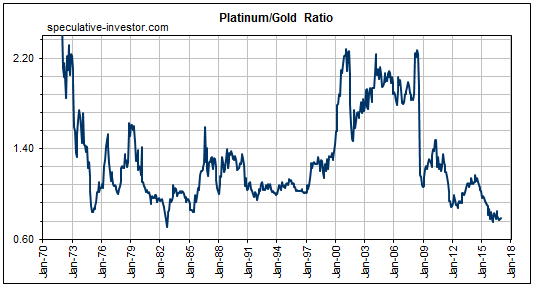
Platinum is still
relatively cheap
A year ago we wrote that we were more
bullish on platinum than any other precious metal. That's still the case,
because relative prices are almost the same now as they were a year ago.
As illustrated by the following monthly chart, the platinum price remains
near a 50-year low relative to the gold price.
The T-Bond
rebound is just getting started
The following chart shows that
the 30-year T-Bond peaked in early-July last year and then fell all the
way back to its 2015 low. Since bottoming during the second half of
December it has rebounded to its 50-day MA.
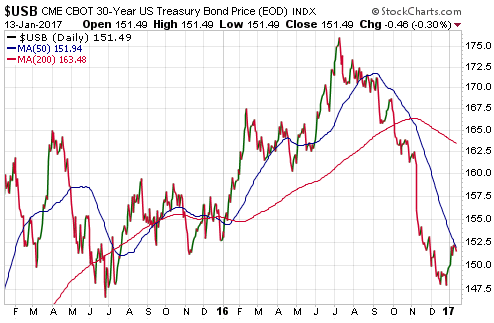
A rebound to the 50-day MA is sometimes the best that a
downward-trending market can do, but there are good reasons to believe
that the T-Bond's rebound is not yet close to being complete. Sentiment,
as indicated by the Commitments of Traders (COT) data, is the most
important of these reasons.
The COT numbers were bullish when the
rebound began in late-December, but they are now even more bullish. In
fact, the combined COT situation for 30-year T-Bond futures and 10-year
T-Note futures is now as bullish as it has ever been. To be more specific,
speculators in long-dated Treasury futures have never been more net-short
than they are right now. The stage is therefore set for a large wave of
short-covering.
There's a good chance that the T-Bond will rise to
its 200-day MA within the next few months, but there are multiple paths it
could take to get there. One path involves some base-building over the
next few weeks with a test of the December low prior to the start of a
consistent upward trend. Another path involves only minor 1-2 week
consolidations along the way.
The T-Bond's short-term bullish
prospects are good news for gold investors, because if the T-Bond is
trending upward then in the absence of a very strong Dollar Index the
Bond/Dollar ratio will also be trending upward.
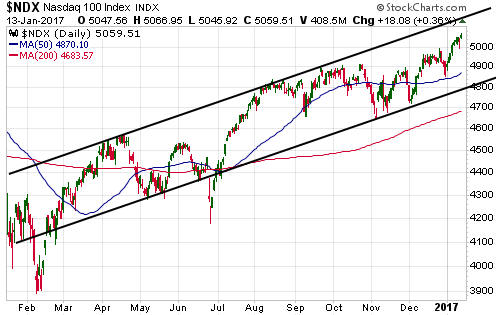
The Stock Market
The US
The NASDAQ100 Index (NDX) is continuing to work its way relentlessly
upward and has now achieved consecutive weekly closes above the big round
number (5,000). A realistic short-term target is the top of the
intermediate-term channel drawn on the following chart, but this is only
about 2% above the current price.
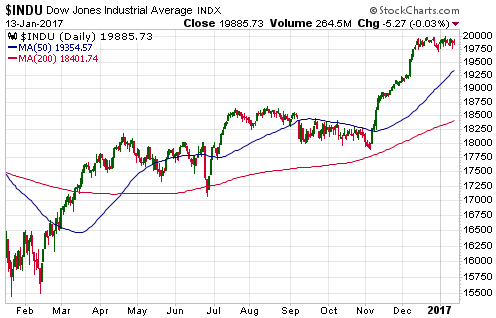
The Dow Industrials Index, however, has spent the past month chopping
back and forth within a narrow horizontal range just below its own big
round number (20,000). As mentioned in last week's Interim Update, it
looks like the US stock market will not reach a short-term top until the
financial news networks have had the opportunity to celebrate "Dow
20,000".
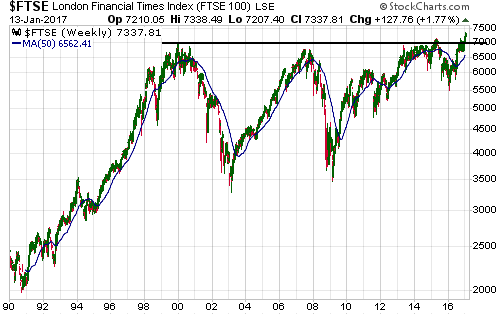
The UK
We are currently paying closer
attention than usual to the UK stock market due to the incredible recent
winning streak of London's FTSE100 Index. The FTSE has now risen for 14
trading days in a row and on 18 of the past 19 trading days. Streaks like
this are rare in senior stock indices.
As mentioned in last week's
Interim Update, it could become evident very early in the coming
correction as to whether we are dealing with a minor pullback or a 10%-15%
decline.
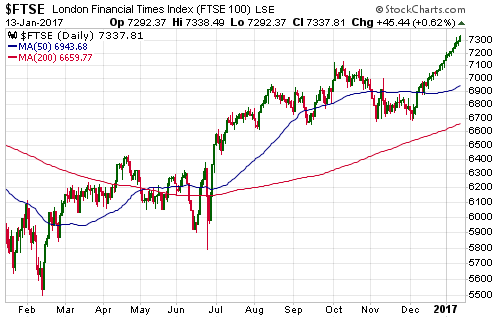
While the FTSE is extremely 'overbought' on a short-term basis, on a
long-term basis it has only just broken above the top of a base that has
been 17 years in the making. The break above long-term resistance could be
signaling that a 2-3 year cyclical advance has begun, or it could be a
'head fake'. It would be prudent to assume the former until/unless proved
otherwise.
This week's
significant US economic events
[Notes:
1) The most important events
(to the markets) are shown
in bold. 2) A list of global economic events can be found
HERE]
| Date |
Description |
|
Monday January 16 |
US markets closed for public
holiday |
| Tuesday
January 17 |
No important events scheduled |
|
Wednesday January 18 |
CPI
Industrial
Production
Beige Book
TIC Report |
|
Thursday January 19 |
Housing Starts
Philadelphia Fed Business Outlook Survey |
|
Friday January 20 |
No important events scheduled |
Gold and the Dollar
Gold
Last week the US$ gold price reached resistance in the low-$1200s. This was/is
our minimum target for the rally that began in December and is likely to end
during the first quarter of this year. That the minimum target was reached so
early in the quarter and with no significant intervening pullback means that the
maximum target stands a decent chance of being reached prior to a multi-month
price peak. The maximum target is the 200-day MA, which is presently near $1270.
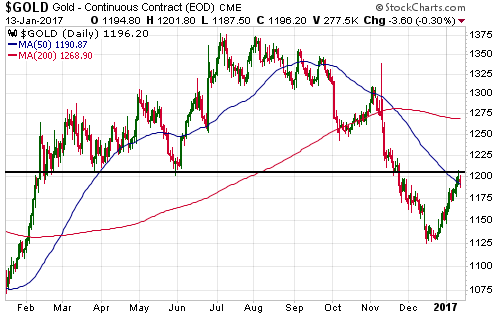
In wave terms, the up-move in the gold price over the past three weeks is
probably the 'A' wave of an A-B-C pattern. Next comes a pullback or
consolidation probably lasting 1-2 weeks, after which there should be a rally to
a new high for the move.
That being said, the gold market is not yet
short-term 'overbought' so an extension of the initial wave is certainly
possible.
Gold Stocks
Our target range for the
expected Q1-2017 peak in the HUI remains 220-250. As illustrated below, near 220
there is the 200-day MA in addition to lateral resistance, and at 250 there is
lateral resistance.
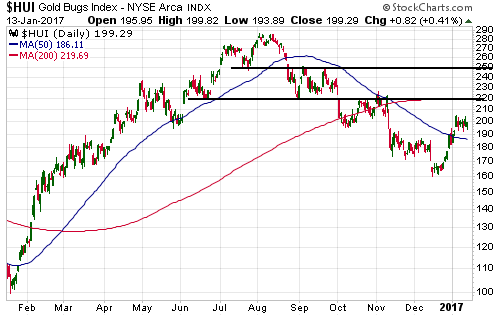
The
HUI has moved sideways for 6 trading days since breaking above 200 on 5th
January. Minor consolidations within short-term upward trends often last 4-8
trading days, so a quick move up to the bottom of our target range could happen
as soon as this week. However, an equally-likely outcome is that the
consolidation/correction continues for at least another week and results in a
test of the 50-day MA, which is presently at 186.
Either way, we expect a
further gain of at least 10% and potentially as much as 25% prior to a
multi-month top.
The Currency Market
The Dollar Index
The downward correction
in the Dollar Index is proceeding roughly as expected. The Index reached its
50-day MA late last week and ended the week almost exactly level with this
moving average.
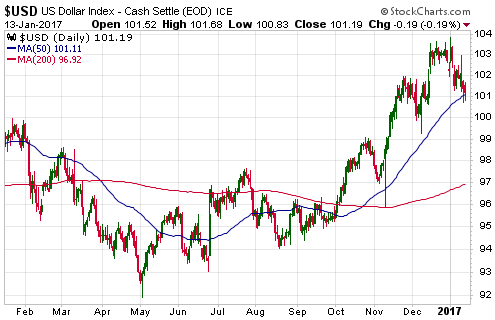
In
addition to the 50-day MA, there is significant support in the 100-101 range
defined by the 2015 peaks. This will probably mean that a rebound gets underway
during the first half of this week, but we doubt that the overall correction is
complete.
The 98-99 range is, we think, a reasonable target for a
short-term bottom.
Inflation anger is on the
rise in Germany
Here's an excerpt from an
article published at www.telegraph.co.uk last week:
"The ECB
wants to inflate away the debt of the southern European countries. This is a
clear conflict of interest with net creditors like Germany," said Clemens Fuest,
president of the IFO Institute in Munich. "There is a debate building up on the
expropriation of German savers by the ECB. This is going to become very
difficult if inflation approaches 2pc and they still do nothing. People will
conclude that their true motive is redistribution," he said.
What is new
is that Germany's inflation rate has suddenly jumped to 1.7pc after a long and
deceptive period of quiescence. It is now much higher than in southern Europe.
The mechanical effect is to drive real interest rates to minus 2pc, lower than
at any time in German history other than the two hyper-inflations after the
First and Second World Wars.
Professor Clemens said the politics are
poisonous because the ECB's majority bloc is openly sweeping aside German
objections. This plays into the hands of the eurosceptic Alternative fur
Deutschland (Afd), while the ruling Christian Democrats are toughening their
line to stop a leakage of votes.
"The perception is that we are being
dominated by foreigners. This is going to become a big issue in the campaign,"
he said."
At the heart of the issue is the impossibility of
concocting a one-size-fits-all monetary policy for a group of economically,
politically and culturally disparate countries.
While all the euro-zone
countries were experiencing superficial signs of deflation there was very little
pushback against the ECB's aggressive attempts to promote "inflation", but with
a) these attempts set to extend throughout 2017, b) obvious signs of price
inflation and an artificial boom appearing in the euro-zone's largest economy
and c) Italy and some of the smaller countries still immersed in economic
depressions, a major conflict appears to be brewing.
As implied in the
above article, the longer the ECB persists with its ultra-easy monetary policy
in a misguided effort to support the weakest economies, the greater will be the
pushback from Germany. One possible outcome is that German policy-makers gain
greater influence over the ECB, leading to one or more of the
economically-weaker countries leaving the monetary union. Another possible
outcome is that the ECB continues relentlessly along its current path, prompting
Germany to leave the monetary union to avoid a severe inflation problem.
Although such an eventuality can't be ruled out, Europe's monetary union
probably won't fracture this year. There is, however, a high probability that it
will fracture within three years.
Updates
on Stock Selections
Notes: 1) To review the complete list of current TSI stock selections, logon at
http://www.speculative-investor.com/new/market_logon.asp
and then click on "Stock Selections" in the menu. When at the Stock
Selections page, click on a stock's symbol to bring-up an archive of
our comments on the stock in question. 2) The Small Stock Watch List is
located at http://www.speculative-investor.com/new/smallstockwatch.html
 Company
news/developments for the week ending Friday 13th January 2017:
Company
news/developments for the week ending Friday 13th January 2017:
[Note: AISC = All-In Sustaining Cost, FS = Feasibility Study, FY = Financial
Year, IRR = Internal Rate of Return, ISR = In-Situ Recovery, MD&A = Management
Discussion and Analysis, M&I = Measured and Indicated, NAV = Net Asset Value,
NPV(X%) = Net Present Value using a discount rate of X%, P&P = Proven and
Probable, PEA = Preliminary Economic Assessment, PFS = Pre-Feasibility Study]
*Blackham Resources (BLK.AX) reported its gold
production for the December quarter, which was the first quarter of production
for its newly-commissioned Matilda/Wiluna project in Western Australia.
There was a steady increase in production from the first gold pour in
mid-October through to year-end, with 9.2K ounces being produced during the
quarter and 5K of these ounces being produced in December. That is, the
annualised production rate was 60K ounces during December.
Most
importantly, the company advised that it is on track to produce gold at an
annualised rate of more than 100K ounces during the first half of the 2017
calendar year. To be more specific, the company advised that it is on track to
meet its 64K-71K-oz production target for FY2017 (the Financial Year ending 30th
June 2017). Given that 9K ounces were produced during the first half of the
Financial Year (the past 6 months), this means that the company expects to
produce 55K-62K-ounces during the first 6 months of the 2017 calendar year.
A higher gold price is not needed for BLK's stock price to move north of
A$1.00 within the next 9 months. All that's needed is for the company to achieve
its targeted production rate and for the gold price not to move a lot lower.
*Energy Fuels (EFR.TO, UUUU) advised that the U.S.
Bureau of Land Management (BLM) has issued a final environmental impact
statement (EIS) and record of decision (ROD) for the company's Sheep Mountain
uranium project in central Wyoming. The Sheep Mountain Project is a large-scale,
formerly-producing conventional uranium mine with a 30M-pound Indicated
resource.
The Sheep Mountain project is now fully permitted, meaning that
it could now be put into production if it made economic sense to do so.
Unfortunately, at the current uranium price in the low-US$20s the project is a
long way out of the money. To be more specific, according to the April-2012 PFS
the Sheep Mountain project would probably be economically viable at a uranium
price of $50/pound and would be economically robust (42% IRR) with a uranium
price of $65/pound.
Receipt of the final Sheep Mountain permits is still
a positive development, though, because it increases EFR's upside leverage to
the uranium price. The company now has another asset that can be quickly brought
into production after market conditions become suitable.
*Premier
Gold (PG.TO) now has so many 'irons in the fire' it is difficult to
keep track of the company's progress.
The company issued three press
releases last week, the first containing exploration results/plans, the second
reporting a maiden resource estimate for the Hasaga gold project in Ontario and
the third providing an update on production. For a company such as PG,
exploration results only matter to the extent that they add to the quantity or
quality of the resource base. We'll therefore focus on the latter two press
releases.
According to an estimate compiled by an independent consultant,
PG's 100%-owned Hasaga project has a total open-pit gold resource (there is the
potential to also define an underground resource, but this is yet to happen) of
about 1.7M ounces (1.1M "Indicated" plus 0.6M "Inferred") at an average grade of
around 0.8-g/t. This is a very good start, as a 1.7M-ounce resource could
already be enough to support a significant mining operation.
At this
stage it's impossible to intelligently assign a value to the Hasaga resource,
because gold-in-the-ground can be worth anything from zero to a few hundred
dollars per ounce. For example, a gold resource that has no realistic chance of
ever being economic or ever being permitted has zero value. However, if Hasaga
were the flagship project of a microcap miner we suspect that the stock market
would currently be assigning it a value of at least US$20/oz, or US$34M (C$45M).
This equates to about C$0.20 per PG share.
With regard to progress on the
production front, the company had a very good December quarter. With 81.8K
ounces of gold produced during the final quarter the company exceeded its yearly
guidance by about 2K ounces. Specifically, its 2016 guidance was for 100K-110K
ounces of gold production and it ended up producing 112K ounces.
It
seems, however, that production was pulled forward from 2017, because the 2017
guidance has been reduced by a few thousand ounces. This year's production is
now expected to be 125K-135K ounces at an AISC of only US$660-$690/oz. A lot
will obviously depend on the gold price, but this suggests that PG's operating
gold mines will have positive cash flow in excess of US$50M during 2017.
Upcoming news of significance will be the year-end financial statements in
February and an updated resource estimate for the exploration-stage McCoy-Cove
project some time before the end of March.
At the current gold price we
think that PG would be fairly valued at around C$4/share.
*Ramelius
Resources (RMS.AX) reported December-quarter gold production of 31.3K
ounces, which is near the low end of the company's 31K-35K guidance range. We
view this production result as neutral.
Despite the production coming in
at the low-end of the forecast range, it was another quarter of strong cash
generation for RMS. The company now has no debt and A$95M of cash, which amounts
to a $6M improvement during the quarter.
With 525M shares outstanding,
net cash of A$95M and a current stock price of A$0.57, RMS has an enterprise
value of A$204M. At an A$/US$ exchange rate of 0.74, this equates to US$151M.
For a company with profitable gold production in excess of 100K ounces/year in
the world's lowest-risk mining jurisdiction, an enterprise value of US$151M is
low.
We think there's a good chance of RMS's stock price rising to A$1.00
during 2017.
*Sabina Gold and Silver (SBB.TO) had
significant news last Friday. SBB is not a current member of the TSI List, but
it is a former and potential future member.
Last June the Nunavut Impact
Review Board (NIRB) recommended to the Minister of Indigenous and Northern
Affairs Canada (INAC) that the Back River project not proceed to the next phase
of permitting. This was a major and surprising setback for SBB's flagship
project, and opened up three possibilities.
The first was that the
Minister would accept the NIRB's recommendation and effectively kill the
project. The second was that the Minister would ignore the NIRB's recommendation
and allow the project to proceed to the mine construction phase. The third and
by far the most likely was that the Minister would return the Back River project
to the NIRB for further consideration.
On Friday 13th January the most
likely of the three outcomes was confirmed. The project has been returned to the
NIRB.
There wasn't a big market reaction to the news on Friday (the stock
was up 10%) because the outcome was generally expected and because a lot of
uncertainty remains. It is reasonable to assume that the project will eventually
get permitted, but there is no telling how long it will take for SBB to satisfy
the bureaucrats at the NIRB and obtain the necessary positive recommendation. In
last Friday's press release SBB simply wrote: "Sabina will await direction from
the NIRB on how the additional review of the project is to proceed."
Given the uncertainty regarding timing, at the current price we are not
interested in owning SBB shares or returning the stock to the TSI List. However,
we might be interested at a much lower price or after the permitting schedule
becomes clearer.
*Taseko Mines (TGB) announced
December-quarter copper production of 41M pounds, bringing full-year production
to 133M pounds.
The December-quarter production result was excellent.
Combined with the higher average copper price during the quarter it should
provide a significant boost to TGB's financial position. The next look at TGB's
financial position will happen when the company's annual report is issued during
the second half of February.
While TGB's financial situation has clearly
improved and is trending in the right direction, the improvement appears to have
been largely factored into the stock price. As illustrated below, a substantial
upward re-rating has occurred.
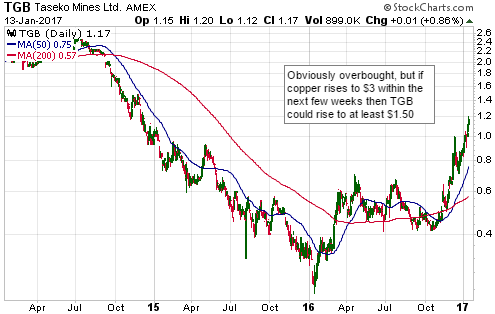
We
will play it by ear, but as things stand today we would view a rise in TGB's
stock price to around US$1.50 as a selling opportunity. In fact, given the
magnitude of the stock's recent advance it could, for risk/money-management
reasons, be appropriate to take partial profits now.
*Timmins
Gold (TGD) reported December-quarter gold production of 25.3K ounces
and total 2016 production of 100.3K ounces. The annual output was slightly above
the top end of the company's upwardly-revised guidance range and was therefore a
good result.
As per TGD's previously-advised plan for its San Francisco
mine in Mexico, 2017 gold production is expected to be 70K-75K ounces at a cash
cost of US$900-$950/oz. This cash cost implies a total cost of at least
$1150/oz, which, in turn, implies that TGD would be doing only marginally better
than breaking even at the current gold price.
Fortunately, TGD's balance
sheet is now healthy and if it can bring its Ana Paula gold project into
production over the next couple of years it will have a much lower overall cost
profile. The FS for the Ana Paula project is expected to be complete by
mid-2017.
As previously advised, TGD's value is highly levered to the
gold price. For example, our rough estimate of fair value increases from
US$0.39/share to US$0.85/share with a rise in the gold price from $1200/oz to
$1300/oz.
List
of candidates for new buying
From within the ranks of TSI stock
selections the best candidates for new buying at this time, listed in
alphabetical order, are:
1) ALK.AX at A$0.35 or lower (last Friday's
closing price: A$0.38)
2) BLK.AX (last Friday's closing price: A$0.57)
3) ESM.TO (last Friday's closing price: C$0.85)
4) PG.TO following a
pullback to the C$2.50s (last Friday's closing price: C$2.91)
5) SCP.TO
(last Friday's closing price: C$0.54) or ADI.V (last Friday's closing price:
C$0.19). Note: These companies are merging.
Note that the above list is
limited to five stocks. It will sometimes contain less than five, but it will
never contain more than five regardless of how many stocks are attractively
priced for new buying.
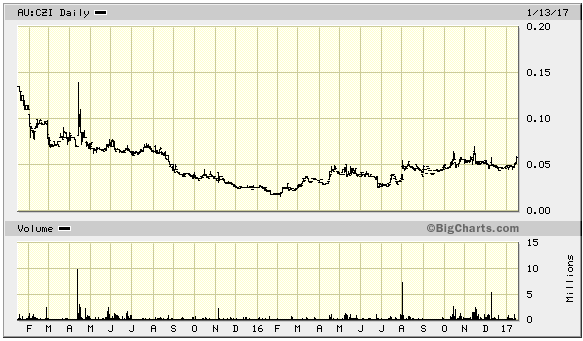
Speculative
exposure to copper
In the 19th October 2016 Interim Update we
added Australia-listed Cassini Resources (ASX: CZI) to the TSI Small Stocks
Watch List (SSWL). It was trading at A$0.05 at that time and is now trading at
around A$0.057.
CZI's flagship asset is the West Musgrave nickel-copper
project in Western Australia, a project with a global resource containing about
3.8B pounds of copper and 1.8B pounds of nickel. CZI currently owns 100% of West
Musgrave, but Oz Minerals (OZL.AX) can earn 70% of the project over the coming
few years by spending A$36M and completing a feasibility study.
It's the
partnership with the financially-strong mid-tier mining company (OZL) that
attracts us. Without this partnership CZI would be just one of the many
microcaps with a large, low-grade mineral deposit. They are a dime a dozen.
With 276M shares outstanding, CZI's current market cap is only about A$16M
(US$12M). This market cap is low relative to the amount that OZL is planning to
spend on the project to earn its share and miniscule relative to the potential
value of such a large base-metals project.
The risk is that exploration
results are not good enough, prompting OZL to return the project to CZI after
spending only $3M.
Saying
farewell to an old friend
Rumours emerged late last week that
London-listed
Acacia Mining (ACA.L), a company that produces gold at the rate of around
800K ounces/year from mines in Tanzania, is in merger discussions with Endeavour
Mining (EDV.TO). The companies acknowledged that discussions had taken place,
but that no deal was currently in the works.
We won't be surprised if the
merger happens, because it appears to make sense. Assuming it was carried out as
a merger of equals (meaning: no takeover premium) it would, we think, be
slightly positive for EDV. It would be very positive in terms of in-ground
resources, slightly positive in terms of balance sheet, neutral in terms of
production and slightly negative in terms of production cost (ACA's production
cost is higher than EDV's).
If it happens, the combined company will be a
senior gold producer with a market cap in the US$4B-$5B range and annual
production of around 1.5M ounces. All of the production would come from Africa
-- about half from the west side and half from the east side.
Although
the merger might not happen and would probably be slightly positive for EDV if
it did, this news has prompted us to remove EDV from the TSI List. One reason is
that the company is getting too big with too many 'moving parts', making it
time-consuming to closely follow (we cover a lot of ground in the TSI
commentaries and therefore need to limit the amount of time we devote to any one
stock). A second reason is that we expect EDV to move in line with the overall
gold-mining sector from here on, that is, the dramatic outperformance that EDV
provided last year is unlikely to occur in the future. For example, if GDX were
to rise by 10-15% over the coming month then EDV would probably do the same.
Last Friday's closing price of C$22.83 for EDV is almost identical to the
(split-adjusted) price at which the stock was added to the List 5 years ago, so
the long-term EDV trade will go into the record books as a break-even result.
However, the majority of our buy suggestions over the years occurred when the
stock was trading at $4-$8, so most long-term TSI readers who traded the stock
probably did very well.
EDV could return to the TSI List in the future,
but probably only as a short-term trading position.
Chart Sources
Charts appearing in today's commentary
are courtesy of:
http://stockcharts.com/index.html
http://www.barchart.com/
http://bigcharts.marketwatch.com/
