![]()
![]()
![]()
![]()
-- Weekly Market Update for the Week Commencing 16th April 2018
Big Picture
View
Here is a summary of our big picture
view of the markets. Note that our short-term views may differ from our
big picture view.
The BULL market in US Treasury Bonds that began in the early 1980s ended in mid-2016, but there will be many years of topping action in bond prices and bottoming action in bond yields before major new trends get underway. A major decline in government bond prices will unfold during the 2020s. (Last update: 11 September 2017)
The stock market, as represented by the S&P500 Index, commenced a secular BEAR market during the first quarter of 2000, where "secular bear market" is defined as a long-term downward trend in valuations (P/E ratios, etc.), gold-denominated prices and inflation-adjusted prices. This secular trend will bottom in 2020 or later. (Last update: 11 September 2017)
A cyclical BEAR market in the US Dollar began in 2016-2017. (Last update: 11 September 2017)
Gold commenced a secular bull market relative to all fiat currencies, the CRB Index, bonds and most stock market indices during 1999-2001. This secular trend will peak in 2020 or later. (Last update: 11 September 2017)
Commodities,
as represented by the CRB Index, commenced a
secular BULL market in 2001 in nominal dollar terms. The first major
upward leg in this bull market ended during the first half of 2008, but
a long-term peak won't occur until 2020 or later.
(Last
update: 11 September 2017)
Copyright
Reminder
The commentaries that appear at TSI
may not be distributed, in full or in part, without our written permission.
In particular, please note that the posting of extracts from TSI commentaries
at other web sites or providing links to TSI commentaries at other web
sites (for example, at discussion boards) without our written permission
is prohibited.
We reserve the right to immediately
terminate the subscription of any TSI subscriber who distributes the TSI
commentaries without our written permission.
True
Fundamentals Summary
[Notes:
1) The date shown next to the current True Fundamentals Model (TFM) signal is
when the most recent change occurred. 2) Charts of the Gold and Equity
TFMs are included in the "Charts and Indicators" section of the TSI web
site]
| Market | True Fundamentals Model (TFM) |
| Gold (US$ Price) | Bearish (12 Jan 2018) |
| US Equity (SPX) | Bullish (13 Apr 2018) |
| Currency (Dollar Index) | Bullish (15 Dec 2017) |
| Commodities (GNX) | Bullish (29 Dec 2017) |
Last week's posts at the TSI Blog
Trade as a
zero sum game
The
short that keeps on giving?
Summary of current
thinking/positioning
1) A number of markets are set
up for trend reversals or accelerations, with the US$ being the linchpin.
If the DX breaks out to the downside from its recent narrow range, rallies
should begin or accelerate across the commodity world with silver bullion
and gold-mining stocks leading the way higher. However, if the DX breaks
out to the upside from its recent range then the commodity world will be
pressured downward for at least a few weeks thereafter.
2) The SPX
is about to either end its correction by completing a successful test its
early-February low (2530) or escalate the significance of the January-2018
top by breaking to a new low for the year. The former outcome is the more
likely, but there remains the threat of a trend-ending plunge to a new low
for the year.
3) There are signs that the multi-year upward trend
in commodity prices that got underway in early-2016 has resumed.
4) Government bond prices are in long-term downward trends and will go
much lower before year-end, but a counter-trend rebound is underway. We
expect the next downward leg in the bond bear market to begin within the
next few weeks, but due to the huge speculative net-short position in
10-year T-Note futures we aren't yet interested in placing a new bearish
bet.
5) Holding a cash reserve of around 30%.
A dramatic upward
reversal in US monetary inflation
In February of this year the
year-over-year rate of growth in the US True Money Supply, a.k.a. the US
monetary inflation rate, was only 2.4%. This was its lowest level since
March of 2007 and not far from a multi-decade low. In March of this year,
however, the monetary inflation rate almost doubled -- to around 4.6%.
Refer to the following chart for more detail. What caused the reversal and
what effect will it have on the economy and the financial markets?
The Fed has been slowly removing money from the economy via its QT
program, so March's money-supply surge wasn't caused by the central bank.
The main cause also wasn't the commercial banking industry, because
although there has been an up-tick in the rate of bank credit expansion
over the past month it is nowhere near enough to explain the increase in
TMS.
We can't be certain, but by a process of elimination we
conclude that the sharp upward reversal in the US monetary inflation rate
was due to money coming into the US from overseas. If so, the most likely
driver would be the repatriation of corporate profits due to the tax
changes approved near the end of last year.
In other words, it's
likely that March's TMS surge was due more to the way that the banking
system accounts for existing US dollars than an increase in the total
supply of US dollars.
If the monetary inflation reversal has more
to do with a change in the way existing US dollars are accounted for than
a sudden large increase in the pace of new dollar creation, then the
effects on the economy and the financial markets will be minimal. In any
case, after the monetary inflation rate has moved high enough for long
enough to set in motion an artificial boom, a drop to a relatively low
inflation level will inevitably lead to a bust (an economic recession and
a large decline in the stock market, often accompanied by a banking
crisis). For example, the pronounced rebound in the TMS growth rate from
Q4-2006 to Q3-2007 did not stop the recession, the equity bear market and
the banking crisis of 2007-2009.
This means that as a result of the
2017 decline in the monetary inflation rate to near a 20-year low, the die
has been cast.
The big unknown right now is the timing of the bust
that will occur in response to last year's precipitous decline in the
monetary inflation rate. Will it get underway during the second half of
this year or will it wait until next year?
Interest Rates
The on-going LIBOR surge
The relentless rise over the past few months in the London InterBank
Offered Rate (LIBOR), a short-term interest rate for interbank lending and
a popular benchmark, has garnered a lot of attention in the press.
The first of the following charts shows that 3-month LIBOR made a new
9-year high at the end of last week. The rise in LIBOR is mostly a
reflection of the general rise in short-term interest rates, although the
second of the following charts suggests that there is a little more to it.
The second chart shows that the spread between 3-month LIBOR and the
3-month T-Bill yield has moved up to the top of its narrow 9-year
horizontal range. In other words, the main 3-month interest rate used by
banks when trading with each other has risen relative to the 3-month
interest rate paid by the US government.
We think that the rise in the LIBOR-TBill spread has the same primary
cause as the recent surge in US TMS: changes in US tax regulations that,
among other things, have created a short-term incentive for money to flow
into the US. Some of the money that US corporations had loaned to banks
outside the US has been removed from this market, forcing the banks to
offer higher interest rates to attract short-term funding.
Therefore, it seems to us that the rise in the LIBOR-TBill spread and
other LIBOR spreads is NOT a signal that a banking crisis is brewing.
The 'real' interest rate remains range-bound
The yield on the 10-year TIPS (Treasury Inflation-Protected Security) is a
proxy for the real US 10-year interest rate. It is, in effect, the nominal
10-year interest rate minus the expected change in the CPI.
As
illustrated below, since mid-2013 the 10-year TIPS yield has oscillated
between 0% and 0.8%. It has recently turned down after touching the top of
this range, but remains near a 5-year high.
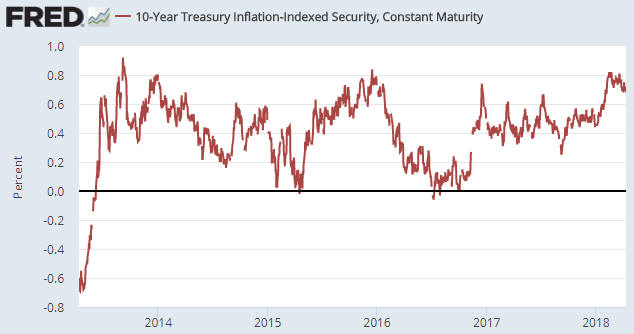
If the 10-year TIPS yield were to break upward from its multi-year
range it would put significant and potentially irresistible downward
pressure on the prices of gold, commodities and equities, but over the
next few months the real interest rate will more likely trend downward
than break out to the upside. This will be due to inflation expectations
rising faster than nominal interest rates.
Oil
Oil negates the
double-top scenario
The oil price ended the week before
last at the bottom of a 2-month channel, having potentially completed a
double top near $66. Last week, however, it invalidated the double top
idea by breaking above its January and March highs. It also reached the
top of its short-term channel, so don't jump to the conclusion that the
break above lateral resistance implies significant additional gains.
We now view oil's price action as neutral. At the same time, the
sentiment situation remains bearish (the total speculative net-long
position in oil futures remains near an all-time high) and, as discussed
below, the fundamentals remain bullish. The oil market is therefore a
'mixed bag'.
Oil fundamentals stay bullish
It's worth repeating that for an industrial commodity with a large and
liquid futures market, such as oil, the "term structure" in the futures
market (a.k.a. the futures curve) is the most reliable indicator of the
supply-demand situation.
An upward-sloping futures curve is called
"contango" and is the normal state of affairs. In this normal state of
affairs a more distant futures contract will have a higher price because
of the cost of storage and financing, not because traders expect the price
to be higher in the future.
When the curve flattens in most cases
it means that the physical supply situation is getting tighter. This is
because if the gap between a futures price and the spot price falls to the
point where it is less than the cost of storage, then a risk-free
arbitrage opportunity will be presented to the owners of physical supply.
They can sell their physical oil, buy the futures and make a guaranteed
profit equal to the cost that they would have paid for storage minus the
difference between the futures price they paid and the spot price they
received.
Sometimes the futures curve doesn't just flatten, it
inverts; that is, the curve becomes downward-sloping. This is called
backwardation. When the oil market is well into "backwardation" it means
that a substantial risk-free profit is being offered to the owners of
physical supply who are able to do the trade described above.
Since
risk-free profit opportunities tend to be fleeting, the only way that
"backwardation" can be sustained is if very few owners of physical supply
are in a position to do the trade described above. In other words,
sustained "backwardation" implies a market with minimal surplus supply,
either because inventory levels are low or because the current owners of
the physical supply are unwilling to relinquish ownership even when
presented with a large financial incentive to do so.
Here are four
charts that show the change in the oil market's futures curve over the
past ten months. The first chart shows the situation at 20th June 2017.
This is a picture of a normal, well-supplied market. The second chart
shows the situation at 16th August 2017, by which time the curve had
flattened markedly. This implies that oil's supply situation tightened
between 20th June and 16th August, 2017, but the fact that the curve still
had an upward slope suggests that there was no shortage in mid-August of
last year. The third chart shows the situation at 8th November 2017. This
is a picture of a market in which you get paid significantly more to
deliver a barrel of oil today than to store the barrel and deliver it a
year from now, which implies a significant supply shortage. The fourth
chart shows the current situation. It indicates that the fundamental
supply-demand situation is even more bullish now than it was in
early-November of last year.
Oil's fundamentals are unequivocally bullish, but speculative
sentiment is very extended into optimistic territory. This has been the
case for many months now. The sentiment situation keeps warning "high risk
of a significant price decline" while the fundamental situation keeps
saying "a downward price correction could occur, but it won't get very
far".
The Stock Market
A "Dow Theory" sell signal
occurs when both the Dow Industrials Index (INDU) and the Dow
Transportation Average (TRAN) experience significant initial declines from
their highs, rebound to lower highs and then close below the closing lows
of their initial declines. Such a signal was generated last Monday (9th
April) when TRAN closed marginally below its 9th February low, INDU having
already closed below its February low during the second half of March.
Here's a picture of the recent Dow Theory sell signal:
Is the Dow Theory sell signal an important development?
The
answer is no; it's meaningless. Even if there had been follow-through to
the downside, Dow Theory signals are not reliable indicators of the
future. And as things currently stand there has been no follow-through to
the downside. Both the INDU and the TRAN ended last week above their
breakdown levels.
While the TRAN is definitely worthy of our
attention, the NASDAQ100 Index is vastly more important these days. As
illustrated below, the NASDAQ100 Trust (QQQ) has not yet closed below, or
even traded below, its early-February closing low.
The evidence continues to support the bull-market correction scenario.
In fact, the evidence in support of this scenario increased last week due
to our Equity True Fundamentals Model (ETFM) shifting from bearish to
bullish. This shift was caused by a contraction in credit spreads and a
decline in the 10-year TIPS yield.
Our own account now has two
small bearish speculations, both of which will be kept on a tight leash.
We have some QQQ June-2018 put options that will be exited if QQQ achieves
consecutive daily closes above its 50-day MA and some Tesla (TSLA)
June-2018 put options that will be exited if TSLA achieves consecutive
daily closes above $310.
This week's
significant US economic events
[Notes:
1) The most important events
(to the markets) are shown
in bold. 2) A list of global economic events can be found
HERE]
| Date | Description |
| Monday Apr-16 |
Retail Sales Business Inventories Housing market Index TIC Report |
| Tuesday Apr-17 |
Housing Starts Industrial Production |
| Wednesday Apr-18 | Fed's Beige Book |
| Thursday Apr-19 | No important events scheduled |
| Friday Apr-20 | No important events scheduled |
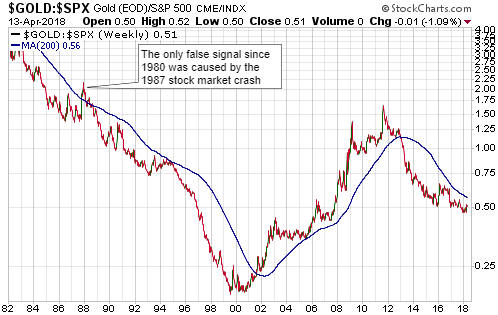
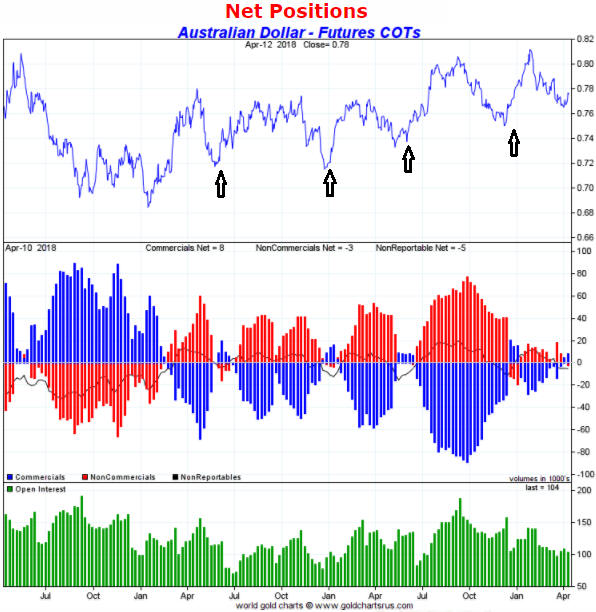
Gold and the Dollar