|
-- for the Week Commencing 16th June 2003, 2nd Page
Gold and
the Dollar
Gold Stock Valuation Comparison
About once every quarter we do a valuation
comparison of some of the large and mid-size gold producers. In the past
when we've done this we've compared ratios such as price/earnings, price/sales
and market price per reserve ounce using information contained in the latest
quarterly reports. We've also looked at how each company's price/earnings
ratio would be affected by an increase in the gold price in order to compare
the amount of leverage offered by the stocks.
This time, though, we are going to
compare relative values using a different approach. Rather than focusing
on price/earnings ratios and considering how earnings will be impacted
by an increase in the gold price as we've done in the past, we are going
to focus on the option value of each gold stock. By this we mean we are
going to determine what a gold mining company is worth by calculating the
value of its gold reserves at various gold prices. This approach is actually
a modified version of the one used by John Doody, editor of the Gold Stock
Analyst newsletter, with the main difference being that we use the total
production cost in our calculations whereas Mr Doody uses the "cash cost"
reported by the companies. We prefer to use total cost per ounce, rather
than cash cost, because there are inconsistencies in the way different
companies report their cash costs and because it is the total cost, not
the cash cost, that determines how much shareholder wealth is generated.
(Note: We calculate the total cost to produce an ounce of gold by deducting
earnings from revenue and then dividing the result by the total number
of ounces produced. In this way we are sure to capture ALL costs in our
calculations.)
In the below tables EV stands for "enterprise
value" and TEV stands for "theoretical enterprise value". The enterprise
value for each company is calculated by adding the company's net debt to
its stock market capitalisation, where net debt is total debt minus cash
minus the marked-to-market value of any gold hedges. In other words, EV
represents the current total market value of each company. TEV, on the
other hand, is what each company's gold reserves are theoretically worth
at a particular gold price. It is calculated by multiplying a company's
net profit margin per ounce of gold (the assumed gold price minus the total
cost to produce an ounce of gold) by that company's total proven and probable
reserves. For this exercise we've calculated each company's TEV at $350,
$425 and $500 and also calculated the percentage change that would be needed
to bring the current market price into line with the calculated TEV. In
other words, the percentages shown in the final three columns reflect the
gain that the market would bestow on each stock at various gold prices
if the valuation criteria we have used in compiling this table were the
market's only consideration.
In the first table the companies are
shown in order value, from best value at the top to worst value at the
bottom, assuming a gold price of $350. In the second table the companies
are once again shown in order of value, but this time assuming a gold price
of $500.
| Company
Name |
Symbol |
Recent
Price (US$) |
Ent.
Value (US$M) |
2003
Prodn. (Koz) |
Total
Cost per ounce |
Resv.
(Moz) |
EV
$ per oz Res. |
TEV
at $350 |
TEV
at $425 |
TEV
at $500 |
Gain
at $350 |
Gain
at $425 |
Gain
at $500 |
| Harmony Gold |
HMY |
13.94 |
2473 |
3096 |
288 |
49.0 |
50 |
3032 |
6707 |
10382 |
23% |
171% |
320% |
| Randgold Resources |
GOLD |
17.73 |
439 |
380 |
171 |
2.9 |
151 |
521 |
739 |
957 |
19% |
68% |
118% |
| Gold Fields Ltd |
GFI |
12.44 |
5785 |
4360 |
293 |
79.0 |
73 |
4512 |
10437 |
16362 |
-22% |
80% |
183% |
| Wheaton River |
WHT |
1.16 |
672 |
800 |
301 |
7.7 |
87 |
375 |
953 |
1530 |
-44% |
42% |
128% |
| Anglogold |
AU |
31.34 |
7820 |
5600 |
292 |
72.0 |
109 |
4204 |
9604 |
15004 |
-46% |
23% |
92% |
| Lihir Gold |
LHG |
0.93 |
1082 |
600 |
317 |
16.7 |
65 |
557 |
1809 |
3062 |
-49% |
67% |
183% |
| Northgate Exploration |
NGX |
1.12 |
283 |
450 |
316 |
3.8 |
74 |
131 |
416 |
701 |
-54% |
47% |
148% |
| Newmont |
NEM |
32.07 |
14244 |
7200 |
294 |
87.0 |
164 |
4833 |
11358 |
17883 |
-66% |
-20% |
26% |
| IAMGOLD |
IAG |
5.14 |
696 |
430 |
286 |
3.6 |
193 |
230 |
500 |
770 |
-67% |
-28% |
11% |
| Barrick Gold |
ABX |
18.19 |
9994 |
5450 |
313 |
87.0 |
115 |
3217 |
9742 |
16267 |
-68% |
-3% |
63% |
| Glamis Gold |
GLG |
11.79 |
1329 |
250 |
276 |
5.4 |
246 |
400 |
805 |
1210 |
-70% |
-39% |
-9% |
| Goldcorp |
GG |
11.74 |
2122 |
536 |
243 |
5.5 |
386 |
591 |
1004 |
1416 |
-72% |
-53% |
-33% |
| Meridian Gold |
MDG |
11.3 |
980 |
320 |
241 |
2.1 |
467 |
230 |
387 |
545 |
-77% |
-60% |
-44% |
| Agnico Eagle |
AEM |
11.68 |
1064 |
375 |
301 |
4.0 |
266 |
195 |
495 |
795 |
-82% |
-54% |
-25% |
| Kinross Gold |
KGC |
6.96 |
2105 |
1900 |
329 |
15.0 |
140 |
316 |
1441 |
2566 |
-85% |
-32% |
22% |
| Durban Deep |
DROOY |
2.61 |
543 |
1000 |
350 |
16.3 |
33 |
0 |
1223 |
2445 |
-100% |
125% |
350% |
| Company
Name |
Symbol |
Recent
Price (US$) |
Ent.
Value (US$M) |
2003
Prodn. (Koz) |
Total
Cost per ounce |
Resv.
(Moz) |
EV
$ per oz Res. |
TEV
at $350 |
TEV
at $425 |
TEV
at $500 |
Gain
at $350 |
Gain
at $425 |
Gain
at $500 |
| Durban Deep |
DROOY |
2.61 |
543 |
1000 |
350 |
16.3 |
33 |
0 |
1223 |
2445 |
-100% |
125% |
350% |
| Harmony Gold |
HMY |
13.94 |
2473 |
3096 |
288 |
49.0 |
50 |
3032 |
6707 |
10382 |
23% |
171% |
320% |
| Lihir Gold |
LHG |
0.93 |
1082 |
600 |
317 |
16.7 |
65 |
557 |
1809 |
3062 |
-49% |
67% |
183% |
| Gold Fields Ltd |
GFI |
12.44 |
5785 |
4360 |
293 |
79.0 |
73 |
4512 |
10437 |
16362 |
-22% |
80% |
183% |
| Northgate Exploration |
NGX |
1.12 |
283 |
450 |
316 |
3.8 |
74 |
131 |
416 |
701 |
-54% |
47% |
148% |
| Wheaton River |
WHT |
1.16 |
672 |
800 |
301 |
7.7 |
87 |
375 |
953 |
1530 |
-44% |
42% |
128% |
| Randgold Resources |
GOLD |
17.73 |
439 |
380 |
171 |
2.9 |
151 |
521 |
739 |
957 |
19% |
68% |
118% |
| Anglogold |
AU |
31.34 |
7820 |
5600 |
292 |
72.0 |
109 |
4204 |
9604 |
15004 |
-46% |
23% |
92% |
| Barrick Gold |
ABX |
18.19 |
9994 |
5450 |
313 |
87.0 |
115 |
3217 |
9742 |
16267 |
-68% |
-3% |
63% |
| Newmont |
NEM |
32.07 |
14244 |
7200 |
294 |
87.0 |
164 |
4833 |
11358 |
17883 |
-66% |
-20% |
26% |
| Kinross Gold |
KGC |
6.96 |
2105 |
1900 |
329 |
15.0 |
140 |
316 |
1441 |
2566 |
-85% |
-32% |
22% |
| IAMGOLD |
IAG |
5.14 |
696 |
430 |
286 |
3.6 |
193 |
230 |
500 |
770 |
-67% |
-28% |
11% |
| Glamis Gold |
GLG |
11.79 |
1329 |
250 |
276 |
5.4 |
246 |
400 |
805 |
1210 |
-70% |
-39% |
-9% |
| Agnico Eagle |
AEM |
11.68 |
1064 |
375 |
301 |
4.0 |
266 |
195 |
495 |
795 |
-82% |
-54% |
-25% |
| Goldcorp |
GG |
11.74 |
2122 |
536 |
243 |
5.5 |
386 |
591 |
1004 |
1416 |
-72% |
-53% |
-33% |
| Meridian Gold |
MDG |
11.3 |
980 |
320 |
241 |
2.1 |
467 |
230 |
387 |
545 |
-77% |
-60% |
-44% |
Notes and conclusions:
1. According to the above tables, HMY
and GOLD are the only stocks that are under-valued at their current stock
prices assuming a gold price of $350. However, the tables should be viewed
as a rough guide of relative value rather than as an accurate representation
of absolute value. This is because investors don't just take into account
the current value of reserves when assessing what a gold stock is worth.
For example, our table doesn't take potential reserve or production growth
into account, although this will be an important consideration for most
investors. Also, there will generally be some premium in the price of a
gold stock to reflect the possibility that the gold price will be higher
at some future time than it is now.
2. At current exchange rates and a
gold price of US$350 Durban Deep cannot make a profit, therefore at this
gold price its TEV is zero. In other words, if we knew with 100% certainty
that the gold price would always be US$350 or lower and that the US$/Rand
exchange rate would always be 7.8 or lower, then Durban would effectively
be worthless. The value of Durban is, of course, in the potential for a
spectacular increase in earnings if there is a substantial improvement
in the gold price, as reflected in the second table.
3. With one exception (see below),
the percentage increases in market value at gold prices of $425 and $500
will tend to be under-stated. This is because we haven't taken into account
the increases in reserves that would occur at the higher gold prices. (A
substantial increase in the gold price typically results in an increase
in reserves because at the higher gold price it becomes economically feasible
to mine resources that were previously considered to be uneconomic).
4. There is a distinct possibility
that the percentage increase in the ABX stock price at $500 would be lower
than that shown in the above tables due to its large hedge book. For example,
if the gold price rose from $350 to $500 then the negative marked-to-market
value of ABX's hedge book would increase by around US$2.5B. In the above
tables we've only taken into account the current marked-to-market value
of ABX's hedge book.
5. We haven't considered the effects
of exchange rate changes on company revenues and costs. It is, however,
extremely likely that any substantial rise in the gold price would be accompanied
by substantial weakness in the US$, thus partially offsetting the benefit
of the higher US$ gold price for those companies which have most of their
operations outside the US.
6. When both current value and leverage
are taken into account, HMY looks very attractive. In our opinion, HMY
should be the first choice for anyone wanting exposure to a major SA gold
producer. GFI also looks attractive. Despite its excellent leverage we
would avoid Durban due to the risks associated with this company. We don't
see any reason to take the risk of owning Durban when Harmony offers almost
as much leverage but has better assets, a stronger balance sheet and vastly
superior management.
7. Randgold Resources (NASDAQ: GOLD)
scored very well in terms of current value, although its low cost of production
means it offers less leverage to the gold price than several other producers.
The Morila mine in Mali is one of the world's best gold mining assets (GOLD
owns 40% of Morila). Furthermore, GOLD has a very strong balance sheet
and excellent potential to grow its reserves. The good relative value offered
by the shares can, however, probably be explained by the 'Kebble factor'.
Roger Kebble is the chairman of GOLD and, in the past, companies controlled
by the Kebble family have tended to be run more for the benefit of the
Kebbles than for the benefit of shareholders in general.
8. Northgate Exploration (TSX: NGX)
and Wheaton River (TSX: WRM, AMEX: WHT) both scored quite well in terms
of current value and leverage. Furthermore, both of these stocks offer
significant exposure to copper as well as gold. (Note: These companies
report copper production as a by-product of gold production, that is, copper
revenues are used to offset the cost of gold production in the companies'
financial reports. However, the above tables were prepared as though copper
was a co-product, that is, the gold-equivalent of each company's copper
production and copper reserves have been added to their gold production
and gold reserves to determine the figures for the above tables). Of the
two, NGX probably has the greater upside potential. This is because its
Kemess North project, which has not been taken into account for the purposes
of our comparison since resources are yet to be converted to reserves,
is likely to provide a large addition to reserves over the next 1-2 years.
We like NGX near its current price.
9. MDG, GG, AEM and GLG all scored
poorly in terms of both current value and leverage. The main problem with
each of these stocks is the low amount of gold reserves relative to market
capitalisation, so the valuation problem could be addressed via additional
exploration success and/or the conversion of existing resources to reserves.
In fact, the high current valuations suggest that the market is already
anticipating substantial additions to reserves. In this regard, GLG and
GG appear to have better prospects than AEM and MDG.
10. KGC did not score well in our valuation
analysis, primarily because the first set of results issued by the post-merger
Kinross were poor. If we assume that KGC's management will be able to generate
a much better operational performance in the future then KGC would look
far more attractive from a valuation perspective. However, we have no basis
on which to make such an assumption.
11. As discussed in the latest Interim
Update, valuation is often not an important driver of stock price in the
short or even the medium-term. In fact, it is not uncommon for stocks to
remain over-valued or under-valued for years at a time before a valuation
discrepancy is addressed by the market. Also, a stock that seems 'cheap'
or 'expensive' might be priced that way for a reason that is not readily
apparent based solely on a review of the publicly-available data. As such,
we wouldn't be surprised if some of the relatively over-valued stocks in
the above table out-performed some of the relatively under-valued stocks
over the next 6 months. We have found, however, that if we are not confident
that a stock we own offers reasonable value then we are vulnerable to being
'shaken out' of the position at the first sign of price weakness.
Gold Stocks - Technical Update
Below are charts of the Amex Gold BUGS
Index (HUI) and the HUI/gold ratio. Gold stocks have now spent 12 months
consolidating in dollar terms and in terms of the gold price.
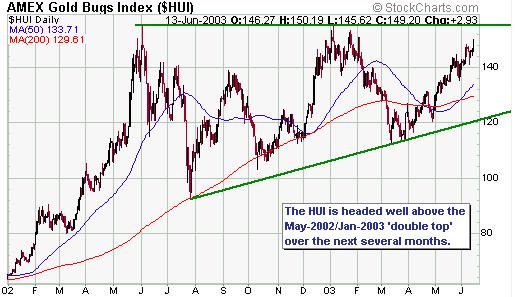
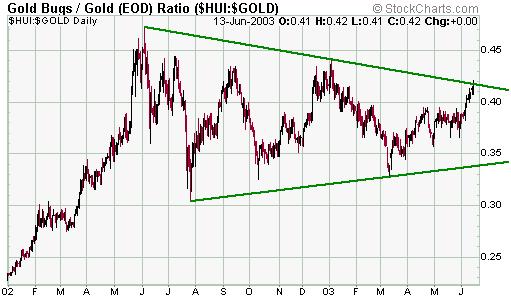
Upside breakouts in the above charts
are highly probable over the next several months. In fact, it is likely
that the HUI will trade in the 200-250 range before the end of this year.
As far as we are concerned, the main question that remains to be answered
is whether the upside breakouts will occur over the coming few weeks (scenario
'a') or whether there will be another sharp pullback before a major advance
begins (scenario 'b').
When we originally described scenario
'b' we were talking in terms of the HUI dropping all the way back to the
100-110 range before a major advance to new highs got underway. However,
we think the odds are now strongly against a decline of that magnitude,
primarily because the HUI has just moved up to within 5 points of a new
6-year high but gold investors don't seem the slightest bit exuberant and
the mainstream financial press is taking no notice. Everyone is talking
about the stock market. "Is this a new bull market?" "Gee, the tape action
and the market's internals look strong!" "Is it too late to buy tech stocks?"
"Should I buy tech/natural-gas/homebuilding/banking stocks now or wait
for a pullback?" Meanwhile the gold sector, which is clearly in a long-term
bull market, gets ignored. As such, there probably aren't a lot of weak
hands in the market with jittery fingers ready to click the SELL button
at the first sign of trouble. Therefore, the worst case is probably a drop
to near the uptrend-line shown on the above chart.
Currency and Gold Market Update
The below chart shows that the Swiss
Franc has broken its short-term downtrend. A test of this year's peak is
therefore likely in the near-term.
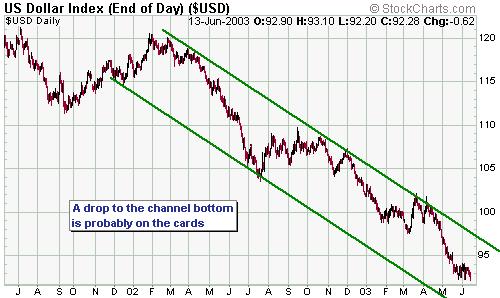
In the 4th June Interim Update we said
"...on an anecdotal level the fact that almost everyone - dollar bears
and dollar bulls - expects the dollar to rebound from current levels might
be a sign that a decisive break below the recent lows is going to occur
before a decent rebound gets underway." We've also stated that a drop,
by the Dollar Index, to the bottom of its 2-year channel (see chart below)
represents the maximum downside risk in the short-term. The channel bottom
would currently be reached with a drop in the cash Dollar Index to around
89, so given Friday's upside breakout by the Swiss Franc and despite the
recent weakness in the gold price it appears as though the Dollar Index
is going to spike below 90 before a substantial rebound gets underway.
Below is a daily chart of August gold
futures. The move below the 18-day moving-average at the beginning of last
week was predictably followed by a quick drop. However, when we consider
what is currently happening in the currency market and in the gold sector
of the stock market we see no reason to be bearish on gold despite its
recent break below short-term support. As stated in last week's Interim
Update, gold has good support in the $340-$345 range and given the recent
strength in gold shares this support is likely to hold. In fact, there
is a reasonable chance it won't even be tested.
Once again we'll look to the performance
of the gold price relative to its 18-day moving average for clues as to
what to expect in the short-term, simply because this moving average has
done such a good job of defining support and resistance over the past 7
months. With reference to the below chart, notice that after the gold price
closed below its 18-day moving average (the green line) in early-February
it was not able to achieve consecutive daily closes above this MA until
mid-April. As such, we'll consider consecutive daily closes above the 18-day
moving average to be evidence that a bottom is in place and that a new
short-term uptrend is underway.
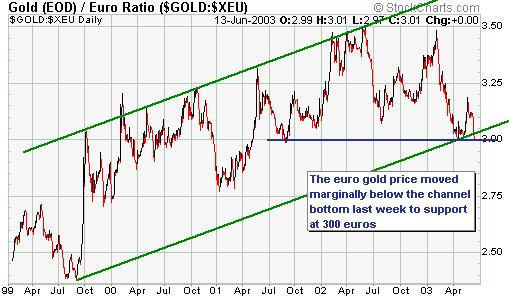
Below is a chart of the gold price
in terms of the euro. The euro gold price has just moved marginally below
its long-term channel bottom, a bearish development if there is some follow-though
to the downside. The more likely outcome, however, is that gold will strengthen
relative to the euro over the next few weeks, thus avoiding a break in
the long-term uptrend.
In summary, here's what we have:
a) The gold price has moved as low
as it can go against both the euro and the S&P500 Index without causing
long-term price channels to be broken.
b) The Dollar Index looks weak and
appears to have short-term downside risk of 3-4%.
c) Gold stocks have recently been strong
relative to the gold price and relative to the S&P500 Index.
In the short-term (the next few weeks)
it is therefore likely that gold will rise in US$ and euro terms and it
will rise relative to the S&P500 Index. As discussed above, we'll be
watching the performance of gold relative to its 18-day MA for confirmation
that a new short-term uptrend is in progress. Also, although it is going
to have to fight its central bank every step of the way we expect that
the Yen will benefit from future dollar weakness to a greater extent than
either the euro or the SF. There are a few reasons why Yen strength relative
to the euro makes sense here, one being that while the euro looks extremely
overbought from a medium-term perspective the Yen has spent the past 2
years building the sort of base that could support a large rise.
Update
on Stock Selections
 Last
week's drop to the mid-4.40s might be 'all she wrote' as far as the latest
pullback in the silver price is concerned. If this is the case then the
silver price is about to move up to resistance in $4.80-$4.90 range. Last
week's drop to the mid-4.40s might be 'all she wrote' as far as the latest
pullback in the silver price is concerned. If this is the case then the
silver price is about to move up to resistance in $4.80-$4.90 range.
The pattern that has been followed
by silver over the past year is similar to a pattern we've seen in other
markets. Based on what happened in these other markets we think the next
move to 4.80-4.90 will result in an upside breakout and that silver will
surprise most traders (most traders will assume that 4.80-4.90 is going
to hold) by not only moving above 4.90 but also moving well above 5.20.
So, it is worth having some exposure to silver here. As advised in the
past, one of the best ways to do this is to buy shares in Western Silver
(TSX: WTC, AMEX: WTZ).
Aquiline
Resources (TSXV: AQI) recently commenced a drill program at its Calcatreu
gold project in Argentina, so there should be a steady stream of news from
AQI over the next several months. Due to AQI's small market cap of around
US$5M, good results from the drill program would likely have a substantial
effect on the stock price.
The
QQQ June $24 put options in the TSI Stocks List will expire worthless at
the end of this week. The QQQ December $25 puts (QAVXY) recently added
to the List are, however, likely to fare much better. We like the risk/reward
on these options at their current price of around US$0.80.
Chart Sources
Charts appearing in today's commentary
are courtesy of:
http://stockcharts.com/index.html
http://www.futuresource.com/

|
