|
-- Weekly Market Update for the Week Commencing 16th June 2008
Big Picture
View
Here is a summary of our big picture
view of the markets. Note that our short-term views may differ from our
big picture view.
Bonds commenced a secular BEAR market in
June of 2003. (Last
update: 22 August 2005)
The stock market, as represented by the S&P500 Index, commenced
a secular BEAR market during the first quarter of 2000, where "secular
bear market" is defined as a long-term downward trend in valuations
(P/E ratios, etc.) and gold-denominated prices. This secular trend will bottom sometime between 2014 and 2020. (Last update: 22 October 2007)
The Dollar commenced a secular BEAR market during the final quarter of 2000. The
first major downward leg in this bear market ended during the first
quarter of 2005, but a long-term bottom won't occur until 2008-2010. (Last update: 28 March 2005)
Gold commenced a
secular bull market relative to all fiat currencies, the CRB Index,
bonds and most stock market indices during 1999-2001. This secular trend will peak sometime between 2014 and 2020. (Last update: 22 October 2007)
Commodities, as
represented
by the CRB Index, commenced a secular BULL market in 2001. The first
major upward leg in this bull market ended during the second quarter of
2006, but a long-term
peak won't occur until at least 2008-2010. (Last update: 08 January 2007)
Copyright
Reminder
The commentaries that appear at TSI
may not be distributed, in full or in part, without our written permission.
In particular, please note that the posting of extracts from TSI commentaries
at other web sites or providing links to TSI commentaries at other web
sites (for example, at discussion boards) without our written permission
is prohibited.
We reserve the right to immediately
terminate the subscription of any TSI subscriber who distributes the TSI
commentaries without our written permission.
Outlook Summary
Market
|
Short-Term
(0-3 month)
|
Intermediate-Term
(3-12 month)
|
Long-Term
(1-5 Year)
|
Gold
|
Neutral
(02-Jun-08)
|
Bullish
(12-May-08)
|
Bullish
|
US$ (Dollar Index)
|
Bullish
(16-Jun-08)
| Bullish
(31-May-04)
|
Neutral
(19-Sep-07)
|
Bonds (US T-Bond)
|
Neutral
(03-Mar-08)
|
Neutral
(19-May-08)
|
Bearish
|
Stock Market (S&P500)
|
Neutral
(02-Jun-08)
|
Bearish
(12-May-08)
|
Bearish
|
Gold Stocks (HUI)
|
Neutral
(02-Jun-08)
|
Bullish
(12-May-08)
|
Bullish
|
| Oil | Neutral
(09-Jun-08)
| Bearish
(22-Oct-07)
| Bullish
|
Industrial Metals (GYX)
| Bearish
(05-May-08)
| Bearish
(09-Jul-07)
| Bullish
|
Notes:
1. In those cases where we have been able to identify the commentary in
which the most recent outlook change occurred we've put the date of the
commentary below the current outlook.
2. "Neutral", in the above table, means that we either don't have a
firm opinion or that we think risk and reward are roughly in balance with respect to the timeframe in question.
3. Long-term views are determined almost completely by fundamentals,
intermediate-term views by giving an approximately equal weighting to
fundmental and technical factors, and short-term views almost
completely by technicals.
Returning to gold as money
...if
left to its own devices the market will choose gold, or the combination
of gold and silver, as money... ...Apart from the government/bank
alliance's desire to maintain control of the money supply, ignorance is
the biggest obstacle facing the return of gold to its traditional
monetary role.
A lot of the world's problems stem from the abilities of the government
and the banking system (the central bank and the private banks) to
inflate the supply of money. This is because the inflation: a) distorts
price signals, leading to the misdirection of valuable resources and
slower economic growth, b) supports the expansion of government power
and thus leads to a less-free society, c) benefits leveraged
speculators and the asset-rich at the expense of conservative savers
and the asset-poor, leading to greater wealth disparities than would
otherwise exist and to resentment amongst those who are on fixed
incomes or at the bottom half of the economic ladder, and d) supports
the militaristic objectives of governments. The problem of inflation
would not occur, however, if gold were the general medium of exchange
because governments and banks cannot create gold. This prompts the
following questions:
1. How can we get from where we are now to the point where gold is money?
2. Will gold return to its historical role as the general medium of exchange within the foreseeable future?
The first question is easy to answer. Most serious advocates of
returning gold to its position as the official currency of the realm
concoct detailed plans as to how a gold-based monetary system should be
structured and implemented, but if gold truly is the best money then
such plans are neither required nor desirable. All that would have to
happen is the abolition of the central bank and legal tender laws, thus
leaving the market free to choose the general medium of exchange. If
gold is, as we believe, ideally suited to perform the monetary role,
then market forces would inevitably cause it to recapture this role if
such forces were allowed to operate.
Gresham's Law states that bad money chases out good money, but
Gresham's Law only applies when legal tender laws force people to
accept the bad money at face value. In the absence of legal tender laws
the good money will chase out the bad because people will refuse to
accept the bad money in exchange for their valuable goods, services and
assets.
In other words, if gold is the best form of money then returning gold
to its monetary role will not require any additional laws or
institutions. It will, instead, simply require the removal of some
existing laws and institutions. In particular, there should be nothing
in a country's constitution that specifies what the general medium of
exchange should be, and the government should certainly NOT be granted
the power to coin or print money or to otherwise exert influence over
the supply of money. For example, the writers of the US Constitution
committed a grave error when they stipulated what the money should be
(gold and silver coin) and granted Congress the monopolistic right to
coin new money, because in doing so they unwittingly opened the door to
the monetary mischief that has since occurred. If the US Constitution
had said anything at all about money it should have said something
along the lines of: "The government shall stay completely out of the
money business".
The bottom line is that there should not be any "official" money. Based
on thousands of years of history we can be very confident that if left
to its own devices the market will choose gold, or the combination of
gold and silver, as money, but the main point is that the market must
be left to its own devices.
By the way, we don't mean to imply that the transition from the current
government-managed monetary system to a new system based solely on
market forces would be simple, smooth and painless. Mountains of debt
and derivatives have been amassed on the premise that there will always
be plenty of monetary inflation, so it might be necessary to phase the
central bank out over 5-10 years rather than eliminate it in one fell
swoop.
The second question is impossible to answer. Governments and banks will
never willingly give up the right to create new money, so the only way
that gold could ever again become the general medium of exchange is
following the total collapse of the current system. In other words, it
is very unlikely that the control of money could ever be wrested from
the government and returned to the free market in the absence of a
total monetary breakdown. And even then, there is no guarantee that a
gold-based system would rise from the ashes of our current system.
Apart from the government/bank alliance's desire to maintain control of
the money supply, ignorance is the biggest obstacle facing the return
of gold to its traditional monetary role. The vast majority of people,
including some intelligent and thoughtful people, believe the dual
fallacies that the supply of money must grow at a certain rate to
support economic growth and that in times of stress the government can
help the economy by increasing its borrowing/spending (financed by
increasing the money supply). Also, very few people understand the link
between the rising prices that they complain about and the increase in
the supply of money, a lack of understanding that the representatives
of governments and central banks take every opportunity to nurture. For
example, the statements emanating from this weekend's meeting of G8
finance ministers were worded as if rising commodity prices were the
CAUSE of the problem rather than a SYMPTOM of what was happening to
money (as far as we can tell, the increase in the supply of money was
not even mentioned). For another example, at this same meeting US
Treasury Secretary Henry Paulson should have 'brought the house down'
when, according to this article,
he "urged countries to let markets work, not rely on subsidies". This
really was a funny thing for him to say given that the subsidies and
tariffs put in place to protect the US ethanol and sugar-growing
industries are probably the second most important cause of rising grain
prices. The image of a pot pointing at a kettle and yelling "You're
black!" springs to mind, and yet most people take such statements at
face value.
For some strange reason, despite the continual flood of lies spewing
forth from the halls of government and the mountain of evidence that
economic well-being and freedom from government meddling are positively
correlated, there is a general distrust of the free market.
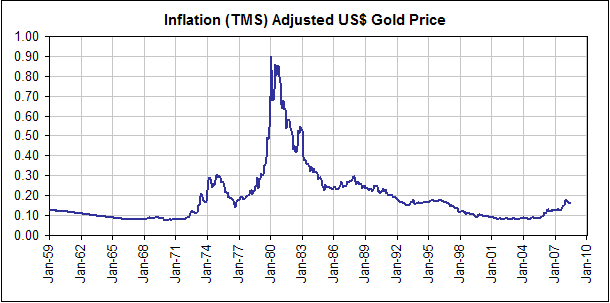
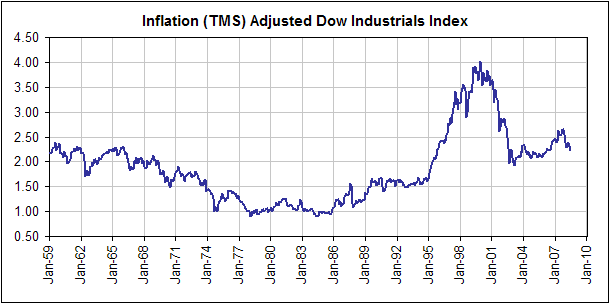
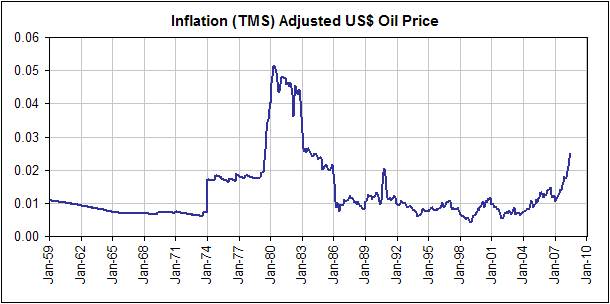
Inflation-Adjusted Prices
The data for most so-called "inflation-adjusted" charts are prepared by
dividing the nominal price by either the CPI or the PPI. However, this
is not a good way to determine the real performance of any market
because the CPI and the PPI are bogus numbers. A better way is to
adjust nominal prices such that changes in the money supply are taken
into account; that is, by dividing the nominal price by the total
quantity of money.
The inflation-adjusted charts we've shown in the past have used either
M3 or M2 to represent the total quantity of money, but as discussed in
a number of commentaries over the past several months TMS
is a much more appropriate way of measuring money supply. The long-term
inflation-adjusted charts displayed below are therefore based on the
assumption that the inflation rate equals the increase in TMS.
The first of our charts shows the inflation-adjusted performance of the
oil price from 1959 through to the present. Notice that despite the
huge gain in the nominal price of oil over the past 18 months, the
inflation-adjusted oil price is still a long way below its 1980 peak.
In other words, in US$ terms oil is not yet over-priced on a long-term
basis. It is, however, very over-priced relative to many other
commodities. Rather than saying the oil price is too high it is
therefore more apt to say that the prices of many other things are too
low relative to oil.
Our third and final inflation-adjusted chart shows the Dow Industrials
Index. When the effects of money-supply growth are removed from the
picture it becomes obvious that the Dow entered a primary bear market
in 2000.
Bonds
The following chart
shows that there has been a strong inverse relationship between the US
stock and T-Bond markets over the past 9 months (highs in one market
have corresponded with lows in the other). This relationship is
probably a consequence of the credit crisis in that during periods when
credit-related problems have shifted to centre stage the investment
demand for equities has fallen and the investment demand for the
perceived safety of T-Bonds has risen, whereas the opposite has
occurred during periods when credit-related problems have appeared to
dissipate. Notice, though, that since the middle of May the stock and
bond markets have both trended lower. This, we suspect, is because
growing evidence of an inflation problem, as opposed to the surfacing
of more credit-related problems, has been the primary cause of the most
recent stock market swoon.
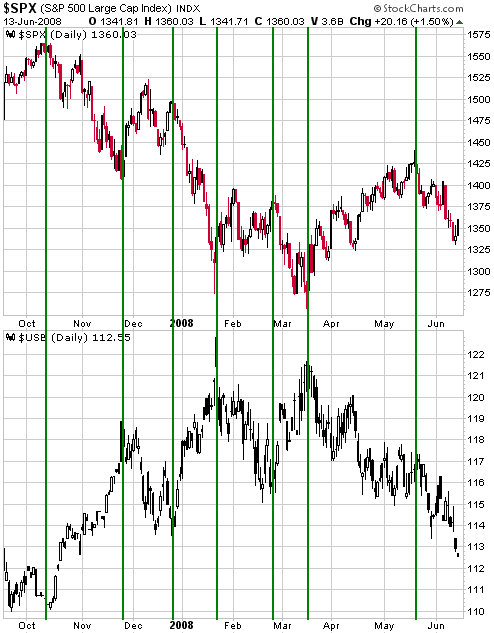
If the outward signs of inflation become increasingly blatant over the
coming weeks then stocks and bonds will probably keep moving lower
together. We see this as the worst-case outcome, but not the most
likely outcome. Rather, with more evidence of a US$ bottom having just
emerged it is more likely that both the stock and bond markets will
reach short-term bottoms over the coming fortnight. As noted in
previous commentaries, a bond market bottom prior to the end of this
month would also be consistent with this market's tendency to reach an
extreme (an intermediate-term high or low) during the May-June time
window.
While the US T-Bond market gets most of the attention, most of the
action is happening in the German and Japanese government bond markets.
For example, the following weekly chart shows that the market for
German Bunds has just experienced a veritable collapse and ended last
week at critical support defined by its 2007 low. Moreover, the 2007
low was the lowest level since August of 2002, so additional weakness
from here would take the Bund to a new 5-year low. Needless to say,
prices generally don't make new 5-year lows during long-term BULL
markets.
This is clearly a dicey situation for the Bund, but note that it is
testing important support after having fallen on 11 of the past 13
weeks. In other words, the market is now very oversold. This means that
a break below support at this time probably won't be sustained.
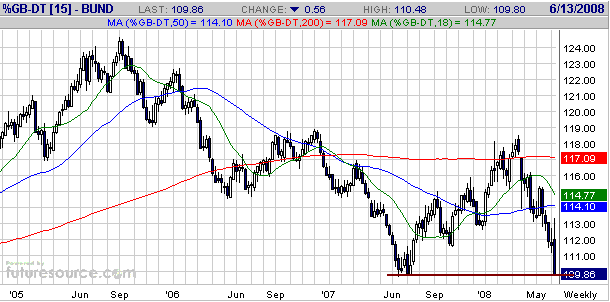
There's a good chance that a global bond market rebound will get
underway within the next couple of weeks. And even though this rebound
would probably be the counter-trend variety (a rebound within a bear
market), it could last a few months if credit-related problems return
to centre stage.
The Stock
Market
The main driver of the US
stock market's decline from last year's peak was the debt crisis that
originated in the realm of sub-prime mortgage debt and spread to many
other types of debt and derivatives. When fear associated with the debt
crisis reached panic proportions in mid March the stage was set for a
multi-month stock market rebound because such extremes of emotion
cannot be sustained for long. This rebound seemed to run out of steam
during the first half of May, but despite the heavy price action since
that time and the decisive break to new lows by the Bank Index the
credit markets have not yet signaled the resumption of the crisis. For
example, the following chart shows that the HYG/LQD ratio, a measure of
the demand for high-yield/high-risk corporate debt relative to the
demand for investment-grade corporate debt, has just returned to its
September-2007 peak. This suggests that 'investors' have been bidding
up high-yield (relatively high risk) debt securities over the past few
weeks even as the stock market has been declining, which is certainly
not what we'd expect to be happening IF the stock market had embarked
on its next major downward leg.
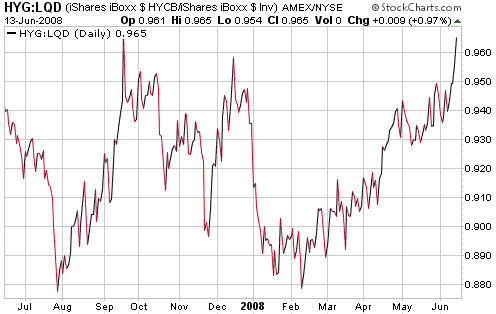
The credit-market
situation suggests that the stock market's rebound from its mid-March
low is not over. Also, the sentiment backdrop, while not yet close to
the extreme reached in mid March, has again become supportive of the
stock market. The biggest negative is the high oil price. It's
difficult to imagine the stock market returning to its recent highs
unless the oil market establishes a downward trend.
Weighing all the evidence, we suspect that if the stock market hasn't
already reached a short-term bottom it will do so within the next two
weeks.
This week's
important US economic events
| Date |
Description |
Monday Jun 16
| Net foreign purchases of US securities
|
Tuesday Jun 17
| PPI
Housing Starts
Capacity Utilisation
Industrial Production
| | Wednesday Jun 18
| No important events scheduled
| | Thursday Jun 19
| Leading Economic Indicators
| | Friday Jun 20
| No important events scheduled
|
Gold and
the Dollar
Currency Market Update
The US$ was quite strong last week in response to Bernanke's
'jawboning', although the euro still hasn't broken below the bottom of
its 3-month trading range. Also, the following daily chart shows that
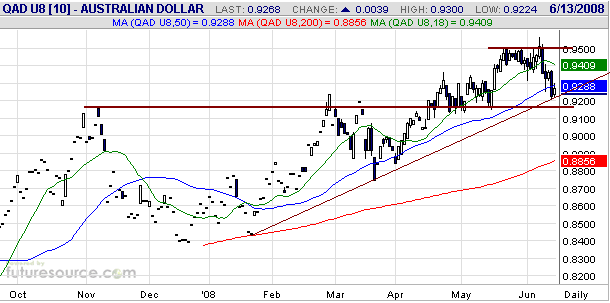
the September A$ has not yet confirmed a top.
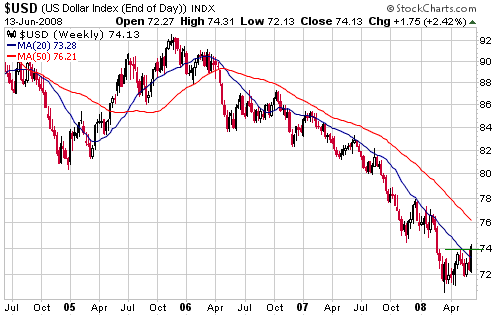
While last week's US$
rally was insufficient to cause downside breakouts in either the euro
or the A$, the following weekly chart shows that it was strong enough
to take the Dollar Index above resistance at 74. Moreover, it resulted
in the Dollar Index's first weekly close above its 20-week moving
average (the blue line on following chart) in almost 18 months. This is
evidence that the current rebound will have more staying power than the
other rebounds that have been attempted over the past year.
Also of potential
significance at this time is the performance of the Baltic Dry Index.
As we said in the 8th June Weekly Update:
"In addition to the price
action in the currency and various other financial markets, our US$
outlook is influenced by the performance of the Baltic Dry Index (BDI).
The performance of the BDI, an index of international ocean-going
freight rates, is relevant because intermediate-term turning points in
the BDI usually coincide with intermediate-term turning points in the
currency market. Specifically, BDI highs generally coincide with US$
lows and BDI lows generally coincide with US$ highs.
The following
Bloomberg.com chart shows that the BDI plunged between early November
of last year and late January of this year. We took this as a signal
that an intermediate-term US$ bottom was put in place last November,
which proved to be the case relative to the Canadian Dollar and British
Pound but not relative to other major currencies. The BDI has since
moved back to and slightly beyond its November-2007 peak, perhaps
driven by the demand for oil tankers. However, if it turns down from
near its current level then the BDI's recent performance will look very
similar to its performance last October-November."
An updated version of the above-mentioned Bloomberg.com chart is
included herewith and shows that the BDI has just reversed downward in
impressive fashion. This, taken along with the weekly Dollar Index
chart presented above, suggests that the US$ has FINALLY commenced an
intermediate-term rally worthy of the name.

The Dollar Index
could continue to rally over the coming 1-2 weeks or it could
consolidate last week's gains, but if an intermediate-term rally
actually is underway then it should remain above its 20-week moving
average on a weekly closing basis.
Gold
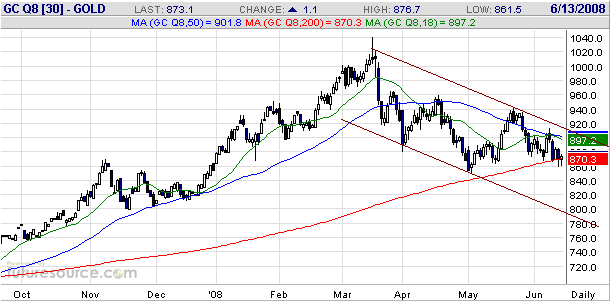
The following daily chart of August gold futures shows that the gold
market ended last week at its 200-day moving average and marginally
above its early-May low. This suggests that gold has either just
completed a successful test of its May low and is about to rally or
that it is about to plunge to new correction lows (with support at
around $800 being a likely near-term target).
We think the latter outcome is the more likely, but we do not in this
case, and nor do we ever, rely on short-term predictions. Rather, we
prepare ourselves for various possible outcomes. For example, we cannot
confidently predict that gold will drop to around $800 in the near
future, but we can unequivocally state that we will be buyers of gold
bullion IF the price drops to the low-$800s.
The potential for Fed
rate hikes in response to the increasingly obvious inflation problem is
not a serious threat to gold because the Fed cannot afford to implement
genuinely tight monetary policy. We don't think that rising
unemployment or other overt signs of economic weakness will prevent the
Fed from hiking if the evidence of an inflation problem continues to
mount, but the emergence of more problems within the banking system
almost certainly would rule out anything more than a token rate hike.
Keep in mind that the Fed exists to support the government and the
banks, not to maintain the integrity of the currency or to promote
economic growth.
Our thinking has been that gold would be weak during the first few
months of an intermediate-term US$ rally, but that once the euro bulls
had been chased out of the gold futures market the gold price would be
able to rally in US$ terms even while the US$ rallied against the euro.
To put it another way: we haven't been, and still aren't, anticipating
US$ strength; what we are anticipating is euro weakness.
Despite last week's market action there is still plenty of uncertainty
as to whether the euro is preparing to break out to the downside from
its 3-month trading range. If it does break downward then the initial
reaction of speculators will be to sell gold, but a sharp decline by
the euro would be bullish for gold beyond the very short-term,
especially if it is accompanied by a sharp decline in the oil price.
The reason is that sharp declines in EUR/USD and the oil price would
eliminate the perceived need for tighter monetary policy on the parts
of both the ECB and the Fed.
Lastly, note that a USD/EUR rally over the coming 3-6 months would be
consistent with the "1973 Model" that we've been following since early
this year. During 1973-1974, the best gains in gold and gold stocks
occurred while the US dollar's exchange rate was trending upward.
Gold Stocks
The AMEX Gold BUGS Index (HUI), a daily chart of which is displayed
below, is probably very close to a bottom in terms of time. One reason
is that the gold price will probably reach its correction low during
the INITIAL phase of the US dollar's recovery against the euro. A
second reason is that gold and gold stocks have been discounting a US$
recovery for the past three months, meaning that current prices are
already factoring-in a material amount of US$ strength. And a third
reason is that the HUI's 50-day moving average will soon move below its
200-day moving average. As discussed in previous commentaries (most
recently, the 7th May 2008 Interim Update), downward corrections in
bull markets often end at around the time the 50-day MA drops below the
200-day MA.
However, there remains a significant risk of a final plunge to end the
correction. Our guess is that such a plunge would take the HUI down to
near the bottom of the channel drawn on the following chart (the
mid-300s).
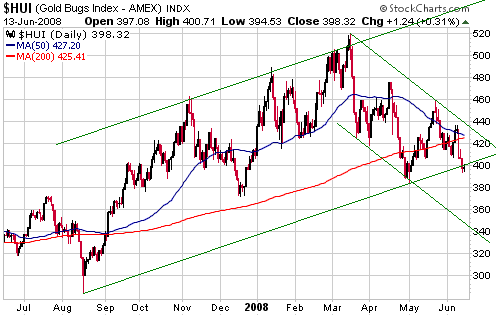
We aren't betting on
a final plunge in that our own portfolio has close to maximum exposure
to gold stocks in line with our long-term and intermediate-term views,
but as previously advised we haven't yet established any short-term
trading positions. Our plan is to purchase some January-2009 (or later)
GDX call options IF the HUI drops to the 350s.
Update
on Stock Selections
(Note: To review the complete list of current TSI stock selections, logon at http://www.speculative-investor.com/new/market_logon.asp
and then click on "Stock Selections" in the menu. When at the Stock
Selections page, click on a stock's symbol to bring-up an archive of our comments on the stock in question)
 Minefinders Corp. (AMEX: MFN). Shares: 48M issued, 60M fully diluted. Recent price: US$9.56 Minefinders Corp. (AMEX: MFN). Shares: 48M issued, 60M fully diluted. Recent price: US$9.56
In the 5th May Weekly Update we wrote:
"A
sizeable short position has built up in MFN, most likely in
anticipation of the company experiencing similar start-up problems at
its Dolores gold/silver mine over the remainder of this year to those
experienced by Gammon Gold over the past year. This means that MFN will
be given a hefty boost by a bout of short covering IF the mine start-up
goes relatively smoothly.
Buy at around US$9.50."
The following chart shows that MFN has dropped back to near support at
US$9.50 (our suggested buy zone). Furthermore, the short position is
still large.
MFN's stock price has undoubtedly been hurt by the problems experienced
over the past year by Gammon Gold (GRS) during the ramping-up of
production at a similar mining operation in the same part of the world.
Importantly, though, GRS's operation has been turned around by its new
management, which indicates that the problems previously experienced by
this company were primarily management-related rather than geological.
This suggests that MFN will not experience anywhere near the same level
of difficulty as GRS during its first year as a producer as long as
MFN's mine construction/commissioning has been better managed.
MFN is a buy near Friday's closing price of US$9.56.

Chart Sources
Charts appearing in today's commentary
are courtesy of:
http://stockcharts.com/index.html
http://www.futuresource.com/

|