![]()
![]()
![]()
![]()
-- Weekly Market Update for the Week Commencing 16th July 2018
Big Picture
View
Here is a summary of our big picture
view of the markets. Note that our short-term views may differ from our
big picture view.
The BULL market in US Treasury Bonds that began in the early 1980s ended in mid-2016, but there will be many years of topping action in bond prices and bottoming action in bond yields before major new trends get underway. A major decline in government bond prices will unfold during the 2020s. (Last update: 11 September 2017)
The stock market, as represented by the S&P500 Index, commenced a secular BEAR market during the first quarter of 2000, where "secular bear market" is defined as a long-term downward trend in valuations (P/E ratios, etc.), gold-denominated prices and inflation-adjusted prices. This secular trend will bottom in 2020 or later. (Last update: 11 September 2017)
A cyclical BEAR market in the US Dollar began in 2016-2017. (Last update: 11 September 2017)
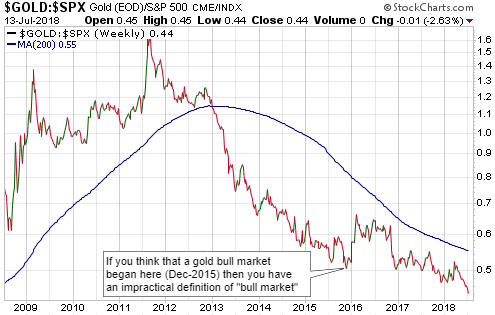
Gold commenced a secular bull market relative to all fiat currencies, the CRB Index, bonds and most stock market indices during 1999-2001. This secular trend will peak in 2020 or later. (Last update: 11 September 2017)
Commodities,
as represented by the CRB Index, commenced a
secular BULL market in 2001 in nominal dollar terms. The first major
upward leg in this bull market ended during the first half of 2008, but
a long-term peak won't occur until 2020 or later.
(Last
update: 11 September 2017)
Copyright
Reminder
The commentaries that appear at TSI
may not be distributed, in full or in part, without our written permission.
In particular, please note that the posting of extracts from TSI commentaries
at other web sites or providing links to TSI commentaries at other web
sites (for example, at discussion boards) without our written permission
is prohibited.
We reserve the right to immediately
terminate the subscription of any TSI subscriber who distributes the TSI
commentaries without our written permission.
True
Fundamentals Summary
[Notes:
1) The date shown next to the current True Fundamentals Model (TFM) signal is
when the most recent change occurred. 2) Charts of the Gold and Equity
TFMs are included in the "Charts and Indicators" section of the TSI web
site]
| Market | True Fundamentals Model (TFM) |
| Gold (US$ Price) | Bullish (29 Jun 2018) |
| US Equity (SPX) | Bearish (29 Jun 2018) |
| Currency (Dollar Index) | Bullish (27 Apr 2018) |
| Commodities (GNX) | Bearish (01 Jun 2018) |
Last week's posts at the TSI Blog
The current message from the most useful sentiment indicator
Summary of current
thinking/positioning
1) Anticipating a Dollar Index
(DX) decline to 92 and a euro rally to 1.20 within the next 2 months, but
unsure regarding the 6-12 month prospects.
2) Further evidence that
gold and silver prices are bottoming emerged last week. We expect 2-4
month rallies to begin this month.
3) There are numerous
divergences within the US stock market and the downside risk continues to
build.
4) The industrial metals markets have weakened across the
board and in some cases are now very stretched to the downside. At the
same time the oil market looks stretched to the upside on a short-term
basis. We are anticipating counter-trend rebounds in metal prices and a
downward correction in the oil price.
5) The T-Bond price should
have an upward bias for another 2-3 months.
6) Holding a cash
reserve of around 30% and looking for opportunities to build up this
reserve.
Sentiment
Overview
Gold and Silver
According to the Commitments of Traders (COT) data, there hasn't been
a capitulation of speculators in gold and silver futures yet. As would be
expected considering the price action there isn't much speculative
enthusiasm for these metals at the moment, but there remains a subtle
undercurrent of optimism.
Over the latest week the COT situations
for both gold and silver were roughly unchanged. This suggests that the
sentiment backdrop remains supportive of the gold price, but not
decisively so, and neutral as far as silver's price prospects are
concerned.
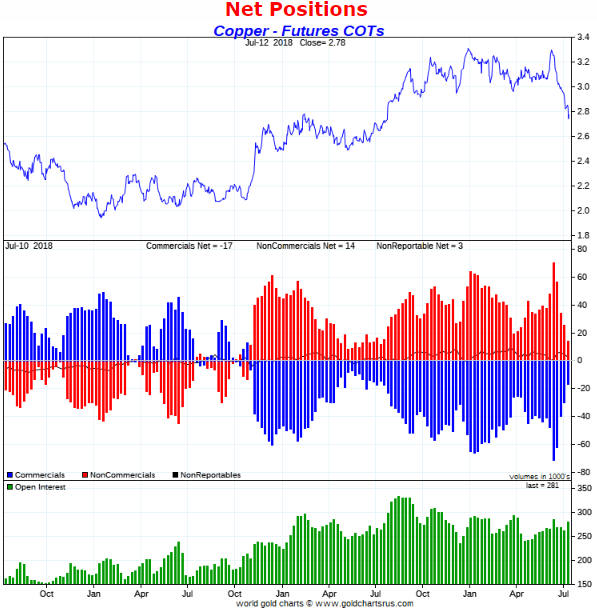
Copper
Over the past 5 weeks the
total speculative net-long position in Comex copper futures collapsed from
an all-time high to a 12-month low. Refer to the following chart for the
details. As discussed in last week's Interim Update, there has also been a
flurry of speculative long liquidation in China.
The sentiment
backdrop is now supportive of the copper price, although it's still likely
that the price will test support near $2.50 before making a sustainable
low.
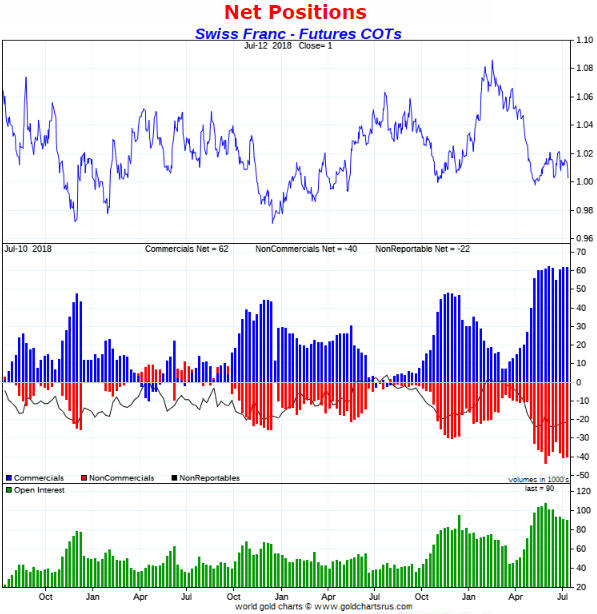
The Swiss Franc (SF)
The SF's COT situation
became very supportive 10 weeks ago and remains so. The reason is that
speculators, as a group, are maintaining their largest net-short exposure
in more than 10 years.
Not much has happened to the SF since
early-May, when the COT situation became extreme. As illustrated by the
following chart, the price (the SF/US$ exchange rate) has bounced around
in the 1.00-1.02 range while the total speculative net-short position in
SF futures has lingered near its multi-year high. This leaves the door
open to a final plunge, but with or without a final plunge it's likely
that speculative short covering will have fueled significant gains by
September.
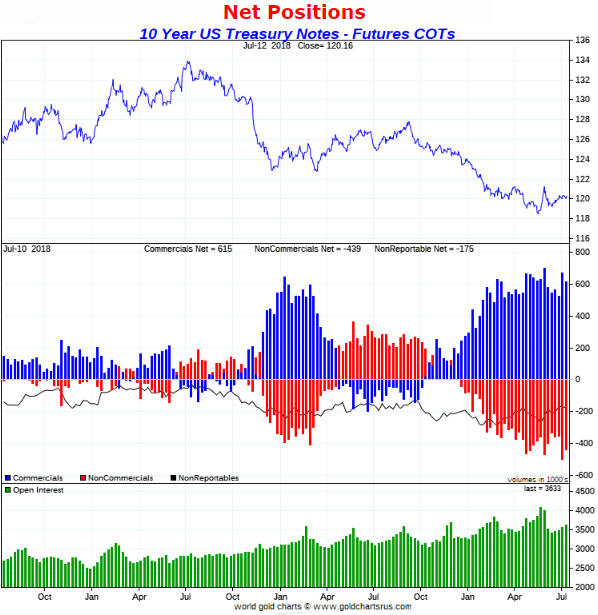
The 10-Year T-Note
The COT data indicate that
speculators have been extremely bearish on the 10-year T-Note for the past
few months and remain so, despite the accumulating evidence of an upward
trend reversal in the T-Note price.
We continue to expect that the
prices of long-dated US Treasury securities will have an upward bias until
speculators, as a group, stop betting heavily on a price decline.
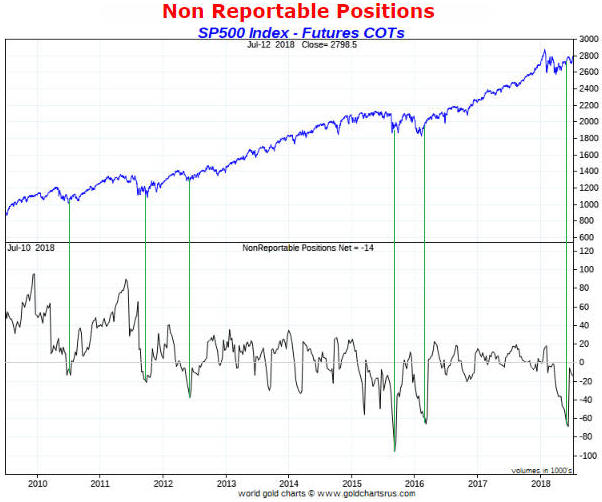
The S&P500
We generally don't use the COT
information as an indicator of stock market sentiment. This is because we
have other stock-market sentiment indicators that work better. That being
said, we recently noticed that downward spikes in the net position of
"nonreportable" (meaning: small) traders in S&P500 futures often mark
short-term SPX price lows and/or good times to buy for a short-term trade.
Refer to the following chart for details.
A sizable downward spike
in the nonreportable net position culminated about a month ago.
Unfortunately, this bullish signal muddies the waters because it conflicts
with other sentiment indicators.
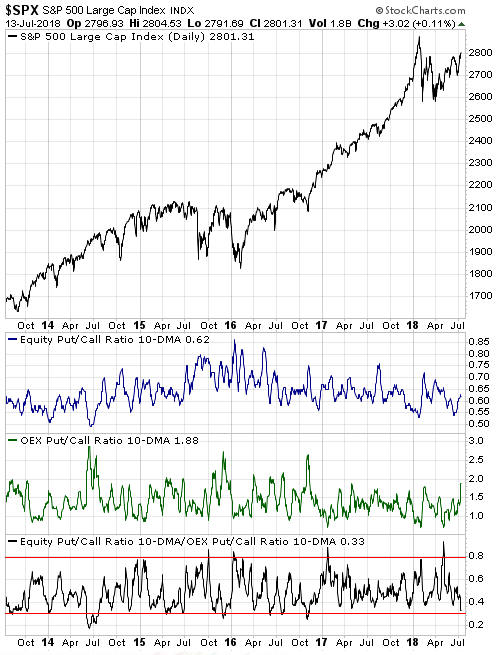
The bottom section of the following chart shows the TSI Put/Call
Indicator (TPCI), which is calculated by dividing the 10-day MA of the
equity put/call ratio by the 10-day MA of the OEX put/call ratio. When the
TPCI moves below the bottom red line on the chart it means that the 'dumb
money' is very optimistic relative to the 'smart money' and constitutes a
put/call sell signal. A put/call sell signal is very close.
Less useful than
it once was
The Baltic Dry Index (BDI) is an
index of bulk ocean-going freight rates that until about 8 years ago was a
useful indicator of both the commodity price trend and the global growth
trend (the BDI would tend to rise and fall with commodity prices and
nominal economic growth). It also could be used as an indicator of major
currency-market trends, because multi-year BDI extremes in one direction
tended to coincide with multi-year Dollar Index (DX) extremes in the other
direction. For example, important BDI highs would tend to go with
important DX lows. However, as a financial-market and economic indicator
the BDI is now much less useful than it once was.
The following
chart shows that over the past 8 years the relationship between the BDI
and GNX (the GSCI Spot Commodity Index) has been inconsistent. There has
been an overarching positive correlation since early-2015, but for the
reasons outlined below the continuation of this positive correlation
shouldn't be relied upon.
One reason that the BDI's performance can be deceptive when used as a
financial-market and global growth indicator is that it can be strongly
influenced by factors other than the volume of international trade. The
most obvious of these influences is the change in the supply of shipping
capacity. For example, a lot of new ships were ordered in response to the
boom period of 2004-2007, but most of these new ships weren't delivered
until after the boom had collapsed. The greatly increased supply of
shipping capacity then weighed on freight rates throughout 2010-2015.
The change in the composition of the international bulk shipping fleet
has been another influence on the BDI. There has been a shift towards much
larger vessels that are more efficient under normal circumstances, causing
freight rates to be lower on average than they would otherwise be.
A third potentially-strong influence on the BDI, this time in an
upward direction, is set to kick-in during 2020. We are referring to a new
rule being imposed by the International Maritime Organisation (IMO) to
limit the emissions of ships. As explained in the article posted
HERE, this new rule will force shipping companies to either spend more
money on IMO-compliant fuel or reduce emissions by slowing the speed at
which their ships travel. Either way, it will put upward pressure on the
average price of international shipping regardless of what's happening to
global growth.
Therefore, don't assume that future changes in the
BDI are indicating important changes in international trade or global
growth. The BDI is still worth monitoring, but as a financial-market and
economic indicator it is less useful than it once was.
The Stock Market
The NASDAQ100 Index (NDX) and
QQQ, the associated ETF, decisively broke into new-high territory last
Thursday. Risk-averse speculators who established bearish QQQ positions
(for example, via QID) following last Tuesday's test of the June high
could have viewed this breakout as a signal to exit with a small loss.
It's certainly possible that Thursday's upside breakout will be negated in
the near future, but the safest assumption is that the breakout is
sustainable until/unless proved otherwise.
Here's a daily chart
showing the channel that has defined the important highs and lows for QQQ
since early-November of 2016 (the time of the US Presidential election).
The channel top in the $185-$190 range should be viewed as an extreme
short-term upside target. We do not expect this target to be reached,
although to reach the channel top would require an additional gain of only
4% in a market where outrageously-expensive tech, social-media and
internet stocks are being widely viewed as safe havens.
Along with the NDX, the Russell2000 SmallCap Index (RUT) has been a
focal point of speculation. The RUT remains below last Tuesday's high, so
bearish speculations could be maintained. However, there's a high risk
that the RUT will follow the NDX into new-high territory this week.
It's an open question as to whether or not the NDX and the RUT are
close to tops. They may well be, but there is no evidence in the price
action that their upward trends are about to end. At the same time, the
index proxies for many important sectors of the market look weak. For
example, the Dow Transportation Average has broken below the bottom of a
long-term channel, the Bank Index is struggling to hold above critical
support, and both the Dow Industrials Index and the NYSE Composite Index
have been lacklustre.
Market internals are mixed. The first of the
following charts reveals that the NYSE Common-Stocks-Only Advance-Decline
Line has been trending upward and made a new high last week, despite the
lacklustre performance of the associated index (the A-D line is shown in
the bottom section of the chart). This is bullish. However, the second of
the following charts reveals a bearish divergence since early-June between
the NASDAQ Composite Index and the number of NASDAQ stocks making new
52-week highs. Clearly, last week's upside breakout by the index was not
confirmed by individual stock new-highs.
Further to what we wrote a week ago, here again is a summary of the
reasons to be concerned about short-term and intermediate-term downside
risk in the US stock market:
1. Monetary conditions are tight by
the standards of the past several years.
2. Credit spreads have
begun to widen.
3. Bank stocks are relatively weak.
4.
Industrial commodities are breaking down.
5. The put/call ratio
remains close to a sell signal, although it isn't quite there yet.
6. China's currency is weakening.
7. The Bitcoin price continues to
trend downward.
8. Equity indices are diverging.
9. The
"trade war" will lead to increased "price inflation" and reduced economic
efficiency.
We are short-term and intermediate-term bearish based
on risk-versus-reward considerations. A large decline could begin at any
time, but there is no evidence that it has already begun.
This week's
significant US economic events
[Notes:
1) The most important events
(to the markets) are shown
in bold. 2) A list of global economic events can be found
HERE]
| Date | Description |
| Monday Jul-16 | Retail Sales |
| Tuesday Jul-17 |
Industrial Production Jerome Powell Testimony |
| Wednesday Jul-18 |
Housing Starts Fed's Beige Book |
| Thursday Jul-19 | No important events scheduled |
| Friday Jul-20 | No important events scheduled |
Gold and the Dollar
Because sentiment is still not strongly supportive, rallies that began
now probably would be 2-4 month affairs that did no better than test the
highs of the past 2 years. Rallies of this magnitude could, however, yield
substantial returns for leveraged plays such as call options and mining
stocks.
It remains the case that daily closes below $1238.30 and
$15.80 would pave the way for quick declines to $1200-$1215 and $15.60 or
lower.
Platinum
After being very weak on
both an absolute and a relative basis over the past several months,
platinum showed some relative strength last week by holding comfortably
above its early-July low. To confirm that it has bottomed on more than a
multi-week basis the platinum price will have to break above former
lateral support (now resistance) in the $870s and its channel top
(currently in the $880s), but unlike the gold and silver markets the
platinum market has experienced a capitulation. This improves the
short-term and the intermediate-term risk/reward.
Note that what
happened to the platinum price about 2 weeks ago could happen to the
prices of gold and silver if the support levels that are currently under
test are violated.
As previously advised, we will add PPLT (Physical Platinum ETF) to the
TSI List as an intermediate-term trade if its price drops back to $78.00.
The current price of this ETF is $78.94.
Gold Stocks
Despite some drama in the gold and silver markets last week, with both
metals spiking below their year-to-date price lows, the gold-mining
indices and ETFs again did almost nothing. As illustrated by the following
daily chart, GDX remained within its very narrow multi-month range
throughout last week's mini-drama.
There will be an 'interesting'
rally in the gold-mining sector once metal prices turn upward from
multi-month lows.
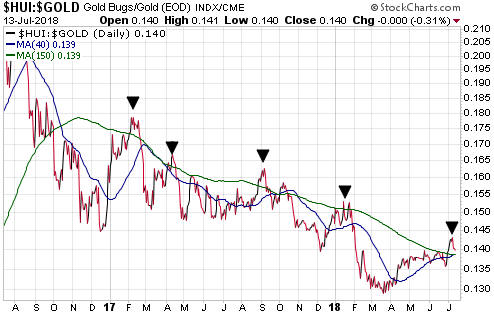
There has been strength in the gold-mining indices relative to gold
bullion since March, but at this point the strength has the look of a
counter-trend rebound. With regard to this relative strength, the
following chart shows that a) the HUI/gold ratio has just turned down
shortly after moving above its 150-day MA, and b) the previous four times
it did something similar it dropped to at least a 2-month low before
making a short-term bottom.
To signal that its current rebound is
more significant than the other rebounds of the past 18 months, HUI/gold
should hold above its 150-day MA during any additional corrective activity
and then break above its early-July high.
The Currency Market
During the first half of
May we wrote that the Swiss franc (SF) had bottomed in momentum terms,
but, as was the case in 2012 when a similar downward momentum extreme
occurred, there could be a 2-3 week 'head fake' to the upside and then a
decline to a new low prior to the start of a tradable rally. Either way,
the SF was expected to trade significantly higher within 4 months.
We got the 2-3 week 'head fake' to the upside and then a decline that
resulted in a test of the May low last Friday. Due to Friday's reversal
from support, there's a good chance that the SF has just completed a
successful test of the May low and that a double bottom is in place.
It would be reasonable to establish or add to long positions in the SF
or FXF (CurrencyShares Swiss Franc) at this time.
On Friday 13th July the Dollar Index (DX) reversed course after rising
to test resistance at 95. It's the fourth time in two months that it has
done this.
Last week's price action is consistent with our
expectation that the DX will drop back to near its 200-day MA (around 92)
within the coming two months.
Updates
on Stock Selections
Notes: 1) To review the complete list of current TSI stock selections, logon at
http://www.speculative-investor.com/new/market_logon.asp
and then click on "Stock Selections" in the menu. When at the Stock
Selections page, click on a stock's symbol to bring-up an archive of
our comments on the stock in question. 2) The Small Stock Watch List is
located at http://www.speculative-investor.com/new/smallstockwatch.html
![]() Company
news/developments for the week ending Friday 13th July 2018:
Company
news/developments for the week ending Friday 13th July 2018:
[Note: AISC = All-In Sustaining Cost, FS = Feasibility Study, FY =
Financial Year, IRR = Internal Rate of Return, ISR = In-Situ Recovery,
MD&A = Management Discussion and Analysis, M&I = Measured and Indicated,
NAV = Net Asset Value, NPV(X%) = Net Present Value using a discount rate
of X%, NSR = Net Smelter Return, P&P = Proven and Probable, PEA =
Preliminary Economic Assessment, PFS = Pre-Feasibility Study]
*Alkane Resources (ALK.AX) is carrying out exploration
work near its Tomingley gold mine in an effort to identify new deposits
that could extend the life of the operation. Last Wednesday the company
reported an encouraging intercept (7m averaging 3.43-g/t gold) from a hole
drilled 3 kms from the existing mine, but at this stage there is scant
evidence that a new economic gold deposit has been discovered.
*Golden Arrow Resources (GRG.V) had working capital of
C$12.9M at 31st March, meaning that it was in a healthy financial position
for a company of its size. However, in the 4th June Weekly Update we wrote
that the company would have to raise additional money within the coming 6
months to fund its 25% share of the capex for the Chinchillas-Pirquitas
silver operation in Argentina. We guessed at the time that it would have
to raise about C$15M.
It was announced last Thursday that GRG has
raised US$10M (C$13M at the current exchange rate) via a term loan
provided by SSR Mining, GRG's JV partner. The loan matures 2 years after
the start of production or 31st December 2020, whichever is the earlier.
The cost of the loan is high (the interest rate is the US Base Rate
plus 10%), but raising money in this way is far more cost effective than
doing an equity financing in the current market environment. We therefore
view this as good news.
*Aura Minerals (ORA.TO)
advised after the close of trading last Friday that operations at its San
Andres gold mine in Honduras were being forcefully disrupted by a small
number of trespassers. As a consequence, 2018 gold production guidance for
San Andres has been reduced from 75K-90K ounces to 65K-85K ounces. Since
ORA's EPP mine in Brazil is unaffected, this implies that total 2018
production guidance has been reduced from 130K-160K ounces to 120K-155K
ounces.
This is a concern, not so much because of the 5K-10K-ounce
reduction in expected 2018 production but because neither the local nor
national Honduran authorities have taken any effective action to date to
stop the illegal activity.
If the market reaction to this news
pushes the ORA share price down to C$2.00 or lower early this week it
could be viewed as a speculative buying opportunity. However, until the
trespassers are permanently removed there will be an unquantifiable risk.
*Premier Gold (PG.TO) reported gold production
of 16K ounces during the June quarter.
During the first half of
this year the company's 40%-owned South Arturo mine (Nevada) performed
much better than planned while the company's 100%-owned Mercedes mine
(Mexico) performed worse than planned. However, the Mercedes mine's
performance is expected to improve during the second half of 2018 and the
net result is that the mid-range of the 2018 gold production guidance has
been increased from 90K ounces to 95K ounces.
We view this news as
neutral, because a boost to the 2018 guidance became almost inevitable
after South Arturo's March quarter production came in well ahead of plan.
In other words, the increase in 2018 production guidance was 'baked into
the cake' a few months ago.
![]() List
of candidates for new buying
List
of candidates for new buying
From within the ranks of TSI
stock selections the best candidates for new buying at this time, listed
in alphabetical order, are:
1) AAU (last Friday's closing price:
US$0.71)
2) CNL.TO (last Friday's closing price: C$3.75)
3)
KBLT.V (last Friday's closing price: C$8.17)
4) PG.TO (last
Friday's closing price: C$2.67)
5) SBB.TO (last Friday's closing
price: C$1.56)
The above list is limited to five stocks. It will
sometimes contain less than five, but it will never contain more than five
regardless of how many stocks are attractively priced for new buying.
Chart Sources
Charts appearing in today's commentary
are courtesy of:
http://stockcharts.com/index.html
http://www.goldchartsrus.com/