|
-- Weekly Market Update for the Week Commencing 16th August 2004
Big Picture
View
Here is a summary of our big picture
view of the markets. Note that our short-term views may differ from our
big picture view.
Bond yields (long-term interest
rates) bottomed in June of 2003 at around 4.2% and will move considerably higher during
2004 and 2005. (Last update: 12 January 2004)
The stock market rally that
began in October of 2002 ended during the first half of 2004. The October-2002
bottom (775 for the S&P500) will be tested during 2005. (Last update: 12 July 2004)
The Dollar made an
intermediate-term
bottom in February of 2004 and will move higher into the first half of 2005. A long-term
bottom won't occur until
2008-2010. (Last update: 26 July 2004)
Gold made an intermediate-term
peak during the first half of 2004, but a long-term peak won't occur until 2008-2010. (Last update: 12 July 2004)
Commodities, as represented
by the CRB Index, made an intermediate-term peak during the first
half of 2004, but a long-term
peak won't occur until 2008-2010. (Last update: 12 July 2004)
Copyright
Reminder
The commentaries that appear at TSI
may not be distributed, in full or in part, without our written permission.
In particular, please note that the posting of extracts from TSI commentaries
at other web sites or providing links to TSI commentaries at other web
sites (for example, at discussion boards) without our written permission
is prohibited.
We reserve the right to immediately
terminate the subscription of any TSI subscriber who distributes the TSI
commentaries without our written permission.
Oil
The risk premium
There are signs that a lot of the strength in the oil price over recent
months is due to factors other than rising commercial demand, that is,
there are signs that a substantial risk premium has been built into the
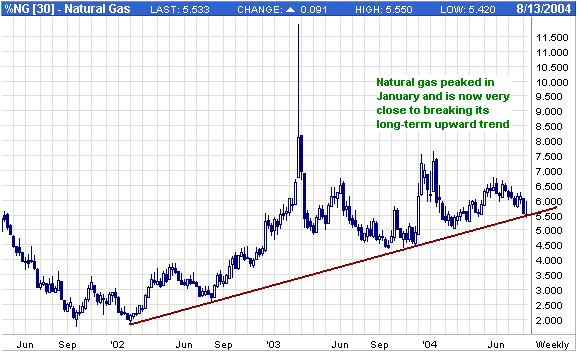
oil price. For example, while the oil price has surged over the past
two months the natural gas price has fallen and is now in danger of
breaking below its long-term upward trend (refer, below, to the weekly
chart of natural gas futures). This divergence between the prices of
oil and gas would be odd unless oil was being driven higher by the
threat of a supply shock caused by geopolitical upheaval and/or
terrorism, especially since the long-term supply/demand fundamentals
for natural gas are, if anything, more bullish than the long-term
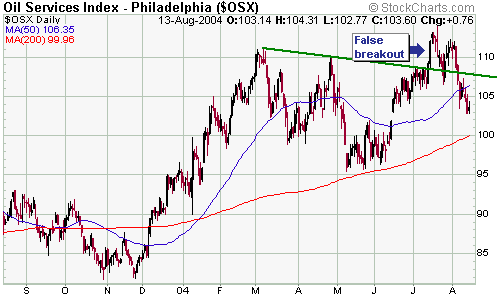
supply/demand fundamentals for crude oil. Also, the oil services
stocks, which have a stronger positive correlation with the oil price
than do the stocks of oil producers, have not benefited from the most
recent surge in the oil price. In fact, the Oil Services Index (OSX), a
daily chart of which is included below, has dropped back to levels that
would be consistent with an oil price in the $32.50-$35.00 range.
We don't want to
downplay the effect of Fed-sponsored credit excess on the price of oil
as the inflation policies of the Fed and other central banks pretty
much guarantee that we are going to see a sustainable move in the oil
price to well above $50 within the next few years. However, we don't
think the oil price would be near $46 right now unless the risk of a
supply shock, most likely related to terrorism, was genuinely high at
this time. Therefore, we'll probably get an 'event' over the coming 2
months that leads to an upward spike and subsequent downward reversal
in the oil price (similar to what happened during September of 2001 and
February-March of 2003) or the fears of a supply shock will gradually
dissipate. Either way, we expect that the oil price will drop back to
the mid-30s or lower within the coming 6 months.
The oil/gold ratio
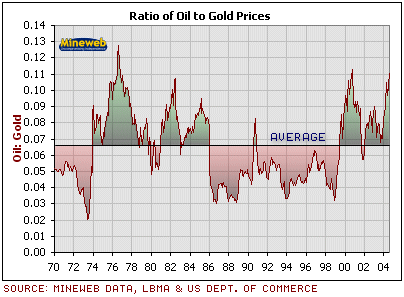
In our opinion only two sensible conclusions can be drawn from the
following long-term chart of the oil/gold ratio (the chart was taken
from a recent article at www.mineweb.com). First, the "average"
oil/gold ratio is irrelevant because the ratio spends the bulk of its
time either well above or well below its long-term average. Second, the
oil price is presently about as high as it ever gets relative to the
gold price so gold is likely to out-perform oil by a wide margin over
the coming years.
Bonds
Outlook
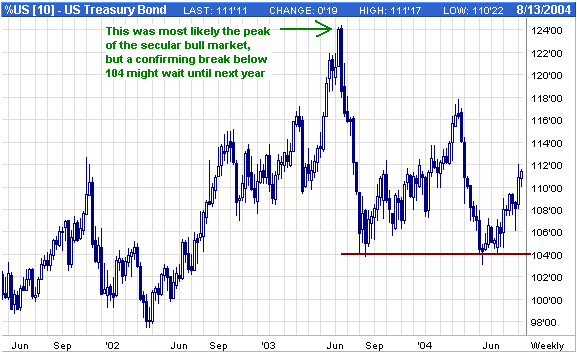
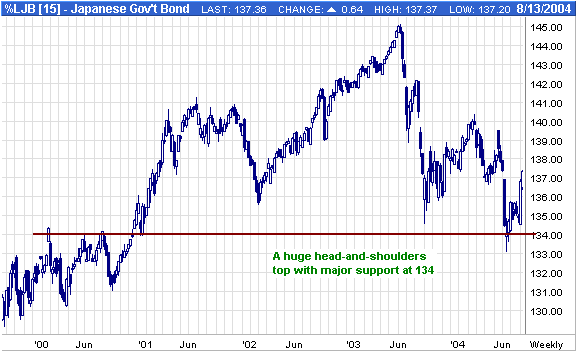
The below weekly charts of US T-Bond futures and Japanese Government
Bond (JGB) futures reveal huge multi-year topping patterns. The JGBs
have made what looks like a large head-and-shoulders top while last
year's blow-off move to the upside and subsequent crash in the US bond
market has been followed by a lengthy 'right extension' (a
consolidation that should eventually end in a downside breakout).
At the beginning of this year we would have expected the breakdown in
US bonds to have occurred by now, but the bond market has defied
gravity for a number of reasons. One is that foreign central banks have
continued to absorb a lot of supply (the quantity of US Treasury and
Agency debt held by the Fed on behalf of foreign central banks has
increased by a phenomenal $189.5B since the beginning of this year).
Another is that many speculators have been bearish on bonds, meaning
that there has consistently been a lot of short-covering fuel available
to propel bond prices upward whenever the short-term trend has turned
positive. But most importantly, with one or two brief exceptions
inflation expectations have remained low-key.
Our thinking at this time is that a break below major support by US
bonds won't occur until the first half of next year. This is because a)
sentiment towards bonds remains very bearish (it would be difficult for
a large decline to begin when trend-following speculators are already
net-short in a big way), and b) the oil price has just made a new high
for the move so the oil-bond relationship previously discussed at TSI
(turning points in oil have tended to lead turning points in bonds by
about 3 months over the past two years) predicts that bonds will remain
firm until at least November.
Why the stock market is a more attractive 'short' than the bond market
We have been intermediate-term bearish on stocks and bonds since early
this year, but as first explained in a commentary a few months ago we
think the US stock market makes a much better short-sale candidate than
the US bond market. Here's why:
a) Sentiment (sentiment towards stocks has been relentlessly bullish
despite the lousy price action and deteriorating fundamentals whereas
sentiment towards bonds has been bearish for much of this year).
b) Terrorism (if there were a successful large-scale attack by
terrorists the stock market would plunge whereas Treasury Bonds would
probably rally due to flight-to-safety buying).
c) The substantial support provided to the US bond market by foreign central banks.
d) The common misapprehension that a drop in the rate of real economic growth will reduce the inflation threat.
e) When bonds do finally break below major support the stock market is
likely to fall further than the bond market due to the effect that
higher interest rates will have on price/earnings ratios.
The Stock
Market
Current Market Situation
All the large declines in the stock market over the past several years
have been led by the tech sector and, in particular, by the NDX/Dow
ratio. The recent breakdown by NDX/Dow is therefore a sign that a large
decline is in progress. However, the below chart shows that the SOX/CRX
ratio (the ratio of Semiconductor stocks to commodity-related stocks)
is nearing its October-2002 bottom, which suggests that we are rapidly
approaching a point where weakness will need to spread-out through the
market rather than being concentrated in the tech sector in order for
the decline to progress much further. What this means is that we will
probably have to see some short-term weakness in bonds combined with
strength in the US$ in order to increase the downward pressure on the
commodity-cyclical stocks. On the other hand, in the current
environment additional dollar weakness would lend support to non-tech
stocks in general and commodity stocks in particular and would
therefore limit the downside in the overall market.

Below is a daily
chart of the S&P500 Index. Former support in the 1080-1090 range
should now provide strong resistance and should limit the extent of any
near-term rebound.
Our view is that
having come this far the market will continue lower into the
September-October period, a likely time for a low from a seasonal
perspective. One indicator to watch if the downward trend does continue
as per our expectation is the percentage of NYSE stocks above their
200-day moving averages. The below chart suggests that once this
indicator drops below 20 the market will be close to an
intermediate-term bottom.
This week's
important US economic events
| Date |
Description |
| Monday Aug 16 | No significant events |
| Tuesday Aug 17 | CPI
Industrial Production
Capacity Utilisation
|
| Wednesday Aug 18 | No significant events
|
| Thursday Aug 19 | Leading Economic Indicators
|
Friday Aug 20
| No significant events
|
Gold and
the Dollar
Gold versus the Dollar
On Friday 6th August the US$ spiked lower and gold spiked higher in
response to news that US employment growth had been much weaker than
expected over the preceding month. The dollar then rebounded for a few
days while gold pulled back, but last Friday there was another spike
lower in the dollar and upward spike in the gold price. This time the
moves were in response to news that US producer prices rose by only
0.1% in July and that the US trade deficit had hit a new all-time high.
It's rarely the case that trends in the markets -- even short-term
trends -- actually change in response to news. Instead, news tends to
lag price (bad news, for example, often appears AFTER a market has been
trending lower for some time) while knee-jerk reactions to news will
often act to mask the real trends and, in so doing, keep the majority
of market participants in a state of confusion. Having said that, the
below chart provides some preliminary evidence that the dollar's
intermediate-term trend might have reversed from up to down.
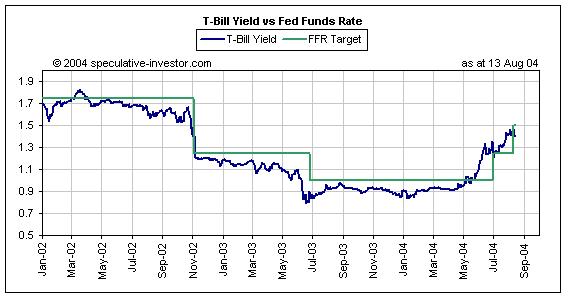
With the Fed having just hiked the Fed Funds Rate (FFR) target to 1.50%
the T-Bill yield SHOULD be above 1.50% and on its way to 1.75% in
anticipation of another 0.25% rate hike at the September FOMC Meeting.
However, the T-Bill yield ended last week 0.1% BELOW the target FFR,
suggesting that doubt is starting to creep into the market with regard
to the Fed's ability/willingness to implement any more rate hikes this
year. Given the importance of interest rate differentials to currency
exchange rates at the present time, if this doubt continues to build
then the US$ is in trouble. This is because a Dollar Index in the 88-90
range appears to already discount a further 0.50% increase in the Fed
Funds rate over the remainder of this year and at least 1% of
additional rate hikes next year. So if the market starts to believe,
for instance, that we've had all the rate hikes we are going to get for
this year, the dollar will probably drop to new lows.
At this stage we are
going to maintain our bullish intermediate-term view on the US$ because
the price action in the gold and currency markets does not point to a
significant trend change having just occurred. Rather, the technical
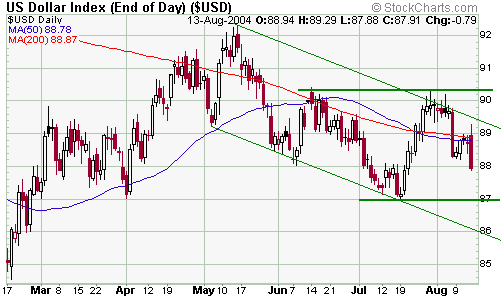
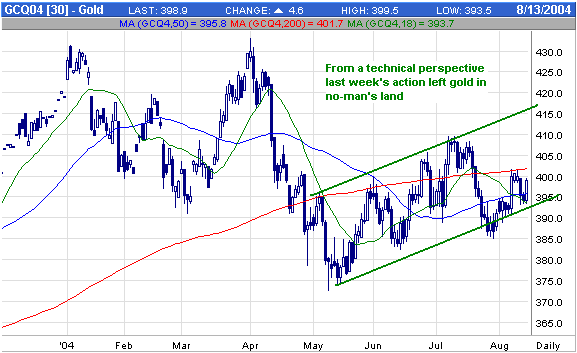
picture as represented by the following daily charts of the Dollar
Index and August gold futures is indecisive. In particular:
a) The Dollar Index remains comfortably below important resistance at
90.50, but despite the recent bad news it also remains above its July
low. That is, as negative as the recent US economic news has been the
dollar is above where it was at this time last month.
b) Gold held above its 18-day moving average during last week's
pullback, but failed to move above its 200-day moving average or to
even make a new high for the week in response to Friday's
dollar-bearish news.
Also, there was only modest strength in gold stocks relative to the
gold price last week and this strength was mostly the result of a surge
in the prices of the South African gold shares (discussed below).
The bottom line is
that nothing really changed as a result of last Friday's news. We
therefore continue to expect that the Dollar Index will work its way
higher over the coming 6 months and that gold will be available at
lower levels at some point between now and November (from a seasonal
perspective November is the most likely time for a correction low). We
wouldn't be surprised, though, if gold traded higher and the dollar
traded lower over the coming few weeks in similar fashion to what
happened during 2001 at around the same time of the year (in 2001 gold
rallied into the first half of September before pulling back and making
a correction low in late November).
Before moving onto something else it's worth making a few more comments about last Friday's news.
First, based on what we've read the mainstream press appears to have
blamed the trade report for Friday's drop in the US$. We think,
however, that the currency markets were reacting more to the
lower-than-expected PPI than to the higher-than-expected trade deficit
because a low PPI would tend to reduce the pressure on the Fed to hike
rates whereas a high trade deficit would tend to increase the upward
pressure on interest rates.
Second, the $$55.8B monthly trade deficit that got a lot of
commentators worked up on Friday was for June, that is, the effect of
this net out-flow of $55.8B must have been fully factored into currency
exchange rates more than 6 weeks ago.
The importance of Friday's balance of trade report is much more
long-term than short-term because it shows that a) the process of
working off the excesses associated with the US's credit-induced boom
is still in its infancy, and b) domestic prices in the US are rising
faster than international prices (the trade deficit is expanding
because it is making increasingly more sense for Americans to buy from
overseas than to buy locally, and this could only be the case if the
dollar's foreign exchange value was holding up better than its domestic
value). Therefore, Friday's trade news supports our view that the US$
is ultimately headed MUCH lower, but doesn't invalidate our
intermediate-term bullish view. In the short- or intermediate-term the
dollar can rally in the face of an expanding trade deficit depending on
what is happening with interest rate expectations. In fact, it did
rally for three weeks during July and August despite the $55.8B deficit
in June and probably a similar deficit in July.
Gold in terms of other currencies
Gold/Euro
Below is a 3-year chart of gold in terms of the euro. We interpret this
chart bullishly in that gold/euro appears to be forming a large
head-and-shoulders base with a 'neckline' at around 350. We don't have
a firm opinion on when an upside breakout from this basing pattern will
occur, although if forced to make a guess we'd say it will occur before
the end of this year. This is because by September of this year the
'right shoulder' will be equivalent, in terms of time, to the 'left
shoulder'.

Gold/Rand
They say that a journey of a thousand miles begins with a broken fan
belt and a leaky tyre. This saying applies to our bullish views on gold
in terms of the South African Rand and the South African gold stocks
because these views have certainly run into some trouble over the past
few months. It's likely, though, that we did correctly identify the
bottoms for gold/rand and the SA gold stocks in the 2nd August Weekly
Update when we said:
"There are some
preliminary signs...that the turning point for the SA gold stocks is at
hand. In particular, bearish sentiment towards these stocks appeared to
reach a crescendo over the past few weeks and the Rand gold price might
have just completed a successful test of last year's low."
And:
"...we think that buying HMY or GFI near current levels would work well for anyone with an investment timeframe of 1-2 years."
Since that time the Rand gold price has broken its short-term downtrend
while HMY and GFI have risen by 10% and 14%, respectively, compared to
a 1% gain for Newmont Mining. Charts of gold/rand, HMY and GFI are
shown below.
The Rand gold price
got a boost last Thursday when South Africa's central bank cut the
official interest rate from 8.00% to 7.50%. The latest Consumer Price
data for South Africa shows a 5% increase in the CPIX (the CPI
excluding interest rates on mortgage bonds) between June of 2003 and
June of 2004, so a 7.5% nominal rate still suggests a positive 'real'
interest rate. However, as previously explained the correct way to
calculate the real interest rate is to subtract the EXPECTED inflation
rate from the nominal interest rate, so the recent downturn in the Rand
and the upturn in gold/Rand might be indications that the market is
anticipating an increase in South Africa's CPI over the coming 6-12
months.
Our view is that gold/rand has made a sustainable turn higher and that
a period of out-performance by the SA gold shares has begun. It's
generally a good idea not to buy stocks following a quick-fire 10-15%
up-move, but both GFI and HMY still offer excellent value for investors
near current prices. In some respects Durban Deep (NASDAQ: DROOY)
offers even better value thanks to its recent tumble, but while DROOY
might be suitable for a small speculation it is not investment-grade.
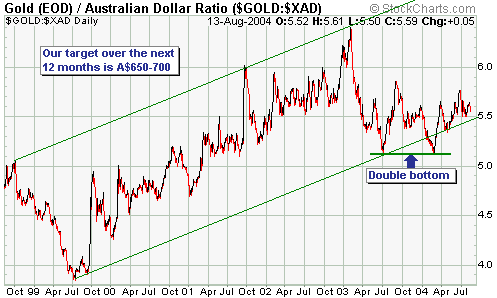
Gold/A$
Below is a 6-year chart showing the long-term upward trend in the A$
gold price. Gold/A$ briefly moved below its channel bottom earlier this
year, but in so doing it completed a successful test of its 2003 low
and built what looks like a solid base. Our view is that gold/A$ will
move up to near its channel top over the coming 12 months.
Gold Stocks
Friday's rally in the gold sector took the AMEX Gold BUGS Index (HUI)
above its 50-day moving average but left it well below important
resistance.
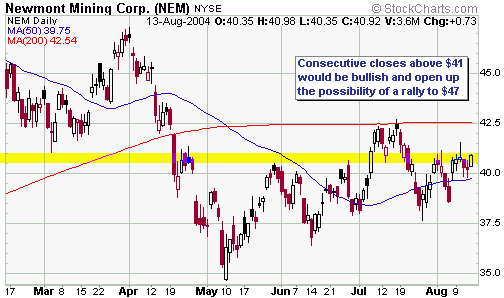
Newmont Mining (NEM)
is, however, closer to achieving a significant upside breakout.
Specifically, if NEM can close back above $41 over the coming week it
will suggest that a sharp rally into the first half of September is on
the cards. Therefore, if you have hedged your gold stock portfolio via
NEM put options you should consider removing this hedge if NEM achieves
consecutive daily closes above $41.
Our view is that gold
stocks will make an important low in November (within spitting distance
of the May low), but we see the potential for them to rally over the
coming month or so. Whether or not there's an upward move or a downward
move in the short-term doesn't, however, affect our strategy because
our strategy is simply to accumulate our favourite gold stocks in
preparation for the next major advance during those times when the
intermediate-term risk/reward is attractive. For example, we added
Golden Star Resources (AMEX: GSS) to the Stocks List last week at
US$3.84 and consider the risk/reward for this stock to be attractive at
$4 or lower. So, a reasonable approach would be to take an initial
position at around the current price ($3.98) with a plan to buy more if
it dropped to $3.50 and to buy more again if it dropped to $3.00. The
opportunity to buy GSS at these lower prices might never present
itself, but if it did you'd end up with an average cost of around $3.50
and would be well positioned to achieve a 100%-200% profit over the
coming 2 years. On the other hand, if the stock has already bottomed
and is in the early stage of a major advance then at least you'd have
some exposure.
Update
on Stock Selections
 Gold
Fields Ltd (NYSE: GFI) has agreed to merge its non-South African assets
with IAMGold (AMEX: IAG) to form a new company called Gold Fields
International. Neither GFI nor IAG are current members of the TSI
Stocks List, but we've mentioned both stocks as potential buys over the
past few months and will therefore comment on the merger. Gold
Fields Ltd (NYSE: GFI) has agreed to merge its non-South African assets
with IAMGold (AMEX: IAG) to form a new company called Gold Fields
International. Neither GFI nor IAG are current members of the TSI
Stocks List, but we've mentioned both stocks as potential buys over the
past few months and will therefore comment on the merger.
Based on the prices of the two stocks prior to the announcement of the
merger, GFI is contributing 10.9M ounces of reserves and 1.55M ounces
of annual production to the combined company in exchange for US$2.1B of
IAG stock; meaning that under the terms of the deal GFI's reserves and
production were being valued at US$193/ounce and $1354/ounce,
respectively. On the surface the deal therefore looks attractive for
GFI shareholders because the company's total reserves and production
were being valued by the market at only $70/ounce and $1200/ounce prior
to the deal. However, if we apply a value of $193/ounce to GFI's
pre-merger international reserves then we find that its South African
reserves were being valued at around $53/ounce, which is almost the
same value that the market was placing on Harmony's total reserves. In
other words, although GFI's management said that a benefit of the
merger would be to highlight the greater value of GFI's international
assets relative to its domestic assets it is clear that the market was
already factoring this higher value into GFI's stock price prior to the
merger announcement.
Further to the above, we don't see the merger as releasing any value to
GFI shareholders in the short-term. We do, however, think it's a good
deal for GFI shareholders because it will allow the company's current
international growth strategy to be pursued more aggressively. We also
think the deal is a good one for IAG shareholders because the company
is being given the opportunity to use its relatively expensive stock to
purchase high-quality gold assets at a reasonable price.
 We
currently have a position in Phelps Dodge (PD) put options in
anticipation of a drop back to $60 or lower over the coming 2 months.
We think PD October $60 put options are a reasonable speculation with
PD between its current price and $80, but would exit this position if
PD managed consecutive daily closes above $81 because such an outcome
would be a significant upside breakout. We
currently have a position in Phelps Dodge (PD) put options in
anticipation of a drop back to $60 or lower over the coming 2 months.
We think PD October $60 put options are a reasonable speculation with
PD between its current price and $80, but would exit this position if
PD managed consecutive daily closes above $81 because such an outcome
would be a significant upside breakout.
 We'll send out an e-mail to subscribers on Tuesday with updates on a few of the stocks in the TSI List. We'll send out an e-mail to subscribers on Tuesday with updates on a few of the stocks in the TSI List.
Chart Sources
Charts appearing in today's commentary
are courtesy of:
http://stockcharts.com/index.html
http://www.futuresource.com/
http://www.decisionpoint.com/

|

